
 ?Mathematical formulae have been encoded as MathML and are displayed in this HTML version using MathJax in order to improve their display. Uncheck the box to turn MathJax off. This feature requires Javascript. Click on a formula to zoom.
Abstract
The decline of soil fertility and limited adaptive cultivars are some of the factors that affect crop production. This study aimed to examine the response of Rhizobium inoculated common bean varieties to NPSB fertilizer application for nodulation, yield, and yield related traits. Three varieties of common bean (Local, Loko, and Nasir) were combined with four rates of blended NPSB (0, 50, 100, and 150 kg ha−1) fertilizers in randomized complete block design with three replications arranged factorially. The result revealed significantly highest number of total nodules (53.7), effective nodules per plant (35.54), number of pods per plant (7.4), plant stand count (87%), biomass (17.5 t ha1), seed yield (2996 kg ha1), and harvest index (16.67%) were recorded at the rate of 100 kg ha−1 NPSB which was 183%, 60%, 100%, 19%, 56%, 112%, and 33.3% increment over the control, respectively. Nodules fresh weight and nodules dry weight per plant showed 188% and 344.8% improvement over control, respectively. Nassir variety was higher in nodulation and yield, while Loko variety had long rooting which has implication on nitrogen fixation and plant nutrition. Thus, the result suggests that highest seed yield was achieved from variety Nasir (2996 kg ha−1) with 100 kg ha−1 blended NPSB combination producing net benefit ha−1 of 79,245.78 ETB (Ethiopian Birr).
Introduction
Common bean (Phaseolus vulgaris L.) originated from Central and South America, where it was cultivated as early as 6000 BC in Peru and 5000 BC in Mexico (Bitocchi et al. Citation2013). Species P. vulgaris L. is the genus of Phaseolus which has approximately 80 cultivated and wild species (Porch et al. Citation2013). The global common beans production was 57,496,465 tons produced on 38,229,984 hectares (FAO Citation2008). In Ethiopia, it was cultivated on about 281,083.49 hectares of land from white and red haricot bean, producing 4, 85,547.093 tons with the productivity of 1.73 tons ha−1 (CSA Citation2019), which is low as compared to yield potential. Legumes play a major role in cropping systems, mainly as a source of symbiotic fixation of atmospheric nitrogen as fertilizer and in crop rotations (Graham Citation2008). However, soil nutrient deficiency like low soil nitrogen and phosphorus, and acidic soil conditions are important limitations for common bean production in most areas (Graham et al. Citation2003) and the decline of soil fertility necessitates the application of some amount of fertilizer which would be also essential in biological nitrogen fixation. The recent rapid increase in population growth, improper application of inorganic fertilizers, organic matter depletion, nutrient imbalance, and land degradation owing to several man-made activities are exerting considerable pressure on sustainable agriculture. Therefore, it is important to sustain optimum levels of organic matter in degraded soils (Tauqeer et al. Citation2022).
Nevertheless, in leguminous crops, achieving high yields is not possible by relying solely on nodule fixed nitrogen and the addition of N fertilizer can considerably increase the yields of leguminous crops (Zhang et al. Citation2020). Thilakarathna and Raizada (Citation2018) stated that symbiotic nitrogen fixation is a sustainable and economical alternative nitrogen source to legume crops. And it can minimize high costs of nitrogen fertilizer and reduce its associated negative impacts to the environment (Khan et al. Citation2020). Rhizobia are considered as plant growth promoter which occurs in symbiosis with legumes taking the advantage of nutrients from plant root exudates. When interacting with legumes, rhizobia help in increased plant growth through enriching nutrients by nitrogen fixation, solubilizing phosphates, and producing phytohormones, and rhizobia can increase plants’ protection by influencing the production of metabolites, improve plant defense by triggering systemic resistance induced against pests and pathogens (Mabrouk et al. Citation2018).
Concerning the effect of host genotype, research on legumes showed genetic differences in the preference for specific symbionts (Lafay and Burdon Citation1998). And a large number of rhizobia species capable of nodulating the common bean indicates that there exist diverse bean–rhizobia interactions (Graham Citation2008) which sometimes require the inoculation of rhizobium combined with different treatments to improve its efficiency. For example, the treatments combining Rhizobium inoculation with essential oils showed a positive effect on nodulation and plant height (Turan et al. Citation2019). Rhizobia formation is induced by N fertilizer application and promotes vegetative growth during early growth period eventually improving high yield (Yin et al. Citation2018). While phosphorus application has an important role in the growth, development, and yield productivity of common beans as it is involved in various metabolic processes such as photosynthesis, respiration, and signal transduction, among others (Fageria and Baligar Citation2016).
Nodulation, plant height, days to maturity, dry weight, and pods per plant have been significantly improved by the application of sulfur resulting in maximum seed yield per plant or hectare (Deeksha et al. Citation2019). Furthermore, boron has several essential contribution in plant physiological processes (Abou Seeda et al. Citation2021) and further soil pH has a major influence on its availability (De Sá and Ernani Citation2016). Therefore, inoculating Rhizobia to legume seeds before planting enhances the growth, the yield of legume crops, and provides nitrogen and organic carbon for subsequent or associated crops (Fact sheet Citation2016). And Rhizobium inoculants improve soil fertility by maintaining or improving soil nitrogen levels through fixation, legume crops can fix atmospheric nitrogen through root nodules by rhizobium bacteria, which would minimize the application of nitrogen fertilizer to the crop (Matny Citation2015). Moreover, nodulation may be influenced by the varietal differences and the fertility level. However, loss of soil fertility and unbalanced fertilizer rate requirements were among production constraints in crop production (Mesfin Citation2009; Ahmed et al. Citation2017).
Because of this, the response of common bean to different levels of NPSB and nodulation capacity in the acidic region is useful in sustainable fertility management and encourages research for wide application. Thus, this study was carried out to estimate the effect of the combined application of NPSB fertilizer levels and R. leguminosarum phaseoli inoculated common bean varieties on the nodulation, yield, and yield components of common bean varieties as well as the potential economic gain.
Materials and methods
Description of the study area
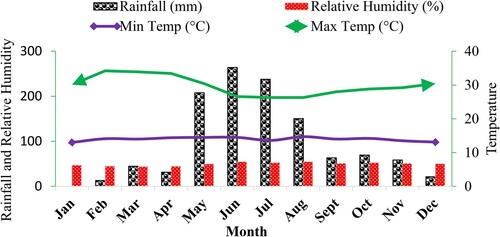
The experiment was conducted at Bako Agricultural Research Center (BARC), western Showa Zone, Oromia State in the 2020 main cropping season. The geographical location of Bako Agricultural Research Center was 37°09′ East longitude and 09°06′ North latitude. The area is situated at about 250 km west of Addis Ababa, Ethiopia, and is located at a low altitude (about 1650 meters above sea level). The experimental site has a humid warm climate of 13°C and 34°C, minimum and maximum annual temperatures, respectively. The area receives an annual rainfall of 1024.30 mm mainly from April to October with maximum precipitation from May to October (Figure ). The predominant soil type of the area is Nitosols which are characteristically reddish brown and clay in texture with pH that falls in the range of very strongly acidic.
Figure 1. Monthly total rainfall (mm), relative humidity (%), mean minimum and maximum temperature (°C) of Bako research station during 2020.
Description of experimental materials
Variety: A common bean Nasir, Loko, and one local variety which are adapted to the agro-ecology of the area were used for the study.
Bio-fertilizer: Rhizobium strain known as R. leguminosarum phaseoli (HB-429) was used for the inoculation of common bean varieties (EIAR Citation2014).
Treatments and experimental design
The experiment was conducted using four levels of NPSB blended fertilizer (i.e. 0, 50, 100 and 150 kg/ha−1) and three common bean varieties (i.e. Nasir, Loko, and local). The treatment was arranged in 4 × 3 factorial combinations with a total of 12 treatments in a randomized complete block design (RCBD) with three replications. Blended fertilizer was applied as basal and it contains 18.7% N, 37.4% p2o5, 6.9% S, and 0.25% B, (ATA Citation2015). The gross plot area was 7 rows and each row accommodated 30 plants of 3 m length (7 × 0.4 m × 3 m = 8.4 m2) or (width is 2.8 m × 3 m = 8.4 m2) and one row each from both sides of the plot was left as a border row and again one row of both sides of the plot was used for destructive sampling. Thus, the central three rows (3 × 0.4 m × 3 m = 3.6 m2) were used for data collection.
Experimental procedures
The land was plowed, disked, and harrowed using a tractor. Plots were leveled manually and sowing was done on June 27 in 2020. Spacing of 40 and 10 cm between rows as well as plants within rows, respectively, were used for planting. Blended fertilizer NPSB was drilled in rows just before sowing at the rate of 0, 50, 100 and 150 kg ha−1 to all treatments uniformly at the time of sowing. Furthermore, 1 and 0.5 m path between blocks and plots, respectively, was also applied. After 10 days, the two seeds sown per hill were thinned to one and other recommended agronomic and management practices were uniformly applied.
2.4.1. Methods of inoculation: Carrier-based inoculants of the strain were applied at the rate of 6.25 g of inoculants per kg of seed (EIAR Citation2014) and inoculation techniques suggested by Rice et al. (Citation2001) were followed. Carrier-based inoculants of each strain were applied at the rate 6.25 g of inoculants per kg of seed. The inoculants, R. leguminosarum phaseoli (HB-429) were mixed with sugar with the addition of water (250 ml/25 kg of seed) in order to facilitate the adhesion of the strain on the seed. To ensure that the applied inoculants stick to the seed, the required quantities of inoculants were suspended in 1:1 ratio in 10% sugar solution. The thick slurry of the inoculants was gently mixed with the dry seeds so that all the seeds received a thin coating of the inoculants. To maintain the viability of the cells, inoculation was done under the shade and allowed to air dry for 30 min and sown at the recommended spacing. Seeds were immediately covered with soil at a depth of 2–3 cm after sowing to avoid death of cells due to the sun’s radiation. A plot with un-inoculated seeds was planted first to avoid contamination, then next inoculated seeds were planted by different persons as per strain types, moreover any contamination was avoided through developing the method of planting orders.
2.4.2. Soil sampling and analysis: Using a cylindrical auger a representative soil sample was taken at a depth of 0–20 cm randomly in a zigzag pattern from 15 spots from the experimental field before planting. And to determine the soil physic-chemical properties from the experimental land, a composite soil sample was prepared. In pre-planting soil analysis, particle size distribution was done by the hydrometer method (Fao Citation2008) using particles less than 2 mm diameter which measures % of sand (0.05–2.0 mm), silt (0.002–0.05 mm), and clay (<0.002 mm) fractions.
Data collection
The total number of nodules: The nodule population was assessed at 50% flowering stage. Ten randomly selected plants were uprooted and the soil adhering was washed from it with tap water to clean the roots and nodules from the top and lateral root parts were removed separately and spread on a sieve for some time until all the water had drained from the surface of the nodules. Then, the nodule number/plant was counted and averaged/plant. The average nodulation rating of each treatment was obtained as described by Karikari and Addy (Citation2015):
where a is the number of plants showing tap root nodulation, b the plants with nodules in secondary roots close to the tapping root, c the plants with dispersed nodulation, and d the plants without modulation.
Effective nodule number: The nodule was checked for a pink to dark-reddish color for effective nodulation by cutting with a sharp blade, whereas inactive nodules (non-effective nodules) were black, gray, or greenish, white on the inside of nodules (Purcell et al. Citation2014). The number of effective nodules per plant was recorded by counting and the average per plant was taken.
Nodule fresh weight: The nodules were collected from 10 sample plants and pooled from each plot including the dissected nodules for color determination, and their fresh weight was measured by a sensitive balance to constant weight and expressed as an average nodule fresh weight of 10 plants samples was taken as nodule fresh weight per plant. It is reported as gram per plant.
Nodule dry weight: The nodules were collected from 10 sample plants and pooled from each plot including the dissected nodules for color determination, and their dry weight was measured by oven drying at 70°C for 24 h to constant weight. It is reported as gram per plant.
Yield and yield components parameters
Crop stand count at harvest: The total number of plants was counted only from net harvestable plot areas (three central rows) at harvesting.
The number of pods per plant: Counting of pods per plant was done on 10 randomly selected plants in each net plot area and expressed as the average number of pods per plant.
Pod length: Pod length was measured from all 10 sampled plants per plot by a centimeter ruler from the point where the pod attaches to the stem to the tip of the pod.
The number of seeds per pod: This was determined by the total number of seeds counted in 10 randomly taken pods from the net plot, was counted and divided by the total number of pods, and expressed as an average as the number of seeds pod−1.
Hundred seeds weight (g): Hundred seeds were weighed (g) from each plot using a sensitive balance, and adjusted at 10% standard moisture content and expressed as gram per plot (g). The moisture content of the seed was adjusted to 10% according to the formula described by Abebe (Citation1979) as follows. Then the weight was converted to kg ha−1.
where MC is the moisture content of common bean seed and 10 is the standard moisture content of common bean seeds at harvest in percent.
Biomass yield (t ha−1): At the late pod setting stage, 10 plants were tagged from net harvestable rows and then the old leaves were collected per day and stored in a polythene bag until the crop reaches physiological maturity to estimate above-ground dry biomass yield. At physiological full maturity (R8), the above-ground dry biomass of 10 plants from harvestable row was measured after sun drying in the field for seven days and converted into per hectare.
Seed yield (kg ha−1): This was measured by harvesting the seed yield from the net plot area. Before threshing manually, the harvested produce was sun-dried for seven days. The moisture content of the seed was adjusted to 10% according to the formula indicated by Abebe (Citation1979). Then the weight was converted to kg ha−1.
Harvest index: This was calculated by dividing grain yield per net plot area by total above-ground dry biomass yield per net plot area and multiplied by 100.
2.6. Partial budget analysis: The economic profit of the treatment(s) was estimated by partial budget analysis according to CIMMYT (Citation1988).
2.7. Data analysis: Analysis of variance was done on collected data according to Gomez and Gomez (Citation1984). Treatment means were compared at 5% and 1% probability levels. And, a graphical illustration of the main and interaction effects of both factors was given in the form of box and interaction plots using interaction.plot() function of R statistical software (R i386 3.2.3 version) (R Citation2015) for a better description of the interaction of the two factors and for comparing the distribution of data across data sets.
Results and discussion
Soil analysis of experimental site before sowing
The chemical reaction of the experimental soil showed slightly acidic (Bruce and Rayment Citation1982) while the total N, available P, OM, OC, and CEC of the soil before planting were 0.14%, 9.84 mg kg−1, 1.55%, 0.9%, and 8.90 cmol (+) kg−1, respectively (Table ). The soil had low total N content based on the Havlin et al. (Citation1999) classification of total N content (%), as very low (<0.1), low (0.1–0.15), medium (0.15–0.25), and high (>0.25). Moreover, the study site had low available P content (Table ). Holford and Cullis (Citation1985) stated P content with < 5 range as very low, 5–10 range as low, 10–17 range as moderate, 17–25 range as high, and > 25 mg kg−1 as very high (Table ). The organic carbon and organic matter contents of the soil before planting were 0.9% and 1.55% respectively, indicating as low (Table ). Both organic carbon and organic matter contents ranging < 0.40% and <0.7% were categorized as extremely low, 0.4–0.6% and 0.7–1% as very low, 0.6–1% and 1–1.7% as low, 1–1.8% and 1.7–3% as moderate, 1.8–3% and 3–5.15% as high, and <3% and. 5.15 as very high, respectively (Charman and Roper Citation2007). The cation exchange capacity (CEC) of the soil was 8.90 cmol kg−1 which is in the low range (Table ) according to Metson (Citation1961) which described CEC result <6 as very low, 6–12 as low, 12–25 as moderate, 25–40 as high, and > 40 mol kg−1 as very high. Therefore, the soil analysis result revealed that the area is nutrient deficient especially in N and P to support the potential crop production in the study area which necessitates the application of nutrient sources.
Table 1. Soil properties of the experimental site before sowing.
Nodulation parameters
The analysis of variance result showed that the main effect of rhizobium inoculated common bean varieties and NPSB blended fertilizer rates had a significant effect on all nodulation parameters considered while the interaction effect of both factors was significant only for the total number of nodules per plant (Table ).
Table 2. Mean square of variance for different nodulation and yield associated traits as influenced by the main and interaction effects of inoculated common bean variety and NSPB fertilizer rate at Bako area. 2019.
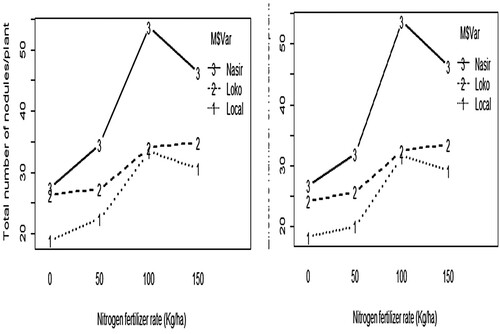
The total number of nodules per plant: The result showed that the total number of nodules per plant was 53.73 from the application of 100 kg ha−1 of NPSB from the Nasir variety while the minimum total (18.97) was recorded from control (local variety) (Figure ) indicating about 183% increment due to the application of fertilizer. While Nasir variety had the highest number of nodules per plant, while the local variety had the lowest nodulation (Figure ) which may associated with the difference in genetic and symbiotic efficiency. Wondimu and Tana (Citation2017) also reported variation in total nodule number among common bean varieties. Moreover, the effect of S and B on nodule growth, nodule formation, and functioning has been reported by Flores et al. (Citation2018). Another reports showed that nitrogen fixation has been more affected by P deficiency in common bean than in other legume crops (Fageria and Baligar Citation2016). Significantly low nodulation potential was recorded in this study as compared to Cardoso et al. (Citation2017) who indicated that larger values ranging from 133 to 174 nodules plant−1 were recorded for the isolates ALSG5A4, JPrG6A8, NVSG11A3, UnPaG11A9, and UnPaG8A12 on common bean and the same isolates had also highest nodule dry mass (0.27–0.384 g) which indicates there is high nodulation efficiency among Rhizobium spp that affects the amount of nitrogen fixed.
Figure 2. The effect of NPSB blended fertilizer on total number of nodules/plant (left) and effective number of nodules/plant (right) of inoculated common bean varieties at Bako, western Ethiopia.
Number of effective nodules per plant
Maximum effective (39.71) number of nodules per plant was obtained from the cultivar Nassir while minimum effective (24.82) number of nodules was from the cultivar Local variety and the maximum effective nodule was recorded with the application of 100 kg ha1which is statically par with 150 kg ha−1 while the lowest was recorded with from zero fertilizer application which is about 60% increment over the control (Figure ). The nutrients in blended NPSB fertilizer especially N had contributed largely to initiate nodulation and P contributed to increased root development resulting in nitrogen fixation in common bean. The result is in agreement with the report of Wondimu and Tana (Citation2017) which indicated the presence of significant differences in effective nodule number among common bean varieties. Arega and Zenebe (Citation2019) report showed that the highest number of total nodules (137.7), number of effective nodules (130.7), and plant height (129.4 cm) were recorded from the maximum rate of blended NPKSB rate which is higher than this study results. In this study, an increased number of the total and effective nodules was recorded at the application of 100 kg ha−1 NPSB but tend to decline at 150 kg ha−1 NPSB. Moreover, the interaction plot clearly showed that the Nasir variety was the highest performer in both the total number of nodules and effective nodules per plant (Figure ). In this study the Nassir variety showed better nodulation performance than other varieties but nodulation uniformly declined after 100 kg ha−1 NPSB fertilizer application for all the varieties. Research showed that inoculants as autochthonous strains often provide superior biological nitrogen fixation in common bean in the field due to their genetic adaptations and the result indicated that autochthonous strain, LCS0306 fixed significantly high amount of nitrogen than those with allochthonous strains R. phaseoli ATCC 14482 T especially efficient when formulated with a mixture of perlite and biochar (Pastor-Bueis et al. Citation2019).
Nodules fresh weight: The largest (11.84 g plant−1) nodules fresh weight per plant was recorded by plants inoculated with higher blended fertilizer, while the lowest (4.11 g plant−1) of nodules fresh weight per plant was obtained from control treatment showing a weight gain of about 188%, while the Loko variety recorded the highest nodule fresh weight (10.83 g plant−1), whereas the lowest was from the Nasir variety (7.1 g plant−1) which is par statically similar with 7.24 g plant−1 (Figure ). In contrast, lower values than this result have been reported by Masresha and Kibebew (Citation2017) who recorded the highest number of nodule fresh weight per plant (1.98 g plant−1) by the application of B. japonicum strain of TAL-379 compared to the lowest (0.99 g plant−1) nodules fresh weight per plant from the un-inoculated plant. Report showed that for their symbiotic nitrogen fixation, legumes have a high internal phosphorous requirement. It is, therefore, the addition of more amount of phosphorous enhances the nodule number. Additional supply of phosphorus promotes the initiation of more nodules, increasing the number of nodule primordial which is essential for the development and functioning of nodules. Similarly, Bashir et al. (Citation2011) stated phosphorus plays a vital role in expanding plant tip and root growth in legumes.
Figure 3. The effect of NPSB blended fertilizer on nodules fresh weight/plant (left) and nodules dry weight/plant (g) (right) of inoculated common bean varieties.
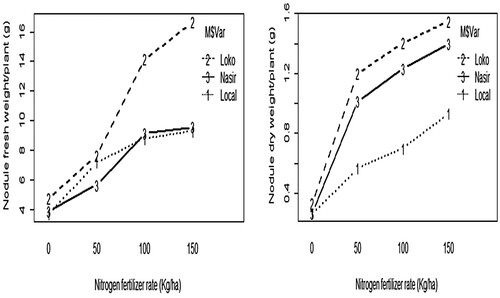
Nodules dry weight: The largest (1.29 g plant−1) nodules dry weight per plant was recorded by plants inoculated with higher blended fertilizer on the Loko variety followed by Nasir, while the lowest 0.29 g plant−1 of nodules dry weight per plant was obtained for the control treatment. The Loko variety recorded the highest nodule dry weight (1.22) which is par statistically with 0.98 and the lowest was recorded on local variety, 0.62 (Figure ) showing the importance of phosphorus in promoting the development of extensive root systems which increase potential nodule development. This result was significantly higher than other findings, for instance, in Tunisia which was stated that after phosphorus fertilizer supply and rhizobia inoculation, 16.9 nodules per plant and nodule dry weight (0.27 g plant−1) was reported under field conditions (Kouki et al. Citation2016). In another report, Cardoso et al. (Citation2017) indicated the highest nodule dry mass per plant (0.27–0.384 g) for the isolates ALSG5A4, JPrG6A8, NVSG11A3, UnPaG11A9, and UnPaG8A12 on common bean. A finding by Melkamu (Citation2019) showed the application of sulfur fertilizer contributes to an increased fresh and dry nodule weight plant−1. The highest number of total nodules (137.7), number of effective nodules (130.7), and plant height (129.4 cm) were recorded from the maximum rate of the blended NPKSB rate (Arega and Zenebe Citation2019). From the interaction plot (Figure ), it can be visualized that as the fertilizer rate increases, both nodule’s fresh weight and dry weight increase for all the common bean varieties. Therefore, the general Loko variety had better root growth characteristics indicating the presence of variability among the common bean varieties which is useful in plant nutrition, nutrient cycling, and/or adaptation. Similarly, variability in total nodule number and effective nodulation among common bean varieties have been reported by Girma et al. (Citation2014) and Wondimu and Tana (Citation2017). Though nodulation and root systems are genetically controlled but according to Bashir et al. (Citation2011) phosphorus is useful in promoting the development of extensive root systems which increase potential nodule development,
Yield and yield components
The statistical analysis showed the main effects and interaction effects of both rhizobia inoculated common bean variety and blended NPSB fertilizer rate had a significant influence on the number of pods per plant, biomass yield, seed yield, and harvest index (Table ).
Table 3. Mean square of ANOVA for yield and yield component parameters as influenced by rhizobium inoculated common bean variety and NPSB blended fertilizer rate at Bako, 2020.
Number of pods per plant
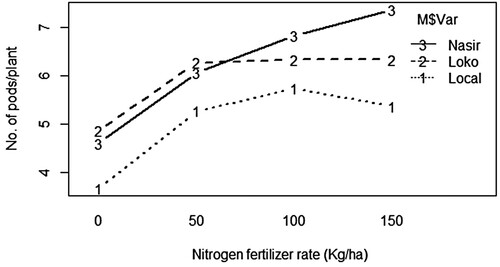
The highest number of pods per plant (7.4) was recorded from the application of higher NPSB, 150 kg ha−1on Nasir variety, while the lowest number of pods per plant was recorded for local (3.7) in zero application (Figure ) which was a 100% increment as compared to the control treatment. This might be due to genetic a difference that causes variation in responses to fertilizer. Similarly, Zewde (Citation2016) obtained the highest mean number of pods per plant for the variety ‘Hawassa Dume than varieties red Wolaita and Omo-95’. Gebre-egziabher et al. (Citation2014) reported that P application at the rate of 46 kg P2O5 ha−1 gave a higher pods number/plant and seed yield when compared to control plot in common bean. Lake and Jemaludin (Citation2018) reported the number of pods per plant had the highest with 100 kg ha−1 NPSZnB applications in common bean which was higher than this study may be mainly attributed to varietal and environmental differences.
Figure 4. The effect of NPSB blended fertilizer on the number of pods per plant of inoculated common bean varieties.
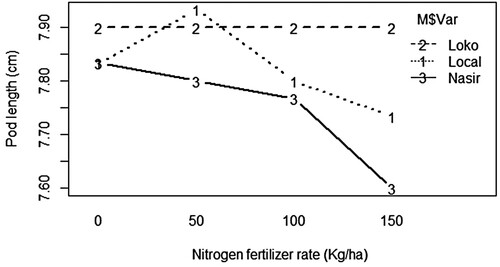
Pod length: The highest pod length (7.9 cm) was recorded from the Nasir variety from 50 kg ha−1 of fertilizer rate, while Loko did not interact at an increasing fertilizer rate. While the Local and Nasir varieties had almost closer values with a declining pattern. Besides this, the change in blended fertilizer levels also resulted from negligible differences (7.7–7.9) (Figure ).
Figure 5. The interaction plot of inoculated common bean varieties and NPSB blended fertilizer levels on pod length (cm) of common bean.
A number of seeds per pod
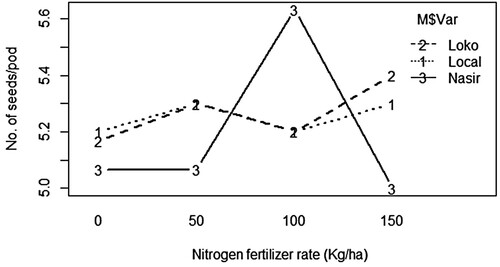
Larger number of seeds per pod (5.27) was obtained from the Nasir variety at 100 kg ha−1; NPSB fertilizer, while the lower number of seeds per pod (5.19) was obtained from Loko at the same fertilizer rate application (Figure ). Thus, it appears that the common bean varieties showed differential response to NPSB blended fertilizer levels may be caused by genetic differences so that there was an interaction effect as the response of varieties differed at a unit change in NPSB fertilizer levels. However, in another study, any rates of blended fertilizer and varieties plus common bean seeds inoculated with R. leguminous phaseolus treatment did not have any significant effect on the number of seeds per pod (Akpalu et al. Citation2014) and Tesfaye and Balcha (Citation2015) and Matusso and Cabo (Citation2015) also indicated that rhizobial inoculation and application of phosphorus had no significant effect on the number of seeds per pod of soybean.
Figure 6. The effect of NPSB blended fertilizer on number of seeds/pod of inoculated common bean varieties.
Hundred seeds weight
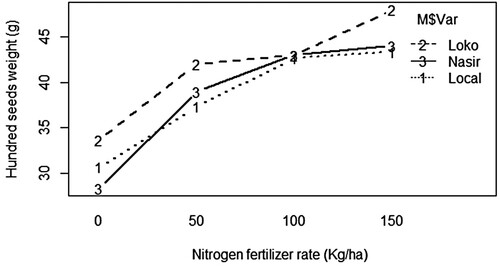
The highest 100-seed weight (45.11 g) was recorded at the high application of blended fertilizer 150 kg ha−1, while the lowest was (30.89 g) from the control treatment (Figure ) indicating a 46% increment. This may be resulted due to S supply and N uptake which might have improved the supply of assimilates to seed, which mainly increased the weight. And Loko variety giving higher 100-seed weight (41.67) tends to increase at an increasing fertilizer rate as compared to Nasir (38.58) indicating the existence of some genetic difference. In similar research, a lower hundred seed weight than this result was reported by Lake and Jemaludin (Citation2018) at 100 kg ha−1 NPSZnB applications in common bean. Amare et al. (Citation2014) indicated that the increasing doses of phosphorus from the control to 40 kg P2O5 ha−1 resulted in a significant increment in 100 seed weight.
Figure 7. The effect of NPSB blended fertilizer on hundred seeds/weight (g) of inoculated common bean varieties.
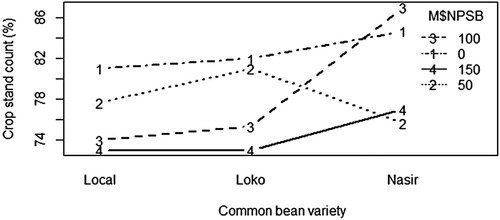
Crop stand count (%): The highest stand count per plot at harvest (87) was obtained from 100 kg ha−1 of blended NPSB rate application on the Nasir variety, whereas the lowest stand count at harvest (73) was recorded for varieties Local and Loko at the highest rate of blended fertilizer application (150 kg NPSB ha−1) (Figure ) which was a 19% improvement over control. It appears that at 100 kg ha−1 NPSB level improved plants survival, plants growth, and development through a better uptake of all nutrients, increased translocations photosynthetic materials, and reduced the mortality of plants due to less competition for nutrients which in turn resulted in increasing stand count but beyond 100 kg ha−1 NPSB rate, the crop stands decline. Besides this, the varietal difference was also observed for crop stand count indicating Nassir was an outstanding one.
Figure 8. The effect of NPSB blended fertilizer on crop stand count of inoculated common bean varieties.
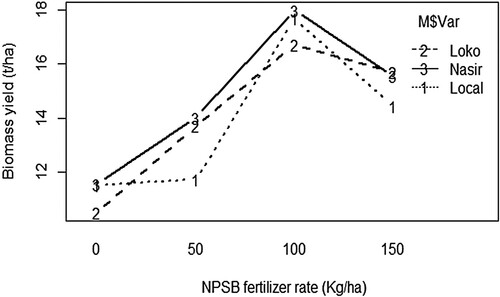
Biomass yield
The highest above ground biomass yield (17.5 t ha−1) was recorded from the application of 100 kg ha−1 NPSB with variety Nasir, while the lowest (11.2 t ha−1) biomass yield was obtained from control on Local variety (Figure ) showing 56% improvement over control. The biomass of the two improved cultivars responded increasingly at increasing fertilizer rates indicating they might also have better symbiotic relations, hence the enhanced availability of N increased plant height, the number of pods per plant, and to the overall vegetative growth of the plants resulting in increased biomass yield of varieties under various levels of blended NPSB that contributed to higher aboveground dry biomass yield. Similarly, Tarekegn and Serawit (Citation2017) reported that N applications increased shoot dry mass of common bean, dry matter production of French bean increased significantly with the application of different levels of nitrogen and phosphorus fertilizers, and micronutrient (Zn). And Kawie (Citation2015) reported that interaction of P and Rhizobium strain brought significant effect on French bean.
Figure 9. The interaction plot of inoculated common bean varieties and NPSB blended fertilizer on biomass yield (t/ha).
Seed yield
The highest seed yield was recorded in the application of 100 kg ha−1 NPSB from the Nasir variety (2996 kg ha−1) while the lowest yield (1414 kg ha−1) was observed on zero application of blended fertilizer with Local and Loko varieties (Figure ) showing 112% significant increment over control. Moreover, all varieties responded to fertilizer application beyond 100 kg by yield reduction which may be associated with a higher rate of nitrogen that might discourage nitrogen fixations and enhance vegetative growth thereby reducing the seed yield. It might be due to increased levels of S, its availability along with major nutrients and higher uptake of crop and influencing growth and yield components of the crop, which ultimately lead to effective, assimilate partitioning of photosynthates from the source to sink in the post-flowering stage and resulted in highest seed yield, enhances chlorophyll concentration, root nodules, and dry matter production which contributed to yield increment.
Figure 10. The effect of NPSB blended fertilizer on seed yield (kg/ha) of inoculated common bean varieties.
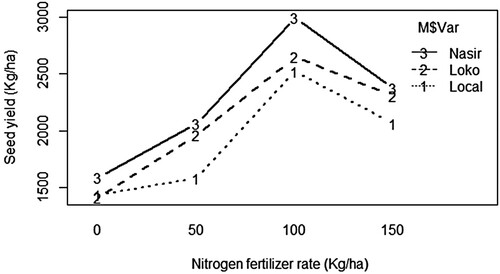
Similarly, Arega and Zenebe (Citation2019) indicated high above-ground dry biomass (17,195 kg ha−1), number of pods per plant (31.3), and seed yield (2923.8 kg ha−1) were recorded from the maximum rate of blended NPKSB rate (61.5:69:60:10.5:0.15 kg NPKSB ha−1) applied. While in this study, the yield obtained was improved by 112% over control by the application of fertilizer and rhizobium. However, comparable seed yield was reported by Lake and Jemaludin (Citation2018) at 100 kg/ha NPSZnB applications in common bean.
Yield is a quantitative trait that is influenced by genetic and environmental factors among which nutrients have basic functions in biological processes, growth, and development. Therefore, yield is a cumulative effect of different nutrient constituents and variety of which each has its influence in an increasing or decreasing magnitude. For instance, phosphorus plays a vital role in increasing legume yield through its effect on the plant itself and also on the fixation process by Rhizobium. Legume seed inoculation with proper Rhizobium strain together with minor amounts of phosphorus at the early growth stage could stimulate root nodulation and increase biological nitrogen fixation. N at early growth stages promotes vegetative growth and the formation of chlorophyll in turn contributes to high yield. Seed yield may vary among the common bean varieties due to their difference in genotypic variations in nutrient absorption and use efficiency. This result coincides with Jawahar et al. (Citation2013) who reported the application of S with or without P recorded significantly higher seed yield up to 40 kg ha−1 on the black gram. Gobeze and Legese (Citation2015) and Mourice and Tryphone (Citation2012) reported significant variations in seed yield among common bean varieties due to genotypic variations for P use efficiency which might arise from variation in P acquisition and translocation and use of absorbed P in seed formation in common bean.
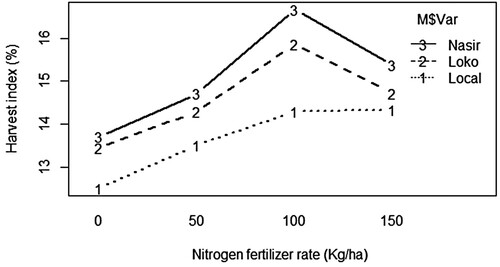
Harvest index (%): The highest harvest index (16.67%) was recorded with the application of 100 kg ha−1 of NPSB blended fertilizer rates on the Nasir variety, while the lowest harvest index (12.50%) was recorded from zero NPSB with local treatment (Figure ) had 33.3% improvement. This might be that the higher NPSB fertilizers rate had high influence on vegetative growth than nutrient translocation from plant biomass to seed and may be partly associated with the genetic makeup of the varieties. In line with this result, Daniel et al. (Citation2012) reported that the varieties Beshbesh (50%) and Nasir (48%) recorded the highest harvest indices which were very high as compared to this result. The harvest index reflects the division of photosynthesis between the seeds and the vegetative plant part, and the importance of carbon allocation during seed production. Lake and Jemaludin (Citation2018) indicated that the harvest index had the highest value with 100 kg ha−1 NPSZnB applications which was higher than this study.
Figure 11. The effect of NPSB blended fertilizer on harvest index (%) of inoculated common bean varieties.
Partial budget analysis
The results in this study indicated that the inoculated common bean varieties with blended fertilizer resulted in higher net benefits than using without blended fertilizer for all treatments. The partial budget analysis showed that the combined application of 100 kg ha−1 blended fertilizer and inoculated Nasir variety produced the highest net benefits with 79,245.78 Ethiopian Birr ha−1 (ETB) with a relatively high marginal rate of return of (4275.807%) (Table ). Thus, when the farmer or any common bean grower invests one birr for common bean production, they could get 42.76 ETB as a marginal rate of return. On the other hand, the control treatment produced the lowest net benefit of 40763.52 ETB. This implies that farmers would be better off inoculating and using blended fertilizer for their common bean and thus increase farmers’ income. Thus, the application of 100 kg ha−1 blended fertilizer inoculated with common bean varieties is profitable and can be recommended to the local farmers in the study areas. The result conforms to the study by Birhanu et al. (Citation2018) on common bean and Afewerk and Adam (Citation2018) on soybeans. The application of 100 kg NPSZnB gave the highest net benefit (45,214 ETB/ha) with the highest marginal rate of return (12.78%) (Lake and Jemaludin Citation2018).
Table 4. Partial budget analysis of the effects NPSB rates on common bean varieties at Bako.
The nodulation capacity of the rhizobium used for inoculation in this experiment was lower than other genotypes reported for different parameters. This requires further investigation on screening and/or introduction of better nitrogen-fixing bacteria and as well as symbiotic compatibility of the common bean varieties for better utilization infertility management.
Conclusion
The soil analysis result showed the soil is slightly acidic, nutrient-deficient especially N, P, and S and low in organic matter and organic content to support the potential crop production. Moreover, the CEC, exchangeable Ca, and exchangeable Mg was low. The results indicated that the main effect and interaction effects of rhizobium inoculated common bean variety and NPSB blended fertilizer had a significant effect on a total number of nodules per plant, the number of pods per plant, above-ground biomass, seed yield, and harvest index. Significantly highest number of total nodules (53.7), effective nodules per plant (35.54), number of pods per plant (7.4), plant stand count (87%), above-ground biomass (17.5 t ha1), seed yield (2996 kg ha1), and harvest index (16.67%) were recorded at the highest rate of 100 kg NPSB kg ha−1 which was 183%, 60%, 100%, 19%, 56%, 112%, and 33.3% increment over the control, respectively. Nodules’ fresh weight and nodules dry weight per plant showed 188% and 344.8% improvement over control at 150 kg ha−1NPSB blended fertilizer, respectively. Variety exhibited a significant effect on a number of total pods per plant and the number of seeds per plant. The Nassir variety performed better in nodulation and yield performance, while the Loko variety had a better rooting system indicating varietal differences which may affect the symbiotic efficiency, nutrient cycling, and plant nutrition. The finding suggests that the highest net benefit (79,245.78 ETB ha−1) was obtained from a combination of inoculated Nasir variety with the application of 100 kg ha−1 blended NPSB fertilizer.
Authors’ contribution
T.T. conceptualized the idea, conducted the experiment, and reviewed the literature, Z.J. was involved in data analysis, reviewed literature, and critically revised the paper for submission and publication and K.L participated in designing the experiment besides drafting the paper.
Acknowledgements
The authors would like to thank Bako Agricultural Research Center (BARC) for their provision of experimental materials and experimental land to undertake our research work.
Disclosure statement
The authors declare that there is no competing interest.
Data availability statement
All the data used in preparing this research paper is freely available and accessible as part of the article in a data repository known as FAIRsharing.org in https://figshare.com/ data repository with DOI:10.6084/m9.figshare.17033258.
Additional information
Funding
References
- Abebe B. 1979. Agricultural field experiment management manual part III. Addis Ababa, Ethiopia: Institute of Agricultural Research.
- Abou Seeda M A, Abou El-Nour EAA, Yassen AA, Hammad S A. 2021. Boron, Structure, Functions and Its Interaction with Nutrients in Plant Physiology. A Review . Middle East J. Agric. Res. 10(01):117–179.
- Afewerk H, Adam B. 2018. Cost and returns of soybean production in Assosa Zone of Benishangul Gumuz Region of Ethiopia. JDAE. 10(11):377–383. doi:10.5897/jdae2018.0952.
- Ahmed M, Siraj M, Mohammed S. 2017. Marketing practices and challenges of Mung bean in Ethiopia Amhara Regional State: North Shewa Zone in focus. Afr J Market Manag. 9(4):35–45.
- Akpalu MM, Siewobr H, Oppong-Sekyere D, Akpalu SE. 2014. Phosphorus application and rhizobia inoculation on growth and yield of soybean (Glycine max L. Merrill). Am J Exp Agric. 4(6):674–685.
- Amare G, Assaye D, Tuma A. 2014. The response of haricot bean varieties to different rates of phosphorus at Arba-Minch, Southern Ethiopia. ARPN J Agric Biol Sci. 9(10):344–350.
- Arega A, Zenebe M. 2019. Common bean (Phaseolus Vulgaris L.) varieties response to rates of blended NPKSB fertilizer at Arba Minch, Southern Ethiopia. Adv Crop Sci Technol. 7(3):429.
- ATA (Agricultural Transformation Agency). 2015. Soil fertility mapping and fertilizer recommendation in Ethiopia. Update of ESIS project and status of fertilizer blending plants.
- Bashir K, Ali S, Umair A. 2011. Effect of different phosphorus levels on xylem sap components and their correlation with growth variables of mash bean. SJA. 27(4):595–601.
- Birhanu A, Tadesse T, Tadesse D. 2018. Effect of inter- and intra-row spacing on yield and yield components of Mung bean (Vigna radiata L.) under rain-fed condition at Metema District, northwestern Ethiopia. Agric Food Secur. 7(84):1–7.
- Bitocchi L, Nanni E, Bellucci A. 2013. Mesoamerican origin of the common bean (Phaseolus vulgaris L.) Is revealed by sequence data. Proc Natl Acad Sci USA. 109(14):788–796. doi:10.1073/pnas.1108973109.
- Bruce RC, Rayment GE. 1982. Analytical methods and interpretations used by the agricultural chemistry branch for soil and land use surveys. soil chemistry – laboratory manuals. Brisbane: Queensland Dept. of Primary Industries.
- Cardoso AA, de Paula Andraus M, de Oliveira Borba TC, Garcia Martin-Didonet CC, de Brito Ferreira EP. 2017. Characterization of rhizobia isolates obtained from nodules of wild genotypes of common bean. Braz J Microbiol. 4(8):43–50. doi:10.1016/j.bjm.2016.09.002.
- Charman PEV, Roper MM. 2007. Soil organic matter. In: Charman PEV, Murphy BW, editors. Soils – their properties and management. 3rd ed. Melbourne: Oxford University Press; p. 276–285.
- CIMMYT. 1988. From agronomic data to farmer recommendations: an economics training Manual. Completely revised edition. Mexico, D.F: CIMMYT; p. 1–79.
- CSA (Central Statistical Agency). 2019. Agricultural sample survey, 2018/19 (2011E.C). Volume I: Report on area and production of major crops (Private peasant holdings, Meher season), Statistical Bulletin 589, Addis Ababa.
- Daniel T, Teferi A, Tesfaye W, Assefa S. 2012. Evaluation of improved varieties of haricot bean in West Belessa, Northwest Ethiopia. Int J Sci Res. 3(12):2756–2759.
- Deeksha K, Sachan HK, Chaudhary NK. 2019. Effect of sulphur fertilization on performance and production potential of mung bean [Vigna radiata L. Wilczek]. Legume Res Int J. 1(0):1–6.
- Ethiopian Institute of Agricultural Research (EIAR). 2014. Rhizobia-based bio-fertilizer Guidelines for smallholder farmers, Addis Ababa, Ethiopia. 2014. p. 11–14.
- Fact sheet. 2016. The benefit of rhizobium inoculant, grain research, and development corporation level 4: east building 4: National Circuit Barton Act 2600.
- Fageria NK, Baligar VC. 2016. Growth, yield, and yield components of dry bean as influenced by phosphorus in tropical acid soil. J Plant Nutr. 3:562–568.
- FAO. 2008. Food and agricultural organization: fertilizer and plant nutrition. Rome, Italy: Bulletin. FAO.
- Flores RA, Silva TV, Damin V, Carvalho RDC, Pereira DRM. 2018. Common bean productivity following diverse boron applications on soil. Commun Soil Sci Plant Anal. 49:725–734.
- Gebre-egziabher M, Tsehaye H, Abay F. 2014. Agronomic performance of some haricot bean varieties (Phaseolus vulgaris L.) with and without phosphorus fertilizer under irrigated and rain fed conditions in the Tigray and Afar regional states, northern Ethiopia. MEJS. 6(2):95–109.
- Girma A, Demelash A, Ayele T. 2014. The response of haricot bean varieties to different rates of phosphorus at Arbaminch, southern Ethiopia. ARPN J Agri Biol Sci. 9:344–350.
- Gobeze L, Legese H. 2015. Evaluation of common bean varieties at phosphorus deficient and sufficient condition in southern Ethiopia. Ashese J Agr Sci. 1(4):20–27.
- Gomez KA, Gomez AA. 1984. Statistical procedures for agricultural research, 2nd ed. New York, USA: John Wiley and Sons. pp. 1–680.
- Graham PH. 2008. Ecology of the root-nodule bacteria of legumes. In: Nitrogen fixation: Origins, applications, and research progress book series (NITR, vol. 7). Springer; p. 23–58.
- Graham PH, Rosas JC, de Jensen C E, Peralta E, Tlusty B, Acosta Gallegos J, Arraes Pereira PA. 2003. Addressing edaphic constraints to bean production: the bean/cowpea CRSP project in perspective. Field Crops Res. 82:179–192.
- Havlin JL, Beaton JD, Nelson WL, Tisdale SL. 1999. Soil fertility and fertilizers: An introduction to nutrient management. Upper Saddle River, NJ: Pearson Prentice Hall. Pp. 499.
- Holford ICR, Cullis BR. 1985. Effects of phosphate buffer capacity on yield response curvature and fertilizer requirements of wheat in relation to soil phosphate tests. Aust J Soil Res. 23:417–427.
- Jawahar S, Vaiyapuri V, Sriramachandrasekharan V. 2013. Effect of sources and levels of sulphur on growth and yield of rice fallow blackgram (Vigna mungo). Corpus ID: 204777462.
- Karikari BEA, Addy S. 2015. Growth, nodulation and yield response of cowpea to phosphorus fertilizer application. GJAS. 14:234–240. doi:10.3923/ja.2015.234.240.
- Kawie C. 2015. Effect of Phosphorus application on solubilization by PSB and diazotrophy of Rhizobium in French bean [MSc thesis]. JNKVV. http://krishikosh.egranth.ac.in/handle/1/68328.
- Khan MS, Koizum N, Olds JL. 2020. Biofixation of atmospheric nitrogen in the context of world staple crop production: policy perspectives. Sci Total Environ. 701:134945. doi:10.1016/j.scitotenv.2019.134945.
- Kouki S, Abdi N, Hemissi I, Bouraoui M, Sifi B. 2016. Phosphorus fertilization effect on common bean (Phaseolus vulgaris L.)-rhizobia symbiosis. Journal of new sciences. Agric Biotechn. 25(1):1130–1137.
- Lafay B, Burdon JJ. 1998. Molecular diversity of rhizobia occurring on native shrubby legumes in southeastern Australia. Appl Environ Microbiol. 64:3989–3997.
- Lake M, Jemaludin S. 2018. The response of common bean (Phaseoluse Vulgaris L.) to various levels of blended fertilizer. Int J Res Agric. 5(7):15–20.
- Mabrouk Y, Hemissi I, Ben Salem I, Mejri S, Saidi M, Belhadj O. 2018. Potential of rhizobia in improving nitrogen fixation and yields of legumes In book symbiosis. In: Symbiosis, Intech open Science. 1–15. doi:10.5772/intechopen.73495.
- Masresha A, Kibebew K. 2017. Effects of Rhizobium, nitrogen and phosphorus fertilizers on growth, nodulation, yield and yield attributes of soybean at pawe northwestern Ethiopia. WSN. 67(2):201–218.
- Matny ON. 2015. Lentil (Lens Culinaris Medikus) current status and future prospect of production in Ethiopia. Adv Plant Agr Res. 2(2):45–53. doi:10.15406/apar.2015.02.00040.
- Matusso JMM, Cabo FGD. 2015. Response of soybean [Glycine max (L.) Merrill] to phosphorus fertilizer rates in ferralsols. Academic Res Jo Agri Sci Res. 10:281–288.
- Melkamu H. 2019. Effect of NPS fertilizers application and irrigation system on growth and yield of snap Bean (Phaseolus Vulgaris L): A review. Int J Res Agric. 6(6):11–17.
- Mesfin A. 2009. Environment and social assessment: fertilizer support project. Addis Ababa: Ministry of Agriculture.
- Metson AJ. 1961. Methods of chemical analysis for soil survey samples. Soil Bureau Bulletin No. 12, New Zealand Department of Scientific and Industrial Research. 12:168–175.
- Mourice SK, Tryphone GM. 2012. Evaluation of common bean (Phaseolus vulgaris L.) genotypes for adaptation to low phosphorus. Int Sch Res Netw Agron. 2012:1–9.
- Pastor-Bueis R, Sánchez-Cañizares C, James EK, González-Andrés F. 2019. Formulation of a highly effective inoculant for common bean based on an autochthonous elite strain of Rhizobium leguminosarum bv phaseoli, and genomic-based insights into its agronomic performance. Front. Microbiol 10 Article 2724.
- Porch T, Beaver JS, Debouck DG. 2013. Use of wild relatives and closely related species to adapt common bean to climate change. Agronomy. 3:433–461. doi:10.3390/agronomy3020433.
- Purcell LC, Serraj R, Sinclair TR, De A. 2014. Soybean N2fixation estimates, ureide concentration and yield responses to drought. Crop Sci. 44:484–492.
- Rice WA, Clayton GW, Lupwayi NZ, Olsen PE. 2001. Evaluation of coated seeds as a rhizobium delivery system for field pea. Lacombe, Alberta. Can J Plant Sci. 81(1):248–249.
- R Software. 2015. R statistical Software Version 3.2.3 version (2015): The R Foundation for Statistical Computing Platform: I386-w64- mingw32/i386 (32-bit).
- Sá AA, Ernani PR. 2016. Boron leaching decreases with increases on soil pH. Rev Bras Ciênc Solo. 40:e0150008-1–7. doi:10.1590/18069657rbcs20150008.
- Tarekegn Y, Serawit S. 2017. Growth, symbiotic and yield response of N-fertilized and rhizobium inoculated common bean (Phaseolus vulgaris L.). Afr J Plant Sci. 11(6):197–202. doi:10.1007/s13199-017-0529-9.
- Tauqeer HM, Turan V, Farhad M, Iqbal M. 2022. Sustainable agriculture and plant production by virtue of Biochar in the era of climate change. In: Hasanuzzaman M, Ahammed GJ., Nahar K, editors. Managing plant production under changing environment. Singapore: Springer; p. 21–42. doi:10.1007/978-981-16-5059-8_2.
- Tesfaye T, Balcha A. 2015. Effect of phosphorus application and varieties on grain yield and yield components of common bean (Phaseolus vulgaris L.). Am J Plant Nutr Fertilization Technol. 5:79–84.
- Thilakarathna MS, Raizada MN. 2018. Challenges in using precision agriculture to optimize symbiotic nitrogen fixation in legumes: progress, limitations, and future improvements needed in diagnostic testing. Agronomy. 8:78. doi:10.3390/agronomy8050078.
- Turan V, Schröde P, Bilen S, Insam H, Fernández-Delgado Juárez M. 2019. Co-inoculation effect of rhizobium and Achillea millefolium L. oil extracts on growth of common bean (Phaseolus vulgaris L.) and soil microbial-chemical properties. Sci Rep. 9:15178. doi:10.1038/s41598-019-51587-x.
- Wondimu W, Tana T. 2017. Yield response of common bean (Phaseolus vulgaris L.) varieties to combined application of nitrogen and phosphorus fertilizers at Mechara, Eastern Ethiopia. J Plant Biol Soil Health. 4(2):7.
- Yin Z, Guo W, Xiao H, Liang J, Hao X, Dong N. 2018. Nitrogen, phosphorus, and potassium fertilization to achieve expected yield and improve yield components of Mung bean. PLoS ONE. 13(10):1–17.
- Zewde P. 2016. Effect of phosphorous rates on yield and yield related traits of common bean varieties on Nitisols at Wolaita Sodo, southern Ethiopia [A Thesis]. Haramaya University, Ethiopia.
- Zhang R., Wang C., Teng W., Wang J., Lyu X., Dong S., Kang S., Gong Z., Ma C. 2020. Accumulation and distribution of fertilizer nitrogen and nodule-fixed nitrogen in soybeans with dual root systems. Agronomy. 10(3):397. http://doi.org/10.3390/agronomy10030397.