
 ?Mathematical formulae have been encoded as MathML and are displayed in this HTML version using MathJax in order to improve their display. Uncheck the box to turn MathJax off. This feature requires Javascript. Click on a formula to zoom.
Abstract
Introduction: Prostaglandin E-major urinary metabolite (PGE-MUM) may be a good biomarker of inflammation and useful in monitoring diseases, without the necessity of invasive sampling. To see whether inflammation in muscles occurs during physical exercise, the influence of physical exercise on urinary PGE-MUM levels was analyzed in high school boys belonging to a soccer club.
Materials and methods: Void urine samples were obtained before and after physical exercises 1 (mild exercise) and 2 (repeated mild exercise). To avoid the influence of a change in urinary volume, PGE-MUM values (ng/mL) were corrected by the concentration of urinary creatinine (mg/dL) and expressed as PGE-MUM·Cr (µg/g creatinine). Urinary total protein·Cr (µg/g creatinine) and L-type fatty acid-binding protein·Cr (µg/g creatinine) (L-FABP·Cr) were compared with PGE-MUM·Cr.
Results: The PGE-MUM·Cr level increased significantly immediately after playing soccer (regular ‘mild’ exercise) in exercise study 1 or running (repeated mild exercise) in exercise study 2, but declined the next morning. PGE-MUM (ng/mL) levels in both exercises strongly correlated (Spearman correlation coefficient, ρ = 0.728; 0.480, respectively) with urinary creatinine (mg/dL) thought to be derived from muscle exercise.
Conclusion: The early increase in the PGE-MUM·Cr level just after physical exercise may reflect muscle damage and inflammation caused by the exercise.
Introduction
Prostaglandin E2 (PGE2) is produced by activation of cyclooxygenase 2 (COX2) in active inflammation. However, it is difficult to measure PGE2 directly in an inflammatory lesion since it is rapidly metabolized (Ferreira and Vane Citation1967). Prostaglandin E-major urinary metabolite (PGE-MUM, 7α-hydroxy-5,11-diketotetranor-prosta-1,16-dioic acid) is finally excreted as a stable molecule along with urine after being metabolized by 15-hydroxyprostanglandin dehydrogenase (15-HPD), followed by conversion, β-oxidation, and ω-oxidation. Recently, methods have been developed to measure PGE-MUM, such as radioimmunoassay (RIA) (Inagawa et al. Citation1983) and a fully automated chemiluminescent enzyme immunoassay system (Katagiri et al. Citation2017), in addition to liquid chromatography/mass spectrometry (Morris et al. Citation2013). Prostaglandin E-major urinary metabolite is a possible inflammatory biomarker, as well as a reliable and useful biomarker for following the activity of inflammatory diseases such as ulcerative colitis (Fujiwara et al. Citation2000) (Arai et al. Citation2014) (Hagiwara et al. Citation2017) (Sakurai et al. Citation2022) and interstitial pneumonitis (Horikiri et al. Citation2017), without the necessity of invasive sampling of patients.
Our recent large-scale analysis of healthy people with general health checkups revealed that the basal level of PGE-MUM according to an RIA was significantly higher in males than females. But it did not differ between genders after menopause because the PGE-MUM level decreased in elderly men and increased in elderly women (Okayasu et al. Citation2014) (Okayasu et al. Citation2022). Furthermore, current smokers showed significantly increased levels of PGE-MUM, indicating that smoking induced a weak but definitive inflammation in the lung (Okayasu et al. Citation2014).
In the present study, in order to observe whether physical exercise influences the PGE-MUM level via muscle damage and inflammation, levels in high school boys were compared before and after soccer training (‘mild’ exercise) and running (repeated mild exercise) (Paulsen et al. Citation2012). In addition to the PGE-MUM level, urinary protein and L-FABP were measured for comparison with renal damage after exercise. Blood and serum biomarkers for muscle damage and inflammation were not tested since it was extremely difficult according to research ethics to obtain blood samples from high school boys for the present study.
As a result, a clear early increase in the urinary PGE-MUM·Cr was evident after physical exercise. The correlation between increases in PGE-MUM and urinary creatinine suggested that the increased PGE-MUM·Cr was caused by micro-injury and consequent inflammation of muscle due to physical exercise. Although the present study is limited because of the simple analysis made, these results suggest that PGE-MUM·Cr might be a convenient biomarker to estimate muscle inflammation following micro-injury due to physical exercise.
Materials and methods
Samples and data collection
Concerning the influence of physical exercise on PGE-MUM, two studies were conducted with healthy high school boys who belonged to the high school soccer club in July (summer in Japan) as follows: In the study, void urine was obtained according to the schedules shown in Tables and , respectively. In exercise study 1 (mild exercise) undertaken in 2018 (Table , n = 59, mean age ± standard deviation [SD] was 17.1 ± 0.8 years), exercise was undertaken at a soccer ground (flat ground). Void urine was obtained according to the following schedule: one day before exercise (11:30);
just before exercise (14:00);
just after exercise (boys undertook physical exercise similar to a soccer game for 2 h in the afternoon) (16:20);
3 h later after exercise (19:20); and
next morning (7:00).
Table 1. Schedule of exercise for high school boys belonging to a soccer club in physical exercise study 1.
In exercise study 2 (repeated mild exercise) performed in 2019 (Table , n = 65, mean age 16.9 ± 0.8 years), exercise was undertaken at a summer training camp (mountainous area, 1,350 m above sea level). Members of the first and second grades in exercise study 1 eventually graduated to the second and third grades, respectively, in exercise study 2. Running on flat ground for 10 km in the afternoon and performing exercise for 1 h to strengthen the body core after dinner were undertaken on the first day. Void urine was obtained as follows: Early morning (6:00) before breakfast on the second day; after getting void urine, running was undertaken on flat ground for 6 km.
Just after AM exercise (running on flat ground for 5 km, and up and down with short intervals [difference in height, 50 m, distance 200 m] × 30 times for 1.5 h) before lunch (11:00).
Just after PM exercise (running on flat ground for 5 km, and up and down for a short interval ([difference in height, 50 m, distance 200 m] × 15 times for 1.5 h) (16:00).
Early morning (6:00) before breakfast on the third day. After the donation of void urine, running was undertaken on flat ground for 5 km.
Just after exercise (running on a flat road for 17 km for 1.5–2 h; 10:30–11:00).
Table 2. Schedule of exercise for high school boys belonging to a soccer club in physical exercise study 2.
Anyone who took laxatives, anti-allergic drugs, steroid hormones, non-steroidal anti-inflammatory drugs, prostaglandin-related drugs, or steroid hormones were excluded from this study. Patients with a virus infection causing COVID-19 were not reported in Japan in 2018 and 2019 when the present studies were performed. Furthermore, high school boys with a fever (higher than 37.5°C) or other significant signs and symptoms were not allowed to participate in the training for the present study.
Laboratory analysis
PGE-MUM levels were examined in urine taken from high school boys belonging to a soccer club. After centrifugation at 1,000 × g for 10 min. the supernatants of all urine samples were stored at −60°C for the analysis of PGE-MUM.
All samples of urine (50 µL) were kept at room temperature for 30 min after the addition of 100 µL of 1N NaOH and neutralized with 100 µL of 1N HCl. PGE-MUM was then assayed using an RIA kit (Institute of Isotopes Co. Ltd., Budapest, Hungary) as previously described (Okayasu et al. Citation2014). PGE-MUM values (ng/mL) were corrected according to the concentration of urinary creatinine (mg/dL) and expressed as PGE-MUM·Cr (µg/g creatinine) since its concentration depends on the urinary volume.
For the physical exercise study, urinary L-type fatty acid-binding protein (L-FABP) and total protein levels in samples from high school boys were simultaneously measured and compared with the PGE-MUM level using chemiluminescent enzyme immunoassay kits and a pyrogallol red method (SRL Inc., Hachioji, Tokyo, Japan), respectively. Values of L-FABP (mg/dL) and urinary protein (mg/dL) were also corrected according to the concentration of urinary creatinine and expressed as L-FABP·Cr (µg/gCr) and total protein·Cr (g/gCr), respectively. Data are summarized as boxplot graphs.
Data from general health checkups in high school boys included body length, body weight, BMI, electrocardiogram, urinary protein, urinary sugar, urinary urobilinogen, blood hemoglobin, and hematocrits; these confirmed that no boys had any problems in undertaking physical exercise.
Research ethics
Urine and general health check data from the high school were used with the informed consent of study participants and their parents. This study was approved by our ethics committee (#2802, The study of the change of urinary inflammation marker, PGE-MUM by physical exercise, on December 2, 2016 and; #3008, The study of the change of urinary inflammation marker, PGE-MUM by physical exercise II, on February 15, 2019). The work described herein has been carried out in accordance with the Code of Ethics of the World Medical Associations (Declaration of Helsinki) for experiments involving humans.
Umeda K., an employee of Fujirebio Inc., measured PGE-MUM values while blind to participant data.
Participant consent
All of participants were minors. The ethics committee judged that obtaining void urine was a low invasive method. The study was explained verbally to participants with written documents and to their parents with only documents of the study. Finally, signed documents of consent were obtained from both participants and their parents.
Statistical analysis
Statview software (Abacus Concepts, Berkley, CA) and SPSS version 13.0J (SPSS Japan, Inc., Shibuya-ku, Tokyo, Japan) were used for statistical analyses. Comparisons between two groups were performed using a Mann–Whitney U-test. Because activity scores were not normally distributed, Spearman correlation coefficients were calculated for PGE-MUM, urinary L-FABP, and urinary total protein values to evaluate relationships. Pearson correlation coefficients calculated from log-transformed data did not differ substantially and are therefore not presented. A p-value of less than 0.05 was considered of statistical significance.
Results
In exercise study 1
The PGE-MUM·Cr level (PGE-MUM values corrected by the concentration of urinary creatinine) increased significantly (p = 0.0010) just after exercise, compared with one day before or just before exercise, and continued at an increased level 3 h after exercise; it decreased to pre-exercise levels on the morning of the next day (Figure A).
Figure 1. Changes in PGE-MUM·Cr (A), urinary L-FABP·Cr (B), urinary total protein·Cr (C), urinary creatinine (mg/dL) (D), and PGE-MUM (ng/mL) (E) levels in exercise study 1 (n = 59) (boxplot graph). Physical exercise was performed by high school boys in a soccer club. Void urine samples were obtained before and after soccer game–like exercise for 2 h, as shown in Table . L-FABP·Cr, L-type fatty acid-binding protein corrected by the concentration of urinary creatinine; PGE-MUM·Cr, prostaglandin E-major urinary metabolite corrected by the concentration of urinary creatinine. A. Changes in PGE-MUM·Cr in exercise study 1. The PGE-MUM·Cr level increased significantly just after exercise and then subsequently decreased. B. Changes in urinary L-FABP·Cr in exercise study 1. The urinary L-FABP·Cr level increased significantly just after exercise
and then subsequently decreased. C. Changes in urinary total protein·Cr in exercise study 1. The urinary total protein·Cr level increased significantly just after exercise
and then subsequently decreased. D. Changes in urinary creatinine (mg/dL) in exercise study 1. The urinary creatinine level increased significantly just after exercise
and then subsequently decreased. E. Changes in PGE-MUM (ng/mL) in exercise study 1. The PGE-MUM level increased significantly just after exercise
and then subsequently decreased.
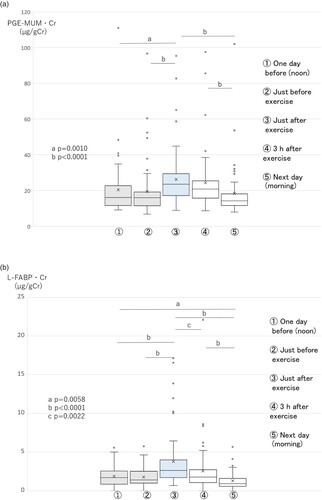
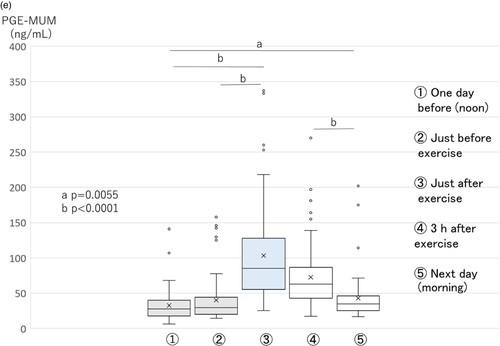
The L-FABP·Cr level increased significantly just after exercise, and significantly decreased 3 h after exercise. On the morning of the next day, the L-FABP·Cr level decreased almost to the pre-exercise level (Figure B). Urinary total protein·Cr also showed a similar trend as L-FABP·Cr. Urinary total protein·Cr increased significantly just after exercise, and significantly decreased 3 h after exercise. Finally, by the morning of the next day it had decreased almost to the pre-exercise level (Figure C).
The urinary creatinine (mg/dL) level increased just after exercise and declined slowly (Figure D). Its level did not decline completely to control values before exercise on the morning of the next day. The PGE-MUM (ng/mL) level also showed the same tendency as urinary creatinine (Figure E).
L-FABP (ng/mL) and total protein (mg/dL) levels (Supplementary Figure 1A, B) increased just after exercise and then, after the peak, declined relatively quickly.
A correlation analysis of total time points from five urine samples between PGE-MUM, L-FABP, and total protein samples revealed that the PGE-MUM·Cr level showed a relatively weak correlation with L-FBP·Cr and total protein·Cr levels (ρ = 0.151, p = 0.0100; ρ = 0.210, p = 0.0003, respectively). L-FABP·Cr showed a significant correlation with the total protein·Cr level (ρ = 0.455, p < 0.0001; Table ).
Table 3. Correlation analysis data (Spearman, ρ) in the physical exercise 1.
A correlation analysis of total time points from five urine samples between PGE-MUM, urinary creatinine, L-FABP, and total protein samples revealed that the PGM-MUM (ng/mL) level showed a relatively strong correlation with urinary creatinine (mg/dL), total protein (mg/dL), and L-FABP (ng/mL). In particular, the correlation coefficient was highest (ρ = 0.728, p < 0.0001) between PGE-MUM (ng/mL) and urinary creatinine (mg/dL; Table ).
In exercise study 2
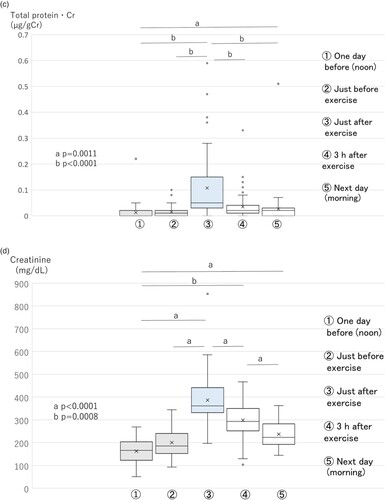
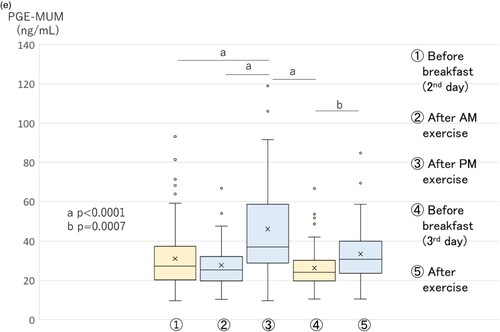
The PGE-MUM·Cr level increased significantly (p < 0.0001) just after AM exercise on the second day, compared with the early morning before breakfast on the second day, and continued to be at an increased level just after PM exercise. After that, it decreased in the early morning before breakfast on the third day, and again increased significantly just after AM exercise (Figure A).
Figure 2. Changes in PGE-MUM·Cr (A), urinary L-FABP·Cr (B), urinary total protein·Cr (C), urinary creatinine (mg/dL) (D), and PGE-MUM (ng/mL) (E) levels in exercise study 2 (n = 65) (boxplot graph). Physical exercise was performed by high school boys in a soccer club. Void urine samples were obtained before and after running in a mountainous area, 1,350 m above sea level, as shown in Table . L-FABP·Cr, L-type fatty acid-binding protein corrected by the concentration of urinary creatinine; PGE-MUM·Cr, prostaglandin E-major urinary metabolite corrected by the concentration of urinary creatinine. A. Changes in PGE-MUM·Cr in exercise study 2. The PGE-MUM·Cr level was significantly higher after AM and PM exercise
on the second day compared to the early morning
on the second day, and was significantly higher after exercise
compared to the early morning
, both on the third day. B. Changes in urinary L-FABP·Cr in exercise study 2. The urinary L-FABP·Cr level was significantly higher after AM
and PM exercise
on the second day than in the early morning
on the second day. C. Changes in urinary total protein·Cr in exercise study 2. The urinary total protein·Cr level was significantly higher after AM
and PM exercise
on the second day than the early morning
on the second day, and was significantly higher after exercise
compared to the early morning
, both on the third day. D. Changes in urinary creatinine (mg/dL) in exercise study 2. The urinary creatinine level was significantly higher at each time point except for after AM exercise
on the second day. E. Changes in PGE-MUM (ng/mL) in exercise study 2. The PGE-MUM (ng/mL) level was significantly higher after AM
and PM exercise
on the second day compared to the early morning
on the second day, and significantly higher after exercise
on the third day compared to the early morning
on the third day.
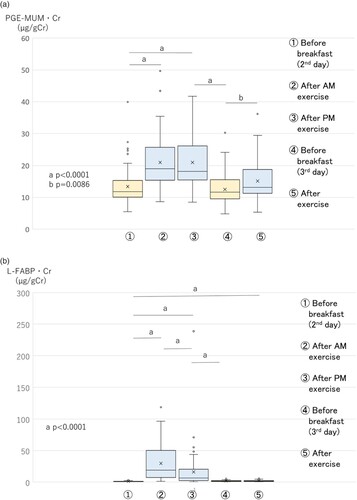
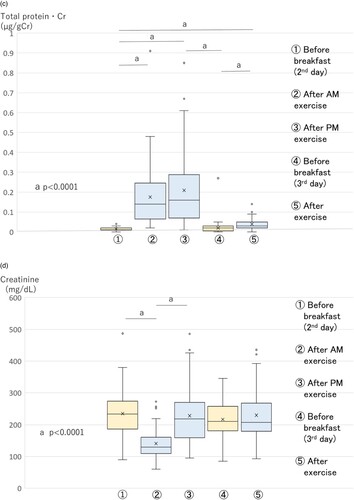
L-FABP·Cr increased significantly (p = 0.0001) just after AM exercise on the second day, compared with the early morning, and then significantly decreased (p < 0.0001) just after PM exercise compared with just after AM exercise. It decreased completely by the early morning of the third day. It did not increase just after AM exercise on the third day (Figure B). The urinary total protein·Cr level showed a significant increase (p < 0.0001) just after AM exercise on the second day, compared with early morning, and continued to show an increased level just after PM exercise. It decreased completely by the early morning of the third day, and increased significantly (p < 0.0001) just after AM exercise again (Figure C).
The urinary creatinine (mg/dL) showed relatively high values at each time point except for the time point (just after AM exercise on the second day) (Figure D).
The PGE-MUM (mg/mL) level was significantly higher at the time point (just after PM exercise on the second day), compared to other time points (Figure E).
The L-FABP (ng/mL) level was relatively high at the time point, being different from other markers. The total protein (mg/dL) level showed a relatively similar pattern to that of PGE-MUM (mg/mL) (Supplementary Figure 2A, B).
A correlation analysis of the total time points of five urine samples for PGE-MUM·Cr, L-FABP·Cr, and total protein·Cr revealed that the PGE-MUM·Cr level had a relatively weak correlation with FBP·Cr and total protein Cr levels (ρ = 0.490, p < 0.0001; ρ = 0.484, p < 0.0001, respectively). The L-FABP·Cr level showed a strong correlation with that of total protein·Cr (ρ = 0.725, p < 0.0001; Table ).
Table 4. Correlation analysis data (Spearman, ρ) in the physical exercise 2.
A correlation analysis of the total time points of five urine samples between PGE-MUM, urinary creatinine, L-FABP, and total protein samples revealed that the PGM-MUM (ng/mL) level showed a significant correlation with urinary creatinine (mg/dL), total protein (mg/dL), and L-FABP (ng/mL) levels. In particular, the correlation coefficient was again the highest (ρ = 0.480, p < 0.0001) between PGE-MUM (ng/mL) and urinary creatinine (mg/dL) levels (Table ).
Thus, an early increase in the PGE-MUM·Cr level after physical exercise was shown with two different types of exercise. Furthermore, it was revealed that the PGE-MUM (mg/mL) level showed the highest correlation coefficient with the urinary creatinine (mg/dL) level.
Discussion
Concerning the influence of physical exercise on PGE-MUM·Cr, the high school boys studied were a young homogenous group that belonged to a soccer club. They were chosen for this study because age and gender were known to influence PGE-MUM and inflammatory cytokines during physical exercise (Okayasu et al. Citation2014) (Conceição et al. Citation2012). Exercise study 1 was composed of a simple exercise in which we planned to observe how the PGE-MUM·Cr level increased after physical exercise. Exercise study 2 was composed of repeated mild exercise for 3 days, and we wanted to observe whether a repeated training load could induce a large increase in PGE-MUM·Cr or not due to adaptation by exercisers’ muscles to the training load. Exercise study 1 (regular ‘mild’ exercise) was mainly composed of soccer game–like exercise, including running quickly and kicking the soccer ball for 2 h. PGE-MUM·Cr levels increased just after exercise, and decreased for the following 3 h, but was still significantly higher than that before exercise. Finally, it decreased completely by the next morning. L-FABP·Cr and urinary total protein·Cr levels showed a relatively similar increase to that of PGE-MUM·Cr, but statistically were not strongly correlated with PGE-MUM·Cr. Furthermore, the urinary total protein·Cr level decreased more quickly than that of PGE-MUM·Cr 3 h after exercise.
First, in exercise study 2 (repeated mild exercise), exercise was mainly composed of running up and down or running on flat ground at a high altitude. Repeated mild exercises may mean ‘extreme’ overall exercise. PGE-MUM·Cr was significantly increased just after the exercise of running up and down on the second day. Second, after running for a long distance (17 km) on a flat road on the third day, the PGE-MUM level significantly increased, but its increased value was not large compared with the PGE-MUM·Cr level after running up and down. This difference might have been caused by differences in the severity of running, the muscles (type I or type II fibers) (Liu et al. Citation2016) used in each exercise or is an adaptation to similar exercise (Paulsen et al. Citation2010). Furthermore, the physical exercise of repeated up and down running in dashes in exercise study 2 might be relatively harder than the soccer game–like exercise in exercise study 1. However, increased values of PGE-MUM·Cr between studies 1 and 2 did not greatly differ. These points should be clarified with further precise studies of physical exercise that is well controlled both in terms of quantity and quality, particularly the change in PGE-MUM·Cr in the relationship between muscle micro-injury and muscle adaptation to the training load.
The L-FABP·Cr level showed a different trend from the increase in PGE-MUM·Cr level. Just after AM up and down running, the L-FABP·Cr level significantly increased when compared to that before exercise. However, the L-FABP·Cr level showed a tendency to decrease just after PM exercise of up and down running, and showed no increase just after running a long distance on a flat road on the third day, different from that of PGE-MUM·Cr. The urinary total protein·Cr level showed a relatively similar pattern of increase to that of PGE-MUM·Cr.
Regarding correlation, no strong correlations between the PGE-MUM·Cr level with L-FABP·Cr or urinary total protein·Cr levels were found. In contrast, L-FABP·Cr and urinary total protein·Cr levels showed a relatively strong correlation. As L-FABP·Cr usually reflects renal tubule function, an increase in this exercise study meant transient damage of renal tubules (Schrezenmeier et al. Citation2017) (Poortman et al. Citation1997). Urinary proteinuria is considered to be caused by both increased glomerular permeability and the inhibition of partial tubular reabsorption of proteins (Poortmans et al. Citation1988). Thus, both markers show a strong correlation through transient renal damage by physical exercise. In fact, both markers do not have any overlapping metabolic pathway with PGE-MUM. In addition, PGE-MUM (ng/mL) values showed the highest correlation coefficient (exercise studies 1 and 2, ρ = 0.728, 0.480, p < 0.0001, respectively) with the urinary creatinine (mg/dL) level, which is derived from muscle activity in both exercise studies 1 and 2. These results may suggest that the increase in PGE-MUM·Cr level just after physical exercise means inflammation of muscles occurred due to physical exercise, although it might be partly influenced by renal function. There were relatively large differences in Spearman’s ρ values between physical exercises 1 and 2. Such differences might be caused by a quality difference in physical exercise. This remains to be clarified by further studies.
Recently, it has been shown that physical exercise induces muscle damage and inflammation. Exercise is graded mild, moderate, and severe (extreme or eccentric) according to the recovery of a force-generating capacity in study participants after exercise (Paulsen et al. Citation2012). Even mild as well as extreme exercise induces muscle damage and inflammation as shown by increased cytokines, including intramuscular mRNA of interleukin (IL)−6, IL-8, IL-1β, and tumor necrosis factor-α immediately post-exercise, and serum IL-6, IL-10, IL-1 receptor antagonist, granulocyte colony stimulating factor, and monocyte chemotactic protein-1 a little later (Paulsen et al. Citation2012) (Paulsen et al. Citation2010). With respect to COX2 mediating PGE-2, mild (resistant) exercise induced the up-regulation of mRNA for COX2 in human muscle biopsied 3 h following exercise (Buford et al. Citation2009a) (Buford et al. Citation2009b). The circulating neutrophil count and migratory activity also increased 4 h after extreme exercise (Kanda et al. Citation2013). Cyclooxygenase-2 expression is defined in activated macrophages and muscle satellite cells. Furthermore, an early increase in the PGE-MUM level just after exercise in the present study reflects an early increase in plasma PGE2 in an experimental study of proinflammatory cytokines in horses (MacNicol et al. Citation2018) (Peake et al. Citation2017). These explanations should be elucidated further in future studies of the relationship between PGE-MUM and physical exercise. Thus, it may be suggested that the early increase in PGE-MUM level after physical exercise indicates muscle damage and inflammation, and highlights severe muscle involvement caused by physical exercise, although direct evidence of the increase in inflammation markers was not available due to limited samples in the present study.
Individual differences in PGE-MUM were relatively large in the present study. This might be related to dysregulation of the PGE2 pathway by genetic and metabolic variability in COX2, 15-hydroxyprostaglandin dehydrogenase, which degrades PGE2, and the prostaglandin transporter encoding gene, solute carrier organic anion transporter family member 2A1, a protein that transports prostaglandin into the cytoplasm (Uppal et al. Citation2008; Yuan et al. Citation2015) (Madruga Dias et al. Citation2014; Pereira et al. Citation2016). While considering individual differences, PGE-MUM values are thought to be sufficiently reliable to observe the state of inflammation in the body, although the elevated values of PGE-MUM after physical exercise seem not to be large. Since the PGE-MUM level is measured by a sensitive noninvasive method, in comparison to other tests used for blood chemistry, it can easily be undertaken before and after exercise, suggesting this might be a convenient biomarker to estimate muscle damage and inflammation.
Conclusion
PGE-MUM is a convenient tool for the assessment of organ or tissue inflammation. In the present study, a significant early increase in the urinary PGE-MUM·Cr level was shown after physical exercise. According to the high correlation between PGE-MUM (g/mL) and urinary creatinine (mg/dL), the increase in PGE-MUM·Cr may suggest muscle inflammation due to physical exercise. Furthermore, PGE-MUM·Cr might be a specific and convenient biomarker to assess muscle inflammation. Further studies are required to confirm this suggestion.
Supplemental Material
Download MS Word (180.4 KB)Acknowledgments
The authors are grateful to all students for allowing them to perform this study. The authors would like to thank Chieko Takano, a nurse teacher and head of the wellness center of Kiryu Daiici High School, for collecting and summarizing data from soccer club members in general annual health checkups.
Author contributions
I.O. and H.O. firstly conceived the present work.
I.O. developed and precisely designed the project.
I.O., H.K., K.H., S.S., K.S., G.T., and K.U. collected and analyzed the data and samples, and offered suggestions for the study.
K.U. performed laboratory work to measure urinary markers in this study.
I.O, K.S., and N.I. analyzed data using related software.
R.S., a high school doctor obtained general health check data of participants, analyzed, and confirmed their healthy state for the present study.
R.S. and H.O. critiqued the study and made suggestions, particularly on the methods and interpretation of the results.
I.O. wrote the main text and prepared figures.
All members reviewed and approved the final manuscript.
Disclosure statement
K.U., an employee of Fujirebio Inc., the company that has the commercial rights to PGE-MUM tests, measured PGE-MUM values blinded to participant data. I.O. received a research grant for part of this study from Fujirebio Inc. The authors declared no potential conflicts of interest with respect to the research, authorship, and/or publications.
Data Availability Statement
All relevant data are within the manuscript. Supplementary figures are available. All raw data for the information is available. Search on 4TU Research Data https://doi.org/10.4121/21778979
Additional information
Funding
References
- Arai Y, Arihiro S, Matuura T, et al. 2014. Prostaglandin E-major urinary metabolite as a reliable surrogate marker for mucosal inflammation in ulcerative colitis. Inflamm Bowel Dis. 20:1208–1216.
- Buford TW, Cooke MB, Shelmadine BD, et al. 2009a. Effects of eccentric treadmill exercise on inflammatory gene expression in human skeletal muscle. Appl Physiol Nutr Metab. 34:745–753.
- Buford TW, Cooke MB, Willoughby DS. 2009b. Resistance exercise-induced changes of inflammatory gene expression within human skeletal muscle. Eur J Appl Physiol. 107:463–471.
- Conceição MS, Libardi CA, Nogueira FR, et al. 2012. Effects of eccentric exercise on systemic concentrations of pro- and anti-inflammatory cytokines and prostaglandin (E2): comparison between young and postmenopausal women. Eur J Appl Physiol. 112:3205–3213.
- Ferreira SH, Vane JR. 1967. Prostaglandins: their disappearance from and release into the circulation. Nature. 216:868–873.
- Fujiwara M, Okayasu I, Oritsu M, et al. 2000. Significant increase in prostaglandin E-main urinary metabolite by laxative administration: comparison with ulcerative colitis. Digestion. 61:201–206.
- Hagiwara SI, Okayasu I, Fujiwara M, et al. 2017. Prostaglandin E-major urinary metabolite as a biomarker for pediatric ulcerative colitis activity. J Pediat Gastroenterol Nutr. 64:955–961.
- Horikiri T, Hara H, Saito N, et al. 2017. Increased levels of prostaglandin E−major urinary metabolite (PGE-MUM) in chronic fibrosing interstitial pneumonia. Respir Med. 122:43–50.
- Inagawa T, Imaki K, Masuda H, et al. 1983. Simplified immunoassays of prostaglandin E main metabolite in human urine. Adv Prostaglandin, Thromboxane, Leukotriene Res. 11:191–196.
- Kanda K, Sugama K, Hayashida H, et al. 2013. Eccentric exercise-induced delayed-onset muscle soreness and changes in markers of muscle damage and inflammation. Exerc Immunol Rev. 19:72–85.
- Katagiri N, Wakabayasi M, Arihiro S, et al. 2017. Development of fully automated chemiluminescent enzyme immunoassay system for measurement of prostaglandin E major urinary metabolites (PGE-MUM). JJCLA (Nippon kensajidouka gakkai kaishi). 42:584–590. in Japanese with English abstract.
- Liu SZ, Jemiolo B, Lavin KM, et al. 2016. Prostaglandin E2/cyclooxygenase pathway in human skeletal muscle: influence of muscle fiber type and age. J Appl Physiol. 120:546–551.
- MacNicol JL, Lindinger MI, Pearson W. 2018. A time-course evaluation of inflammatory and oxidative markers following high-intensity exercise in horses: a pilot study. J Appl Physiol. 124:860–865.
- Madruga Dias JA, Rosa RS, Perpétuo, I. et al. 2014. Pachydermoperiostosis in an African patient caused by a Chinese/Japanese SLCO2A1 mutation—Case report and review of literature. Semin Arthritis Rheum. 43:566–569.
- Morris PG, Zhou XK, Milne GL, et al. 2013. Increased levels of urinary PGE-M, a biomarker of inflammation, occur in association with obesity, aging, and lung metastases in patients with breast cancer. Cancer Prevention Research. 6:428–436.
- Okayasu I, Kuroiwa H, Shinkawa K, et al. 2022. Higher prostaglandin E-major urinary metabolite levels in male versus female students and a small decrease during the menstrual cycle. Kitasato Med J. 52(2):81–89.
- Okayasu I, Ohnishi H, Sarandi I, et al. 2014. Significant increase of prostaglandin E-major urinary metabolite in male smokers: a screening study of age and gender differences using a simple radioimmunoassay. J Clin Lab Anal. 28:32–41.
- Paulsen G, Egner IM, Drange M, et al. 2010. A COX-2 inhibitor reduces muscle soreness, but does not influence recovery and adaptation after eccentric exercise. Scand J Med Sci Sports. 20:e195–e207.
- Paulsen G, Mikkelsen UR, Raastad T, et al. 2012. Leucocytes, cytokines and satellite cells: what role do they play in muscle damage and regeneration following eccentric exercise? Exerc Immunol Rev. 18:42–97.
- Peake JM, Neubauer O, Della Gatta PA, et al. 2017. Muscle damage and inflammation during recovery from exercise. J Appl Physiol. 122:559–570.
- Pereira C, Queirós S, Galaghar A, et al. 2016. Influence of genetic polymorphisms in prostaglandin E2 pathway (COX-2/HPGD/SLCO2A1/ABCC4) on the risk for colorectal adenoma development and recurrence after polypectomy. Clin Transl Gastroenterol. 7:e191.
- Poortman JR, Blommaert E, Baptista M, et al. 1997. Evidence of differential renal dysfunctions during exercise in men. Eur J Appl Physiol. 76:88–91.
- Poortmans JR, Brauman H, Staroukine M, et al. 1988. Indirect evidence of glomerular/tubular mixed-type postexercise proteinuria in healthy humans. Am J Physiol. 254:F277–F283.
- Sakurai T, Akita Y, Miyashita H, et al. 2022. Prostaglandin E-major urinary metabolite fiagnoses mucosal healing in patients with ulcerative colitis in remission phase. J Gastroenterol Hepatol. 2022, Jan 22. doi:10.1111/jgh.15782. On line ahead of print.
- Schrezenmeier EV, Barasch J, Budde K, et al. 2017. Biomarkers in acute kidney injury - pathophysiological basis and clinical performance. Acta physiologica. 219:554–572.
- Uppal S, Diggle CP, Carr IM, et al. 2008. Mutations in 15-hydroxyprostaglandin dehydrogenase cause primary hypertrophic osteoarthropathy. Nat Genet. 40:789–793.
- Yuan L, Chen L, Liao RX, et al. 2015. A common mutation and a novel mutation in the HPGD gene in nine patients with primary hypertrophic osteoarthropathy. Calcif Tissue Int. 97:336–342.