
Abstract
The purpose of this study was to identify the key genes and pathways involved in hypoxic preconditioning of osteoblasts. Cells of the hypoxic-preconditioning group underwent 10 min of hypoxic cultivation/10 min normoxic cultivation three times before 4 h of hypoxic cultivation. The long-time hypoxia group underwent 4 h of hypoxic cultivation, and the control group cells underwent 4 h of normoxic cultivation. Differences in miRNAs expressed were analyzed by high-throughput sequencing. MiRwalk 3.0 was used to predict the target genes and conduct a Gene Set Enrichment Analysis. The STRING database and Cytoscape were used to explore the hub genes. A total of 8635 genes and 121 pathways are enriched in the hypoxic-preconditioning compared with the long-time hypoxia group, including the hub genes Utp6, Eif3a, Etf1, Rrp12 and Mkks. 8,476 target genes and 121 pathways are enriched in the hypoxic-preconditioning group compared with the control group, including the hub genes Chd7, Cebpa and Fosb, and 9,315 target genes and 131 pathways are enriched in the long-term hypoxia group compared with the control group, including the hub genes Dcun1d2, Ube2d1 and Frk. Hypoxia preconditioning improved cell viability (p < 0.01), enhanced ALP, IL10 and VEGF expression, and inhibited IL6 expression (p < 0.05). Hypoxic preconditioning is an effective method for promoting osteoblast activity.
Introduction
Osteoblasts, which have been studied for more than 100 years, play roles in regulating bone homeostasis, neurotransmitter synthesis, lipid accumulation in the liver, hippocampal development, phosphate metabolism, diabetes mellitus, and testosterone production (Datta et al. Citation2008; Oury et al. Citation2011; de Vernejoul et al. Citation2012; Al-Hariri Citation2016; Zoch et al. Citation2016; Chen et al. Citation2018; Jeong and Kim Citation2019; Aguilar et al. Citation2021; Kim et al. Citation2020). Han et al. (Citation2018) summarized the endocrine functions of osteoblasts. Osteoblast secretes fibroblast growth factor 23, osteocalcin, and lipocalin-2 (LCN2) to regulate the biological function of multiple organs, functioning as a special type of endocrine cell. Tsukasaki and Takayanagi (Citation2019) hypothesized that osteoblasts also function as immunoregulatory cells, reporting that osteoblasts produce interleukin (IL)-7, delta-like 4, and CXC-12 to support common lymphoid progenitors, T cell progenitors, and B cells, respectively. Osteoblasts are also involved in brain function. Mosialou et al.(Citation2017) found that osteoblast-derived LCN2 crosses the blood–brain barrier to bind to melanocortin 4 receptor (MC4R) in the paraventricular and ventromedial neurons of the hypothalamus, leading to appetite suppression via an MC4R-dependent anorexigenic pathway.
Hypoxia plays an important role in activating osteoblasts via hypoxia-inducible factor (HIF) signaling. Hypoxia can promote osteoblasts to produce HIF-dependent vascular endothelial growth factor (VEGF) to promote blood vessel formation, which in turn stimulates bone formation and angiogenesis through the delivery of oxygen (Stegen and Carmeliet (Citation2019)). Hypoxia also regulates osteoblast function through the interaction of HIF pathways with runt-related transcription factor 2, alkaline phosphatase (ALP), Wnt signaling pathways, erythropoietin, osteoprotegerin, and microRNA-210 (Rankin et al. Citation2012; Sun and Peng 2015; Kang et al. Citation2017; Xu Citation2018; Yellowley and Genetos Citation2019). Although hypoxia is critical for osteoblast activity, long-time hypoxia can lead to excessive accumulation of HIF, resulting in apoptosis or autophagy (Zhang et al. 2017; Zhou et al. Citation2017; Wang et al. Citation2018; Xiao and Xiao Citation2019).
Studying the effects of hypoxic preconditioning on osteoblasts is important, as hypoxic preconditioning can attenuate hypoxia-related impairment and enhance the hypoxia tolerance of osteoblasts (Wang et al. Citation2018). The normal bone tissue microenvironment is hypoxic and the degree of hypoxia in the bone tissue microenvironment can be aggravated if bones are fractured. Such conditions could impair osteoblast function and even induce osteoblast death. Hypoxic preconditioning can increase the activity of osteoblasts and reduce hypoxia-related damage, thus promoting the physiologic function of osteoblasts and bone repair (Wang et al. (Citation2018)). A number of studies have been published to data regarding the effects of hypoxic preconditioning on reducing injury from long-time hypoxia; however, the key genes and regulatory networks that mediate the effects of hypoxic preconditioning on osteoblasts remain unclear. We previously studied long non-coding RNAs (lncRNAs) and mRNA as they relate to the hypoxic preconditioning of osteoblasts, but the specific regulatory mechanism was not clear (Wang et al. (Citation2018)).
The aim of the present study was to elucidate the regulatory mechanism of hypoxic preconditioning of osteoblasts. In this study, rat osteoblasts were used and CoCl2 was used to simulate a hypoxic environment in vitro. The differential expression of miRNAs in osteoblasts that underwent hypoxic preconditioning, long-time hypoxia, or normal cultivation was then analyzed. MiRwalk 3.0 was used to predict the target genes of the miRNAs and conduct a Gene Set Enrichment Analysis (GSEA) of the target genes. Gene ontology (GO) analysis and enrichment of Kyoto Encyclopedia of Genes and Genomes (KEGG) terms were included in the GESA. An analysis of protein–protein interactions (PPIs) and GESA was used to identify the hub genes and key regulatory networks for these target genes. Finally, to investigate the effects of hypoxic preconditioning on osteoblast activity and the strength of pro- and anti-inflammatory responses, cells were counted using a Cell Counting Kit-8 (CCK-8), and levels of ALP, IL-6, IL-10, and VEGF were determined.
Materials and methods
Cell culture and grouping
The hypoxia culture medium consisted of 200 μmol/L CoCl2 (Sigma, USA) and low-sugar Dulbecco’s modified Eagle’s medium (l-DMEM; Invitrogen, USA). The normoxic medium consisted of l-DMEM with 10% fetal bovine serum (Invitrogen) and 1% penicillin–streptomycin (Invitrogen).
Rat osteoblasts (ROS1728, Guangzhou Jennio Biotech Co., Ltd., website: http://www.jennio-bio.com/products_detail/productId=1007.html) were used in the study. Third-passage osteoblasts were divided into three groups. Cells of the hypoxic-preconditioning group underwent 10 min of hypoxic cultivation/10 min normoxic cultivation three times before undergoing 4 h of hypoxic cultivation. Cells of the long-time hypoxia group underwent 4 h of hypoxic cultivation. Control group cells underwent 4 h of normoxic cultivation. All cells were cultured and maintained in a humidified incubator at 37°C with 5% CO2.
High-throughput sequencing
Total RNA was extracted from each group of cells using a Trizol-based method. Prepared samples were sent to Allwegene Company (Beijing, China, website: http://www.allwegene.com/) for high-throughput sequencing. The sequencing methods were as follows. Briefly, a total of 3 μg of RNA was used to prepare an RNA library for each group using a NEBNext Multiplex Small RNA Library Prep Set for Illumina (NEB, USA). An Agilent 2100 (Agilent, USA) system was used to assess the library quality. In addition, the cBot system (Illumina, USA) was used to cluster the RNAs, which were sequenced on an Illumina Hiseq 2500/2000 platform (Illumina).
After raw data were collected, we removed reads such as those containing poly-N, those with 5′-adapter contamination, those without a 3′adapter or insert tags containing poly-A, -T, -G, or -C, and low-quality reads. The Q20, Q30 and GC content were calculated from the raw data. Known miRNA alignments were based on mapped small RNA tags. However, some small RNA tags can be mapped to more than one category. To ensure that every unique small RNA mapped to only one annotation, the priority rule was followed: known miRNA > rRNA > tRNA > snRNA > snoRNA >repeat > gene > NAT-siRNA>gene>novel miRNA > tasiRNA. The total rRNA proportion (<40%) was used as a sample quality indicator. Finally, tags originating from protein-coding genes, repeat sequences, rRNA, tRNA, snRNA, and snoRNA were removed to obtain differentially expressed miRNAs.
MiRwalk 3.0 (http://mirwalk.umm.uni-heidelberg.de/) was used to predict the target genes of miRNAs and conduct GSEA of the target genes. The GESA included GO and KEGG analyses. The significance criteria for both the GO and KEGG analyses were P-value <0.05 and gene count >2.
The STRING database, version 11.5 (https://string-db.org/), was used to construct PPI networks for the top 100 target genes and Cytoscape software (https://cytoscape.org/) was used to visualize the networks. Hub genes in the PPI networks were identified according to the degrees, closeness and betweenness, as calculated using the cytoNCA app in Cytoscape.
Cell proliferation assay
Cells of each group were inoculated into wells of a 96-well plate (100 μl/well, 30 cells/μl). Cell proliferation was assessed using a CCK-8 (Dojindo, Japan). The analyses were carried out in strict accordance with the instructions. Briefly, CCK-8 reagent was added to each well (10 μl/well) of the 96-well plate for each group, and the plate was incubated 1 h at 37°C with 5% CO2. The absorbance of the wells at 450 nm was then measured using a microplate reader. Cell proliferation was calculated as follows: (As−Ablank)/(Acontrol−Ablank), where As indicates the absorbance of the hypoxic-preconditioning group or long-time hypoxia group, Ablank indicates the absorbance of the medium with CCK-8 reagent but without cells and Acontrol indicates the absorbance of the control group.
Cytokine analyses
Levels of ALP, IL-6, IL-10, and VEGF were determined using enzyme-linked immunosorbent assays (ELISAs). An ALP test kit (Beyotime, China), IL-6 ELISA kit (Cusabio, China), IL-10 ELISA kit (Cusabio) and VEGF ELISA kit (Cusabio) were used. The analyses were carried out in strict accordance with the instructions.
Statistical analysis
SPSS22.0 software was used to analyze the data. Measured data and enumerated data are reported as the median (interquartile) and percentage, respectively. Measured data were compared using the Kruskal–Wallis H test for multiple groups, and two groups were compared using the Mann–Whitney U test. Enumerated data were compared using Fisher’s definite probability methods. P < 0.05 was considered statistically significant.
Results
Differentially expressed miRNAs and target genes
Differentially expressed miRNAs were identified by high-throughput sequencing. Compared with the long-time hypoxia group, 54 miRNAs were identified as upregulated and 79 miRNAs were identified as downregulated in the hypoxic-preconditioning group. In addition, 65 miRNAs were upregulated and 74 miRNAs downregulated in the hypoxic-preconditioning group compared with the control group. A total of 84 miRNAs were upregulated and 45 miRNAs downregulated in the long-time hypoxia group compared with the control group.
The top 20 differentially expressed miRNAs were selected via two-group comparisons (Figure ). MiRwalk 3.0 was used to predict the target genes. A total of 8635 target genes were identified in the hypoxic-preconditioning group compared with the long-time hypoxia group (Table ), and 8476 target genes were identified in the hypoxic-preconditioning group compared with the control group (Table ). In addition, 9315 target genes were identified in the long-time hypoxia group compared with the control group (Table ).
Figure 1. The top 20 differently expressed miRNAs in each two group.
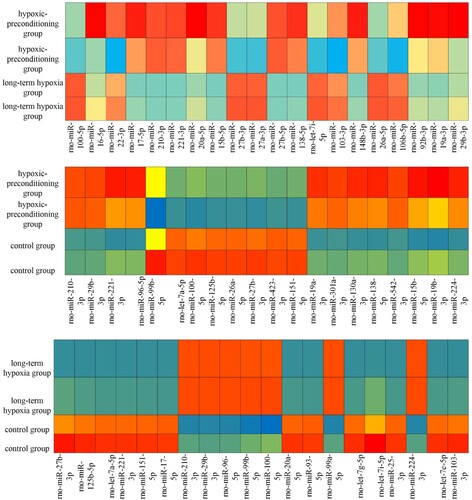
Table 1. The target genes of the hypoxia preconditioning group compared with the long-time hypoxia group.
Table 2. The target genes of the hypoxia preconditioning group compared with the control group.
Table 3. The target genes of long-time hypoxia group compared with control group.
GESA of the target genes
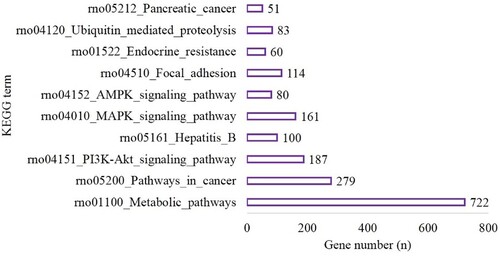
MiRwalk 3.0 was used to conduct a GESA (which included GO and KEGG analyses) of the target genes. In the hypoxic-preconditioning group, the target genes were enriched in 89 GO terms compared with the long-time hypoxia group (Biological Process [BP], 58; Cellular Component [CC], 11 and Molecular Function [MF], 20) based on the criteria of P-value <0.05 and gene count >2. The top 10 significant terms with the lowest P values for the BP, CC and MF terms are shown in Figure . A total of 121 pathways were enriched for the target genes based on the criteria of P-value <0.05 and gene count >2. The top 10 pathways are shown in Figure and included 722 genes involved in metabolic pathways (P < 0.001), 279 genes involved in the pathways in cancer (P < 0.0001), 187 genes involved in PI3K-Akt signaling pathway (P < 0.001), 100 genes involved in Hepatitis B (P < 0.001), 161 genes involved in MAPK signaling pathway (P < 0.001), 80 genes involved in AMPK signaling pathway (P < 0.001), 114 genes involved in focal adhesion (P < 0.001), 60 genes involved in endocrine resistance (P = 0.001), 83 genes associated with ubiquitin-mediated proteolysis (P = 0.001) and 51 genes involved in pancreatic cancer (P = 0.001) (Figure ).
Figure 2. The top 10 BP, CC and MF of GO terms in the hypoxia preconditioning group compared with the long-time hypoxia group.
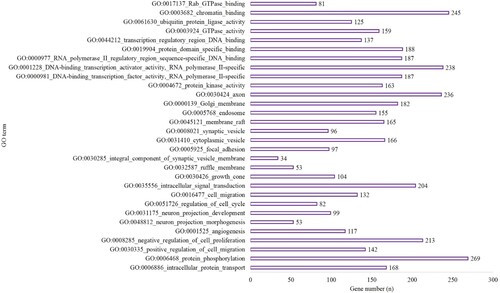
Figure 3. The top 10 terms of KEGG enrichment in the hypoxia preconditioning group compared with the long-time hypoxia group.
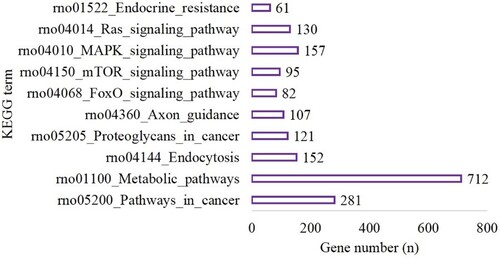
In the hypoxic-preconditioning group, the target genes were enriched in 106 GO terms compared with the control group (BP, 65; CC, 11 and MF, 30). The top 10 BP, CC and MF terms are shown in Figure . A total of 121 pathways were enriched for the target genes. The top 10 pathways are shown in Figure and included 281 genes involved in pathways in cancer (P < 0.001), 712 genes involved in the metabolic pathways (P < 0.0001), 152 genes involved in endocytosis (P < 0.001), 121 genes involved in proteoglycans in cancer (P < 0.001), 107 genes involved in axon guidance (P < 0.001), 82 genes involved in the FoxO signaling pathway (P < 0.001), 95 genes involved in mTOR signaling pathway (P < 0.001), 157 genes involved in MAPK signaling pathway (P < 0.001), 130 genes involved in Ras signaling pathway (P < 0.001) and 61 genes involved in endocrine resistance (P < 0.001) (Figure ).
Figure 4. The top 10 BP, CC and MF of GO terms in the hypoxia preconditioning group compared with the control group.
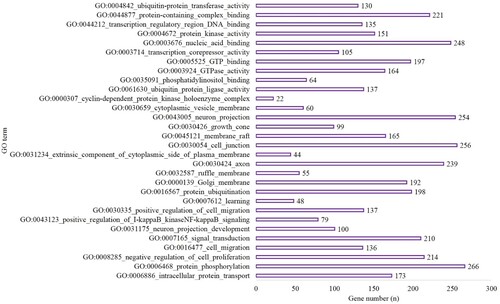
Figure 5. The top 10 terms of KEGG enrichment in the hypoxia preconditioning group compared with the control group.
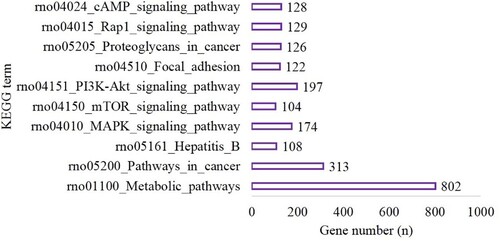
In the long-time hypoxia group, the target genes were enriched in 110 GO terms (BP, 61; CC, 8 and MF, 22). The top 10 terms are shown in Figure . A total of 131 pathways were enriched for the target genes. The top 10 pathways are shown in Figure and included 802 genes involved in metabolic pathways (P < 0.001), 313 genes involved in pathways in cancer (P < 0.0001), 108 genes involved in Hepatitis B (P < 0.001), 174 genes involved in the MAPK signaling pathway (P < 0.001), 104 genes involved in the mTOR signaling pathway (P < 0.001), 197 genes involved in the PI3K-Akt signaling pathway (P < 0.001), 122 genes involved in Focal adhesion (P < 0.001), 126 genes involved in proteoglycans in cancer (P < 0.001), 129 genes involved in the Rap1 signaling pathway (P < 0.001) and 128 genes involved in the cAMP signaling pathway (P < 0.001) (Figure ).
Figure 6. The top 10 BP, CC and MF of GO terms in the long-time hypoxia group compared with the control group.
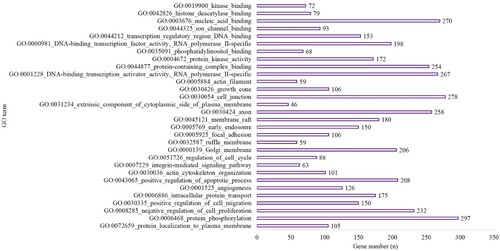
Figure 7. The top 10 terms of KEGG enrichment in the long-time hypoxia group compared with the control group.
PPI network construction and identification of hub genes
The STRING database was used to construct a PPI network of the top 100 target genes and the disconnected nodes in the network were hidden. In the hypoxic-preconditioning group, the PPI network included 97 nodes and 29 edges compared with the long-time hypoxia group. The average node degree was 0.598 and the average local clustering coefficient was 0.311. Hub genes were identified using three different computing methods: degree, closeness and betweenness. We selected the top 5 genes using each computing method, and the intersection of the top 5 genes was defined as the hub: Utp6, Eif3a, Etf1, Rrp12 and Mkks (Figure a).
Figure 8. PPI networks. The color of genes gradually changed from purple to yellow as high scores to low scores based on the degree algorithm. (a) hypoxia preconditioning group compared with the long-time hypoxia group; (b): the hypoxia preconditioning group compared with the control group and (c): the long-time hypoxia group compared with the control group.
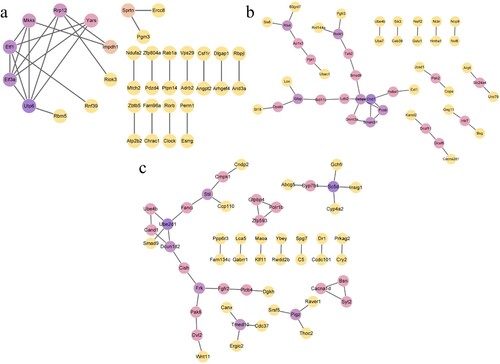
In the hypoxic-preconditioning group, the PPI network included 38 edges compared with the control group. The average node degree was 0.644 and the average local clustering coefficient was 0.227. Chd7, Cebpa and Fosb were identified as the hub genes (Figure b). In the long-time hypoxia group, the PPI network included 42 edges compared with the control group. The average node degree was 0.808 and the average local clustering coefficient was 0.337. Dcun1d2, Ube2d1 and Frk were identified as the hub genes (Figure c).
Cell proliferation and cytokine content assays
A CCK-8 was used to evaluate cell proliferation. The cell proliferation rate was ranked as follows: control group > hypoxic-preconditioning group > long-time hypoxia group (P < 0.001, P = 0.002, respectively) (Figure ).
Figure 9. CCK-8 and cytokines detection results. Hypoxia preconditioning improved cell viability by CCK-8 assay (p < 0.01), enhanced ALP, IL10, and VEGF expression, and inhibited IL6 expression (p < 0.05), *p < 0.05, **p < 0.01. n = 20.
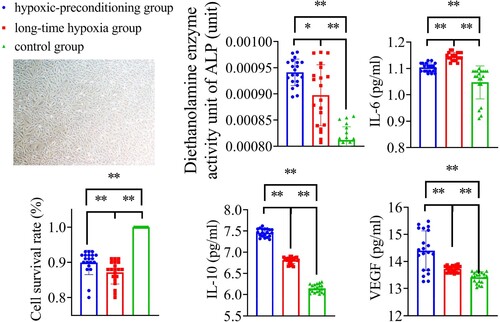
The corrected cytokine concentration was calculated as follows: measured cytokine concentration/CCK-8 value. ALP exhibited the following trend: hypoxic-preconditioning group >long-time hypoxia group >control group (P = 0.017, P < 0.001, respectively). IL-6 exhibited the following trend: long-time hypoxia group > hypoxic-preconditioning group >control group (P < 0.001, P < 0.001, respectively). IL-10 exhibited the following trend: long-time hypoxia group > hypoxic-reconditioning group > control group (P < 0.001, P < 0.001, respectively). VEGF exhibited the following trend: control group < long-time hypoxia group < hypoxic-preconditioning group (P < 0.001, P = 0.009, respectively) (Figure ).
Discussion
Hypoxic preconditioning has a long history as a method for increasing cellular hypoxia tolerance; however, details regarding the regulatory network are unclear. Although a variety of signaling pathways (such as the HIF pathway) and reactive oxygen species are considered the most important factors affecting hypoxic preconditioning, the specific key genes and details regarding their effects remain to be clarified (Cheng et al. Citation2017; Cadenas Citation2018; Sethi et al. 2018; Rosenberger and Eckardt Citation2019).
Osteoblasts function as the key cells in maintaining bone homeostasis via their involvement in the generation of new bone, promoting bone angiogenesis, regulating bone immunity and balancing inflammatory homeostasis in the bone microenvironment. Hypoxic preconditioning not only reduces the degree of damage to osteoblasts caused by long-time hypoxia, it also promotes the bioactivity of osteoblasts in immune responses and regulating inflammation and angiogenesis. However, there were few studies that discussed about hypoxic-preconditioning on osteoblasts. In our study, rat osteoblasts were used and 200 μmol/L CoCl2 was to simulate a hypoxic environment in vitro and the key regulatory network underlying hypoxic preconditioning in osteoblasts was explored. The experimental scheme was referred to in the previous study (Wang et al. Citation2018). Hypoxic-preconditioning was 10 min of hypoxic cultivation/10 min normoxic cultivation three times before long-time hypoxic cultivation.
The significance and novelty of the study were first clarified by the regulatory mechanism of hypoxic preconditioning on osteoblast. The miRwalk 3.0, STRING and Cytoscape software packages were used to investigate the regulatory network. Compared with long-time hypoxia, hypoxic preconditioning upregulated 54 miRNAs and downregulated 79 miRNAs. rno-miR-100-5p, rno-miR-16-5p, rno-miR-17-5p, rno-miR-210-3p, rno-miR-22-3p and rno-miR-221-3p were the top six different expressed miRNAs. The top 20 different expressed miRNAs had 8635 target genes. The top five genes were Csf1r, Rnmt, Stard6, St8sia5 and RGD1565222. Csf1r is a cytokine that controls the production, differentiation, and function of macrophages and a tyrosine kinase transmembrane receptor. RNMT was related to RNA binding and mRNA (guanine-N7-)-methyltransferase activity. Stard6 is related to cholesterol homeostasis and St8sia5 is a member of glycosyltransferase family 29, and may be involved in the synthesis of gangliosides GD1c, GT1a, GQ1b, and GT3 from GD1a, GT1b, GM1b and GD3, respectively.
According to the PPI network analysis and three algorithms, the key regulatory genes of hypoxic preconditioning on osteoblasts were Utp6, Eif3a, Etf1, Rrp12 and Mkks. The regulatory networks between hypoxic preconditioning and normal cultured cells, long-time hypoxia and normal cultured cells were also analyzed. In the hypoxic-preconditioning group, Chd7, Cebpa and Fosb were identified as the hub genes compared with the control group. In addition, in the long-time hypoxia group, Dcun1d2, Ube2d1 and Frk were identified as the hub genes compared with the control group. However, there are few studies that discussed about these genes on osteoblasts.
We also assessed osteoblast proliferation and cytokine production. Although hypoxic preconditioning can reduce the degree of the cell damage caused by long-time hypoxia, it cannot totally prevent adverse effects on cell survival, as noted by the significant difference in proliferation capacity between the control group and hypoxic-preconditioning group in the present study. We also examined osteoblast secretion of inflammation-related factors such as IL-6 and IL-10 and various growth factors such as ALP and VEGF. We found that hypoxic preconditioning reduced the release of pro-inflammatory factors and promoted the release of anti-inflammatory factors. The effect on the secretion of ALP and VEGF was not the same, indicating that hypoxic preconditioning has a greater effect on promoting angiogenesis than accelerating osteoblast proliferation.
The major limitation of this study is that CoCl2-induced hypoxia differs from physiologic hypoxia, and therefore, the results of the study may be biased. However, the results of this study do enhance our understanding of the effects of hypoxic preconditioning on osteoblasts. Previous research identified differentially expressed lncRNAs and mRNAs but did not analyze the specific genes in detail. In addition, the former research did not examine the expression of ALP, IL6, IL10 or VEGF.
Conclusion
Hypoxic preconditioning is an effective method for promoting the activity of osteoblasts, primarily via effects on various metabolic pathways. The hub genes identified by a comparison of gene expression in osteoblasts subjected to hypoxic preconditioning versus long-time hypoxia in the present study were Utp6, Eif3a, Etf1, Rrp12 and Mkks. By contrast, Chd7, Cebpa and Fosb were identified as hub genes in the comparison of hypoxic preconditioning and normal culture. A comparison of osteoblasts subjected to long-time hypoxia versus normal culture identified Dcun1d2, Ube2d1 and Frk as hub genes.
Acknowledgements
We thank the Medical Research Center of Beijing Chaoyang Hospital affiliated to Capital Medical University for providing the experimental place. JLZ and DW designed this study; DW, XQW and XBZ did the experiments; DW, XQW and XBZ collected and analyzed the data; DW wrote the article and JLZ revised the article. All the authors read and approved the final manuscript.
Disclosure statement
No potential conflict of interest was reported by the author(s).
Data availability statement
The supplemental data used to support the findings of this study have been stored in Mendeley data repository (https://data.mendeley.com/datasets/6bx2p5zz84/1).
Additional information
Funding
References
- Aguilar R, Bustos FJ, Nardocci G, van Zundert B, Montecino M. 2021. Epigenetic silencing of the osteoblast-lineage gene program during hippocampal maturation. J Cell Biochem. 122(3–4):367–384. DOI: 10.1002/jcb.29865.
- Al-Hariri M. 2016. Sweet bones: The pathogenesis of bone alteration in diabetes. J Diabetes Res. 2016:6969040. DOI: 10.1155/2016/6969040.
- Cadenas S. 2018. ROS and redox signaling in myocardial ischemia-reperfusion injury and cardioprotection. Free Radic Biol Med. 117:76–89. DOI: 10.1016/j.freeradbiomed.2018.01.024.
- Chen X, Wang Z, Duan N, Zhu G, Schwarz EM, Xie C. 2018. Osteoblast–osteoclast interactions. Connect Tissue Res. 59(2):99–107. DOI: 10.1080/03008207.2017.1290085.
- Cheng L, Yu H, Yan N, Lai K, Xiang M. 2017. Hypoxia-inducible factor-1α target genes contribute to retinal neuroprotection. Front Cell Neurosci. 11:20. DOI: 10.3389/fncel.2017.00020.
- Datta HK, Ng WF, Walker JA, Tuck SP, Varanasi SS. 2008. The cell biology of bone metabolism. J Clin Pathol. 61(5):577–587. DOI: 10.1136/jcp.2007.048868.
- de Vernejoul M-C, Collet C, Chabbi-Achengli Y. 2012. Serotonin: good or bad for bone. Bonekey Rep. 1:120. DOI: 10.1038/bonekey.2012.120.
- Han Y, You X, Xing W, Zhang Z, Zou W. 2018. Paracrine and endocrine actions of bone – the functions of secretory proteins from osteoblasts, osteocytes, and osteoclasts. Bone Res. 6:16. DOI: 10.1038/s41413-018-0019-6.
- Jeong HM, Kim DJ. 2019. Bone diseases in patients with chronic liver disease. Int J Mol Sci. 20(17):4270. DOI: 10.3390/ijms20174270.
- Kang H, Yang K, Xiao L, Guo L, Guo C, Yan Y, Qi J, Wang F, Ryffel B, Li C, Deng L. 2017. Osteoblast hypoxia-inducible factor-1α pathway activation restrains osteoclastogenesis via the interleukin-33-microRNA-34a-Notch1 pathway. Front Immunol. 8:1312. DOI: 10.3389/fimmu.2017.01312.
- Kim JM, Lin C, Stavre Z, Greenblatt MB, Shim JH. 2020. Osteoblast-osteoclast communication and bone homeostasis. Cells. 9(9):2073. DOI: 10.3390/cells9092073.
- Mosialou I, et al. 2017. MC4R-dependent suppression of appetite by bone-derived lipocalin 2. Nature. 543(7645):385–390. DOI: 10.1038/nature21697.
- Oury F, Sumara G, Sumara O, Ferron M, Chang H, Smith CE, Hermo L, Suarez S, Roth BL, Ducy P, Karsenty G. 2011. Endocrine regulation of male fertility by the skeleton. Cell. 144(5):796–809. DOI: 10.1016/j.cell.2011.02.004.
- Rankin EB, Wu C, Khatri R, Wilson TLS, Andersen R, Araldi E, Rankin AL, Yuan J, Kuo CJ, Schipani E, Giaccia AJ. 2012. The HIF signaling pathway in osteoblasts directly modulates erythropoiesis through the production of EPO. Cell. 149(1):63–74. DOI: 10.1016/j.cell.2012.01.051.
- Rosenberger C, Eckardt KU. 2019. Oxygenation of the transplanted kidney. Semin Nephrol. 39(6):554–566. DOI: 10.1016/j.semnephrol.2019.10.005.
- Sethi K, Rao K, Bolton D, Patel O, Ischia J. 2018. Targeting HIF-1 α to prevent renal ischemia-reperfusion injury: does it work? Int J Cell Biol. 2018:9852791. DOI: 10.1155/2018/9852791.
- Stegen S, Carmeliet G. 2019. Hypoxia, hypoxia-inducible transcription factors and oxygen-sensing prolyl hydroxylase s in bone development and homeostasis. Curr Opin Nephrol Hypertens. 28(4):328–335. DOI: 10.1097/MNH.0000000000000508.
- Sun G, Peng H. 2015. HIF-1α-induced microRNA-210 reduces hypoxia-induced osteoblast MG-63 cell apoptosis. Biosci Biotechnol Biochem. 79(8):1232–1239. DOI: 10.1080/09168451.2014.1003128.
- Tsukasaki M, Takayanagi H. 2019. Osteoimmunology: evolving concepts in bone–immune interactions in health and disease. Nat Rev Immunol. 19(10):626–642. DOI: 10.1038/s41577-019-0178-8.
- Wang D, Liu Y, Yang X, Zhou J. 2018. Hypoxic preconditioning enhances cell hypoxia tolerance and correlated lncRNA and mRNA analysis. Life Sci. 208:46–54. DOI: 10.1016/j.lfs.2018.07.014.
- Xiao L, Xiao Y. 2019. The autophagy in osteoimmonology: self-eating, maintenance, and beyond. Front Endocrinol. 10:490. DOI: 10.3389/fendo.2019.00490.
- Xu G. 2018. HIF-1-mediated expression of Foxo1 serves an important role in the proliferation and apoptosis of osteoblasts derived from children’s iliac cancellous bone. Mol Med Rep. 17(5):6621–6631. DOI: 10.3892/mmr.2018.8675.
- Yellowley CE, Genetos DC. 2019. Hypoxia signaling in the skeleton: implications for bone health. Curr Osteoporos Rep. 17(1):26–35. DOI: 10.1007/s11914-019-00500-6.
- Zhang Z, Lai Q, Li Y, Xu C, Tang X, Ci J, Sun S, Xu B, Li Y. 2017. Acidic pH environment induces autophagy in osteoblasts. Sci Rep. 7:46161. DOI: 10.1038/srep46161.
- Zhou L, Wang S Il, Moon YJ, Kim KM, Lee KB, Park BH, Jang KY, Kim JR. 2017. Overexpression of SIRT1 prevents hypoxia-induced apoptosis in osteoblast cells. Mol Med Rep. 16(3):2969–2975. DOI:10.3892/mmr.2017.6917.
- Zoch ML, Clemens TL, Riddle RC. 2016. New insights into the biology of osteocalcin. Bone. 82:42–49. DOI: 10.1016/j.bone.2015.05.046.