
Abstract
The incidence of nerve root sedimentation sign (SedSign) was evaluated to explore potential pathogenesis in patients with severe lumbar spinal stenosis (LSS). In a total of 209 patients with severe LSS, 290 intervertebral levels were narrow, among which 248 showed a positive SedSign, giving a prevalence of 85.52%. Those levels with a positive SedSign were further analyzed relative to those with a negative SedSign. There was no significant difference between the two groups for the cross-sectional area (CSA) or the posteroanterior diameter (PAD). In contrast, there was a significant difference between the groups for the grade of degenerative facet joint (DFJ) (p < 0.05), the thickness of ligamentum flavum (TLF) (p < 0.01), and the cross-sectional area difference (CSAD) (p < 0.01). In addition, receiver operating characteristic (ROC) curves were used to identify associated factors. The area under the ROC curve for PAD was 0.608 (p < 0.05), for DFJ was 0.634 (p < 0.05), for TLF was 0.74 (p < 0.01), and for CSAD was 0.911 (p < 0.01). In summary, a positive SedSign has notable advantages in assisting with the diagnosis of severe LSS. Compression of the dural sac from the rear may be the main risk factors of a positive SedSign.
Introduction
Lumbar spinal stenosis (LSS) is represented by the reduction of the lumbar spinal canal capacity, compression of the dural sac, and entrapment of nerve roots, which collectively induce a series of clinical dysfunctions in the patient (Atlas et al. Citation2000; Verbiest Citation2001). Although patient history, clinical examination, electrophysiological analyses, and confirmatory imaging findings such as cross-sectional area (CSA) of the dural sac (Schizas et al. Citation2010; Hiyama et al. Citation2019) and posteroanterior diameter (PAD) of the spinal canal (Haig et al. Citation2007) can be used to diagnose LSS, there are currently no universally accepted diagnostic criteria for LSS (Fritz et al. Citation1997; Atlas et al. Citation2005; Kapural et al. Citation2007). Because diagnosis of LSS is difficult when clinical symptoms such as pain and functional limitations often occur only during activity but disappear at rest, imaging findings do not always correlate with clinical symptoms (Alyas et al. Citation2008; Arabmotlagh et al. Citation2019).
To improve the ability to diagnose LSS, Barz et al. (Citation2010) introduced a new radiological index, the nerve root sedimentation sign (SedSign). The SedSign is a phenomenon visible in axial MRI scans: when a patient is in the supine position, an MRI scan shows that the lumbar nerve roots sediment, as a result of gravity, to the dorsal part of the dural sac in patients with no suspicion of LSS. In contrast, in patients with severe LSS, such sedimentation is almost always absent, this phenomenon being referred to as a positive sedimentation sign. According to the report from Barz et al., the SedSign is 94% sensitive and 100% specific for LSS, when used in conjunction with the criteria of walking distance ≤ 200 m and CSA of the dural sac ≤ 80 mm2 to define probable LSS cases (Barz et al. Citation2010). Another research also showed that the sensitivity of the SedSign was 60–96% in postoperative spines (Tomkins-Lane et al. Citation2013). All these studies suggest that a positive SedSign is a sensitive MRI parameter of patients with LSS, especially patients with severe morphological spinal stenosis.
A SedSign measurement is simple, intuitive, and easy to obtain, and is considered a good indicator for the use of diagnosing severe LSS in clinical practice (Macedo et al. Citation2013; Zhang et al. Citation2015). However, the mechanism responsible for a positive SedSign is still not clear. What risk factors are related specifically to the phenomenon of a positive SedSign? We hypothesized that a positive SedSign is associated with a change in the dural sac at the level of intervertebral stenosis of patients with LSS. To test our hypothesis, we investigated the incidence of a positive SedSign and correlations with MRI parameters in patients with severe LSS.
Materials and methods
Participants
This study was a retrospective review, which was approved by the ethics committee of Qiqihar Medical College (reference number 201822). The MR images of patients with severe LSS were obtained from our hospital for individuals admitted for inpatient or outpatient treatment between January 2017 and June 2019, all of whom were consistent with LSS diagnostic criteria and were assessed for eligibility based on the following criteria: (1) a CSA of the dural sac of ≤80 mm2 for at least one level in an axial MRI scan; (2) typical intermittent claudication, with or without lower back pain or leg pain; and (3) walking distance ≤ 500 m. The exclusion criteria were as follows: (1) presence of lower extremity arterial occlusive syndrome, lumbar tumor, multiple nerve injury, spinal trauma, or limited mobility caused by osteoarthritis; (2) presence of coronary thrombosis or a previous stent surgery; (3) LSS at level L5/S1 was excluded because the S1 and S2 nerve roots leave the dural sac in a ventral position, inhibiting sedimentation to the dorsal part of the dural sac according to Barz et al. (Citation2010).
MRI data acquisition
A total of 627 patients who had undergone MRI examination of the lumbar spine were included in this study. MRI scans were made with a magnetic resonance instrument (HITACHI echelon 1.5 T, Japan) and consisted of sagittal T1- and T2-weighted images and axial T2-weighted images (thickness, 4 mm; 20% gap size). All patients were imaged while in the standard supine position, with both legs straight. The scanning range covered L1/2 to L5/S1, and the three scans described above were acquired for each intervertebral level. We used a complete digital image storage area measurement system (Accurad V4.0 software) to process the obtained data. All MRI parameters for each image scan were separately assessed by three radiologists who are experienced independent investigators. The mean value of the three calculations was used as the measurement for further analysis.
For each patient, the PAD of the spinal canal was measured in the three MRI scans of narrow levels as the distance between the midpoint of the posterior margin of the disc and the midpoint of the posterior wall of the spinal canal (Figure a). The minimum PAD was used for further investigation as it is indicative of the narrowing of the spinal canal in the sagittal plane. The thickness of the ligamentum flavum (TLF) was measured on axial T2-weighted MR images at the level of the facet joint as shown in Figure (b). The maximum TLF was determined as an indicator of dural sac posterior compression. In addition, the lumbar facet joints were graded on both the left and right side at levels L1/2, L2/3, L3/4, and L4/5, and then the average value was used to determine the degenerative facet joint (DFJ) grade. Four grades of DFJ were defined using criteria similar to those published by Kalichman et al. (Citation2008) and Weishaupt et al. (Citation1999); these criteria are shown in Table .
Figure 1. Measurement of the cross-sectional area (CSA) of the dural sac and the posteroanterior diameter (PAD) of the spinal canal. b: Measurement of the thickness of the ligamentum flavum (TLF) and the space of the facet joint (FJ) which can used to evaluate DFJ.
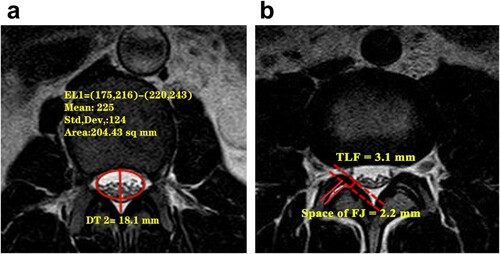
Table 1. Criteria for grading degeneration of the facet joint.
Definition of the maximum cross-sectional area difference (CSAD)
The CSA of the dural sac was measured based on the area bounded by the edge of the epidural sac (Figure a) in each narrow intervertebral level of the three MRI scans to determine the minimum CSA, which represents the absolute compression of the dural sac. To describe the change in the dural sac, we introduced the maximum cross-sectional area difference (CSAD) of the dural sac, which was calculated by subtracting the minimum CSA measured across the three scans at each level where stenosis had occurred from the maximum CSA; the difference represents the CSAD value for that particular level. A higher CSAD value indicates a greater change in the dural sac at the level of narrowing. Conversely, a lower CSAD value indicates a more gradual narrowing of the dural sac under pressure.
Determining the nerve root SedSign
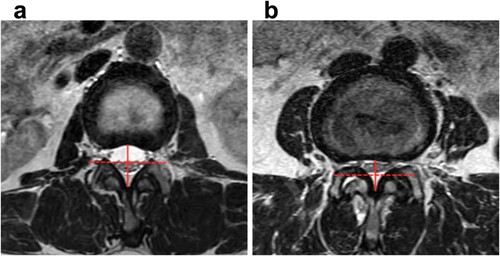
Patients were rated by the other three investigators as SedSign positive or negative based on their MR images. In brief, a vertical line was drawn along the midpoint of the posteroanterior diameter of the spinal canal, and a horizontal line was drawn that divided the dural sac into an upper and lower part in each axial T2-weighted image. A negative SedSign was defined as having all caudae equinae located in the lower part of the dural sac with the exception of the two ventral nerve roots that exit caudal to the level at which the observations were made (Figure a). A positive SedSign was defined as an absence of cauda equina sedimentation because of the tight canal, a result of the distortion of the dural sac, with the majority of nerve roots located in the upper part of the sac (Figure b). Where there was a disagreement between the raters, a consensus was reached between both investigators, who were assisted by another experienced independent investigator as a third opinion. All imaged levels for each individual were classified as having a positive or negative SedSign.
Figure 2. A negative SedSign was defined as having all caudae equinae located in the lower part of the horizontal red dashed line with the exception of the two ventral nerve roots that exit caudal to the level at which the image was taken. b: A positive SedSign was defined as an absence of cauda equina sedimentation, and a ‘squashing’ of the dural sac, with the majority of nerve roots located above the horizontal red dashed line. The horizontal dashed line passes through the midpoint of the posteroanterior diameter of the spinal canal (the red solid line).
Statistical analysis
Data are shown as the mean ± standard deviation. The t-test was applied for comparisons between the positive SedSign group and the negative group. The receiver operating characteristic (ROC) curve was used to assess correlations between morbidity of positive SedSign and parameters such as the minimum CSA, minimum PAD, maximum TLF, grade of DFJ, and maximum CSAD. SPSS18.0 software was used for all statistical analyses, and p < 0.05 was considered as statistically significant.
Results
According to the inclusion/exclusion criteria, 209 patients were included in the current study, and their general information was shown in Table . There were 84 males and 125 females, aged 57.3 ± 14.9 and 62.68 ± 11.06 years, respectively. There was no significant difference in Oswestry Disability Index (ODI) and walking distance between male and female patients, but a significant difference in BMI was found. Among these patients, 290 intervertebral levels were identified as having severe LSS, which included 248 intervertebral levels with a positive SedSign and 42 levels with a negative SedSign. The occurrence of positive and negative SedSign measurements at different intervertebral levels for the 290 levels with severe LSS is shown in Table . The prevalence of a positive SedSign was 85.52% for all levels.
Table 2. The general information of 209 patients with severe LSS.
Table 3. Distribution of a positive SedSign across 290 levels of LSS.
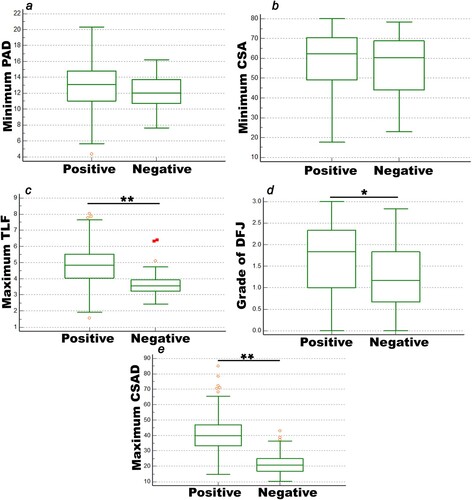
We then compared several parameters, including minimum PAD and CSA, DFJ, maximum TLF and CSAD, between the levels with a positive SedSign (n = 248) and those with a negative SedSign (n = 42), and the results are shown in Figure . Between the positive and negative SedSign groups, there was no significant difference with respect to the minimum PAD and CSA (p > 0.05). However, there was a significant difference in the maximum TLF and the grade of DFJ, and the maximum CSAD (p < 0.05).
Figure 3. The MRI parameters were evaluated between the positive SedSign group and the negative SedSign group. a: The minimum CSA. b: The minimum PAD. c: The maximum TLF. d: The grade of DFJ. e: The maximum CSAD. *p < 0.05 and **p < 0.01.
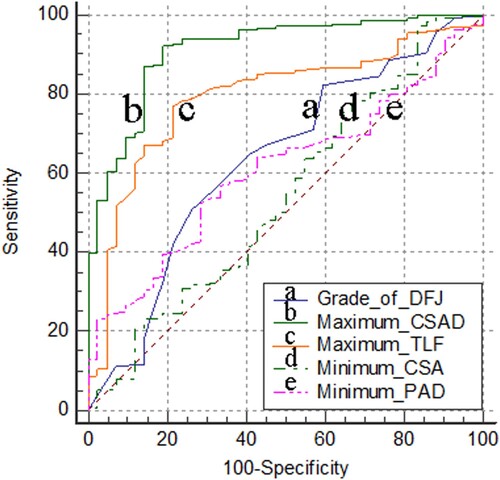
To evaluate any correlations between a positive SedSign and the above parameters, we further studied the sensitivity between the prevalence of a positive SedSign and these parameters with the ROC curve method (Figure ). Our results suggested that there is no obvious correlation between the prevalence of a positive SedSign and minimum CSA (p > 0.05). However, the prevalence was moderately correlated with minimum PAD and DFJ (p < 0.05). Finally, significant correlation was observed between the prevalence of a positive SedSign and the maximum TLF and CSAD (p < 0.01).
Figure 4. Correlation between the prevalence of a positive SedSign and grade of DF, maximum TLF and CSAD, minimum CSA and PAD. The area under the ROC curve (AUC) for the grade of DFJ was 0.634 (a line, 95% CI: 0.576 − 0.69, p < 0.05). The AUC for maximum CSAD was 0.913 (b line, 95% CI: 0.875 − 0.943, p < 0.01). The AUC for maximum TLF were 0.793 (c line, 95% CI: 0.742 − 0.839, p < 0.01). The AUC for minimum CSA was 0.543 (d line, 95% CI: 0.484 − 0.601, p > 0.05). The AUC for minimum PAD was 0.608 (e line, 95% CI: 0.55 − 0.665, p < 0.05).
Discussion
Here we conducted a retrospective study to evaluate the lumbar MR images of 209 patients with severe LSS, including 84 male and 125 female patients. We found no significant difference in average age and ODI, and in particular, no significant difference could be found in walking distance, between male and female with severe LSS. However, we found a significant difference in BMI between the two, which may be due to gender differences between male and female. In total, 290 lumbar sections were diagnosed as severe LSS based on our inclusion criteria, and 248 intervertebral discs were assigned to the positive SedSign group. There were only 2 sections at the L1/2 level and 12 at the L2/3 level diagnosed as severe LSS, all of which were assessed as having positive SedSign (100%). Meanwhile, the incidence of a positive SedSign was 76 in 87 L3/4 levels (87.36%) and 158 in 189 L4/5 levels (83.6%). Therefore, the overall incidence of a positive SedSign was 85.52% in this study. Our results suggested a positive SedSign was most common in the lower lumbar spine, which is consistent with the segments that show a high incidence of LSS (Binder et al. Citation2002; Wu and Cruz Citation2020). Thus, our results suggested that a positive SedSign should be used as an image parameter for the diagnosis of and screening for LSS in clinical practice.
Although the SedSign has been reported to have high diagnostic sensitivity, specificity, and efficacy, and good clinical application value for the diagnosis of LSS (Barz et al. Citation2010; Macedo et al. Citation2013; Tomkins-Lane et al. Citation2013; Zhang et al. Citation2015), the pathogenesis and correlated risk factors of positive SedSign were still unclear. As well known, the PAD of spinal canal, as a linear indicator of the spinal canal, is measured as the distance from the midpoint of the anterior wall to the midpoint of the posterior wall, and was used to assess the degree of spinal stenosis in the sagittal plane (Sheldom et al. Citation1976). In the present study, we found that there was no significant difference in the PAD between the positive and negative SedSign groups, although the ROC curve for the PAD showed a mid-correlation between a positive SedSign and the PAD. We considered that the main reason may be the physiologically invalid cavity filled with adipose tissue existing between the posterior of the dural sac and the posterior wall of the spinal canal, which may affect the PAD of the spinal canal to reflect the degree of spinal canal stenosis effectively. In addition, the CSA of the dural sac, as the spinal canal area parameter, was superior to vertebral canal diameter line parameters in diagnosing LSS (Hamanishi et al. Citation1994). Due to the characteristics of the spinal canal morphology, some degenerative changes occur in the non-midline part of the spinal canal, often inducing lateral recess stenosis and finally lead to reduction in spinal canal volume (Hamanishi et al. Citation1994). However, some researchers considered that the CSA could be insufficient as a diagnostic tool (Staub et al. Citation2011; Piechota et al. Citation2019). Lohman et al. (Citation2006) confirmed that the degree of LSS and the CSA of the dural sac had no significant correlation with the severity of clinical symptoms. Our results also showed that the minimum CSA was not significantly different between the positive SedSign group and the negative SedSign group; at the same time, the ROC curve also showed that there was no significant correlation between the prevalence of a positive SedSign and the minimum CSA. Thus, it is also believed that the CSA of the dural sac and PAD of the spinal canal cannot fully explain the involvement of nerves in LSS due to the great individual differences.
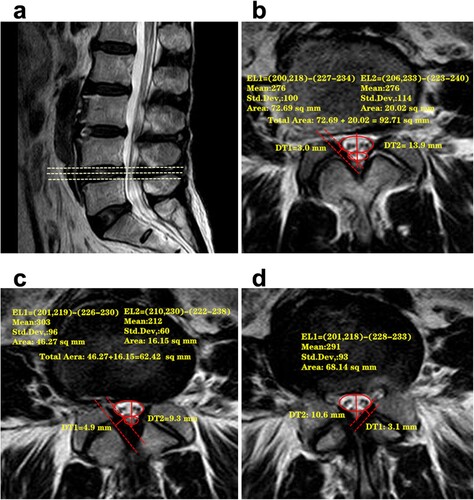
To further investigate the possible pathogenesis that leads to a positive SedSign, we conducted a novel radiological parameter, the maximum CSAD of the dural sac, to describe the narrowing change of the dural sac. In the present study, we observed the sagittal and axial MR images of the patients with severe LSS who were determined as having a positive SedSign at the L4/5 level (Figure ). The dural sac was pushed ventrally or toward the center of the spinal canal by posterior compression in the region where the most severe narrowing occurred (Figure c), and the CSA was at its minimum in this scan image. However, the dural sac at the adjacent sites was less compressed, as shown in Figure (b), and the corresponding CSA was more normal. The maximum CSAD of the dural sac was large, which indicated an acute change in the dural sac between the narrowest section and the normal section. As a result, the nerve roots were pulled toward the center of the spinal canal and a positive SedSign was observed on the MR image. In contrast, when the maximum CSAD was small, there was only minor variation in the dural sac between the level at which narrowing occurred and normal levels, resulting in minimal displacement of the nerve roots and the absence of a positive SedSign in the MR image at the levels adjacent to the stenosis. Meanwhile, significant differences also were observed in the maximum CSAD between the positive group and the negative group, and the ROC curve result also showed that there was the highest correlation between the maximum CSAD and incidence rate of positive SedSign. All these results suggested that the positive SedSign is more closely related to a change in the dural sac caused by posterior compression at the level of stenosis, which may be the main reason for the appearance of sedimentation syndrome.
Figure 5. The relationship between a positive SedSign and a change in the CSA of the dural sac at the level of stenosis. a: A sagittal T2-weighted image of L4/5 shows compression of the dural sac because of substantial narrowing in the third MRI scan. b: The first transverse layer of level L4/5, at which point the dural sac was lightly compressed, and there was minimal tendency of the neve roots or cauda equina to move ventrally or toward the center of the spinal canal. A suggestion of a positive SedSign was observed, although not definitively. c: The second transverse layer of level L4/5 OR MR image, at which point the narrowing of the dural sac was increased, the nerve roots were shifted substantially, and a positive SedSign was present. d: The third transverse layer of level L4/5 showed the greatest stenosis. Because of the narrowing of the canal, the nerves were ‘‘squashed’’ and therefore present on both sides of the equator, such that a positive SedSign was apparent.
To verify the hypothesis, two posterolateral parameters, thickness of ligamentum flavum (TLF) and degeneration of facet joint (DFJ), were further assessed as to their correlation with the positive SedSign. The ligamentum flavum and facet joint are the main structures that make up the posterior and lateral spinal canal walls, and have a protective effect on the spinal cord (Karavelioglu et al. Citation2016). They have been confirmed to have important roles in the development of LSS (Fukuyama et al. Citation1995; Sakamaki et al. Citation2009; Zhang et al. Citation2010). TLF and DFJ can induce a decrease in the central tube volume by compression from the behind the dural sac, which is the cause of LSS (Wessberg and Frennered Citation2017; An et al. Citation2018; Nakashima et al. Citation2019). Therefore, we analyzed the TLF and DFJ between the two groups and found a significant difference for each of these parameters between the positive and negative groups. In addition, The ROC curve result also showed that a positive SedSign was significantly correlated with the grade of DFJ and the TLF. All these demonstrated that a positive SedSign was highly related to risk factors from the posterior spinal canal. This would also explain why there is a different prevalence of a positive SedSign between cases of severe LSS and moderate/mild LSS. The change of compressed dural sac was less in patients with mild-to-moderate LSS, and for whom the MR images rarely show a positive SedSign. However, when the dural sac (nerve roots or the cauda equina) was obviously squeezed from the posterior side and moved sharply toward the center of the spinal canal or ventrally at the level where stenosis occurred, the adjacent unaffected O nerve roots (or the cauda equina) were also pulled to shift to the center of the spinal canal or ventrally, and a positive SedSign was observed in MR images. Barz et al. (Citation2014) reported that a positive SedSign was more common when the epidural pressure was increased in LSS patients, which also indirectly supports our results.
Of course, as LSS develops from complex pathophysiological changes, there are many factors that can decrease the volume of the spinal canal, such as lumbar kyphosis (Jung et al. Citation2018; Park et al. Citation2018), loss of physiological lordosis (Celestre Citation2018), giant central lumbar disc herniation (Ammar et al. Citation2018; Tulloch and Papadopoulos Citation2018), and lateral recess stenosis (Raja et al. Citation2020), and can result in typical clinical symptoms of LSS. Not all LSS cases will show a positive SedSign, which suggests that there are limitations of SedSign determination in clinical practice. In addition, in the current study, we focused only on the distribution of SedSign in patients with severe LSS. The validity of this theory on a wider scale is not currently known. Further study is needed to determine the distribution of a positive SedSign among patients with mild-to-moderate LSS.
Conclusion
In summary, the incidence of a positive SedSign was 85.52% among 290 levels with spinal canal narrowing in 209 patients with severe LSS in this study. The results show that a positive SedSign can be used as a parameter to assist with the diagnosis of severe LSS, along with other criteria. The prevalence of a positive SedSign showed a higher correlation with changes in the compression of the dural sac relative to other imaging parameters. Compression from the posterior spinal canal, such as thickening of the ligamentum flavum and facet joint degeneration, may be the main cause of a positive SedSign.
Author contributions statement
Conception and design of the research: Nan ZHANG and Yunfeng HAN; acquisition of data: Haiming YU, Rui ZHANG, Chu SUN, and Bo YUE; analysis and interpretation of data: Haiming YU, Rui ZHANG, Chu SUN, Bo YUE, Mingda WANG, Kaiping CHOU, and Bin LI; statistical analysis: Yunfeng HAN; drafting the manuscript: Haiming YU; revision of manuscript for important intellectual content: Nan ZHANG. All authors read and approved the final manuscript.
Disclosure statement
No potential conflict of interest was reported by the author(s).
Data availability statement
The data that support the findings of this study are available in https://data.mendeley.com/datasets/w5p4n7rhwy/1.
Additional information
Funding
References
- Alyas F, Connell D, Saifuddin A. 2008. Upright positional MRI of the lumbar spine. Clin Radiol. 63:1035–1048.
- Ammar A, Zarnegar R, Yassari R1, Kinon M. Large central lumbar disc herniation causing acute cauda equina syndrome with loss of evoked potentials during prone positioning for surgery. Surg Neurol Int. 2018; 9:66.
- An SJ, Mun JU, Kang KN, Kim YU. 2018. Superior articular process cross-sectional area is a new sensitive parameter for the diagnosis of lumbar central canal spinal stenosis. Clin Interv Aging. 13:1763–1767.
- Arabmotlagh M, Sellei RM, Vinas-Rios JM, Rauschmann M. 2019. Classification and diagnosis of lumbar spinal stenosis. Orthopade. 48(10):816–823.
- Atlas SJ, Keller RB, Robson D, Deyo RA, Singer DE. 2000. Surgical and nonsurgical management of lumbar spinal stenosis: four-year outcomes from the Maine lumbar spine study. Spine (Phila Pa 1976). 25:556–562.
- Atlas SJ, Keller RB, Wu YA, Deyo RA, Singer DE. 2005. Long-term outcomes of surgical and nonsurgical management of lumbar spinal stenosis: 8 to 10year results from the Maine lumbar spine study. Spine (Phila Pa 1976). 30(8):936–943.
- Barz T, Melloh M, Staub LP, Lord SJ, Lange J, Merk HR. 2014. Increased intraoperative epidural pressure in lumbar spinal stenosis patients with a positive nerve root sedimentation sign. Eur Spine J. 23:985–990.
- Barz T, Melloh M, Staub LP, Lord SJ, Lange J, Röder CP, Theis JC, Merk HR. 2010. Nerve root sedimentation sign:evaluation of a new radiological sign in lumbar spinal stenosis. Spine (Phila Pa 1976). 35(8):892–897.
- Binder DK, Schmidt MH, Weinstein PR. 2002. Lumbar spinal stenosis. Semin Neurol. 22(2):157–165.
- Celestre PC. 2018. Dimar JR 2nd, Glassman SD. Spinopelvic parameters: lumbar lordosis, pelvic incidence, pelvic tilt, and sacral slope: what does a spine surgeon need to know to plan a lumbar deformity correction? Neurosurg Clin N Am. 29(3):323–329.
- Fritz JM, Erhard RE, Delitto A, Welch WC, Nowakowski PE. 1997. Preliminary results of the use of a two-stage treadmill test as a clinical diagnostic tool in the differential diagnosis of lumbar spinal stenosis. J Spinal Disord. 10(5):410–416.
- Fukuyama S, Nakamura T, Ikeda T, Takagi K. 1995. The effect of mechanical stress on hypertrophy of the lumbar ligamentum flavum. J Spinal Disord. 8(2):126–130.
- Haig AJ, Geisser ME, Tong HC, Yamakawa KSJ, Quint DJ, Hoff JT, Anthony Chiodo A, Miner JA, Phalke VV. 2007. Electromyographic and magnetic resonance imaging to predict lumbar stenosis, low back pain, and no back symptoms. J Bone Joint Surg Am. 89:358–366.
- Hamanishi C, Matukura N, Fujita M, Tomihara M, Tanaka S. 1994. Cross-sectional area of the stenotic lumbar dural tube measured from the transverse views of magnetic resonance imaging. J Spinal Disord. 7(5):388–393.
- Hiyama A, Katoh H, Sakai D, Tanaka M, Sato M, Watanabe M. 2019. The correlation analysis between sagittal alignment and cross-sectional area of paraspinal muscle in patients with lumbar spinal stenosis and degenerative spondylolisthesis. BMC Musculoskelet Disord. 20(1):352.
- Jung GS, Chang MC, Seo SW, Lee DG, Kwak SG, Cho HK, Ahn SH. 2018. Transcutaneous neuromuscular electrical stimulation applied to optimal points on the lower abdomen and lumbar paraspinal region changes gait parameters in patients with lumbar degenerative kyphosis. J Back Musculoskelet Rehabil. 31(2):267–274.
- Kalichman L, Li L, Kim DH, Guermazi A, Berkin V, O'Donnell CJ, Hoffmann U, Cole R, Hunter DJ. 2008. Facet joint osteoarthritis and low back pain in the community-based population. Spine (Phila Pa 1976). 33(23):2560–2565.
- Kapural L, Mekhail N, Bena J, McLain R, Tetzlaff J, Miranda Kapural M, Mekhail M, Polk S. 2007. Value of the magnetic resonance imaging in patients with painful lumbar spinal stenosis (LSS) undergoing lumbar epidural steroid injections. Clin J Pain. 23:571–575.
- Karavelioglu E, Kacar E, Gonul Y, Eroglu M, Boyaci MG, Eroglu S, Unlu E, Ulasli AM. 2016. Ligamentum flavum thickening at lumbar spine is associated with facet joint degeneration: An MRI study. J Back Musculoskelet Rehabil. 29(4):771–777.
- Lohman CM, Tallroth K, Kettunen JA, Lindgren KA. 2006. Comparison of radiologic signs and clinical symptoms of spinal stenosis. Spine (Phila Pa 1976). 31(16):1834–1840.
- Macedo LG, Wang Y, Battié MC. 2013. The sedimentation sign for differential diagnosis of lumbar spinal stenosis. Spine (Phila Pa 1976). 38(10):827–831.
- Nakashima H, Kanemura T, Satake K, Ishikawa Y, Ouchida J, Segi N, Yamaguchi H, Imagama S. 2019. Unplanned second-stage decompression for neurological deterioration caused by central canal stenosis after indirect lumbar decompression surgery. Asian Spine J. 584–591.
- Park MS, Moon SH, Kim TH, Oh J, Lee SJ, Chang HG, Shin JH. 2018. Paraspinal muscles of patients with lumbar diseases. J Neurol Surg A Cent Eur Neurosurg. 79(4):323–329.
- Piechota M, Król R, Elias DA, Wawrzynek W, Lekstan A. 2019. The nerve root sedimentation sign in diagnosis of lumbar spinal stenosis. Acta Radiol. 60(5):634–642.
- Raja A, Hoang S, Viswanath O, Herman JA, Mesfin FB. 2020. Spinal stenosis. Stat Pearls Publishing.
- Sakamaki T, Sairyo K, Sakai T, Tamura T, Okada Y, Mikami H. 2009. Measurements of ligamentum flavum thickening at lumbar spine using MRI. Arch Orthop Trauma Surg. 129(10):1415–1419.
- Schizas C, Theumann N, Burn A, Tansey R, Wardlaw D, Smith FW, Kulik G. 2010. Qualitative grading of severity of lumbar spinal stenosis based on the morphology of the dural sac on magnetic resonance images. Spine (Phila Pa 1976). 35(21):1919–1924.
- Sheldom JJ, Russin LA, Gargano FP. 1976. Lumbar spinal stenosis: radiographic diagnosis with special reference totransverseAxial tomography. Clin Orthop. 115:53–67.
- Staub LP, Barz T, Melloh M, Lord SJ, Chatfield M, Bossuyt PM. 2011. Clinical validation study to measure the performance of the nerve root sedimentation sign for the diagnosis of lumbar spinal stenosis. Contemp Clin Trials. 32(3):470–474.
- Tomkins-Lane CC, Quint DJ, Gabriel S, Melloh M, Haig AJ. Nerve root sedimentation sign for the diagnosis of lumbar spinal stenosis: reliability, sensitivity, and specificity. Spine (Phila Pa 1976). 2013;38(24): E1554-E1560.
- Tulloch I, Papadopoulos MC. 2018. Giant central lumbar disc herniations: a case for the transdural approach. Ann R Coll Surg Engl. 100(3):e53–e56.
- Verbiest H. 2001. A radicular syndrome from developmental narrowing of the lumbar vertebral canal. J Bone Joint Surg Br. 384:3–9.
- Weishaupt D, Zanetti M, Boos N, Hodler J. 1999. MR imaging and CT in osteoarthritis of the lumbar facet joints. Skeletal Radiol. 28(4):215–219.
- Wessberg P, Frennered K. 2017. Central lumbar spinal stenosis: natural history of non-surgical patients. Eur Spine J. 26(10):2536–2542.
- Wu L, Cruz R. 2020. Lumbar spinal stenosis. StatPearls Publishing.
- Zhang L, Chen R, Xie P, Zhang W, Yang Y, Rong L. 2015. Diagnostic value of the nerve root sedimentation sign, a radiological sign using magnetic resonance imaging, for detecting lumbar spinal stenosis: a meta-analysis. Skeletal Radiol. 44(4):519–527.
- Zhang Y, Chen J, Zhong ZM, Yang D, Zhu Q. 2010. Is platelet-derived growth factor-BB expression proportional to fibrosis in the hypertrophied lumber ligamentum flavum? Spine (Phila Pa 1976). 35(25):E1479–E1486.