
Abstract
This study aimed to examine metabolites in the plasma derived from postmenopausal women by untargeted metabolomics along with possible diagnostic markers for osteoporosis. From March 2020 through June 2020, 30 postmenopausal women with normal bone mineral density (BMD) were recruited in the N group, 30 postmenopausal women with postmenopausal osteoporosis were recruited in the postmenopausal osteoporosis (PMO) group, and 30 postmenopausal women with rheumatoid arthritis osteoporosis were recruited in the rheumatoid arthritis osteoporosis (RAOP) group. The height, weight, body mass index (BMI), total cholesterol (TC), triglyceride (TG), high-density lipoprotein (HDL), low-density lipoprotein (LDL), lumbar BMD, hip BMD, femoral neck BMD, and plasma metabolite levels were measured. Seven differential metabolites were observed between the PMO and N groups and recorded as metabolite set 1, and 38 differential metabolites were found between the RAOP and N groups and recorded as metabolite set 2. Six same metabolites were found between these two metabolite sets. The area under the curve (AUC) of the combined receiver operating characteristic (ROC) curves for the six metabolites was 0.900. In this study, six metabolites with a diagnostic value for osteoporosis were found in the plasma of postmenopausal women, and the combined diagnosis efficiency of these six metabolites was high.
Key policy highlights
A non-targeted metabolomics approach was used to find common diagnostic targets for postmenopausal osteoporosis and postmenopausal rheumatoid arthritis osteoporosis in this study.
This study was a preliminary exploration of the examination of common diagnostic targets for primary and secondary osteoporosis.
Introduction
As a typical metabolic disease, osteoporosis is the fifth most common disease (Tuo et al. (Citation2020)) with a high incidence and low curative rate (Fang et al. (Citation2020)). Based on its pathogenesis, osteoporosis can be divided into primary and secondary types (Diebo et al. (Citation2020)). Primary osteoporosis could be sub-classified into postmenopausal osteoporosis and senile osteoporosis, whereas secondary osteoporosis is often associated with primary diseases, such as rheumatoid arthritis, and therapies such as hormone application (Zhao et al. (Citation2018)).
The diagnosis of osteoporosis is generally dependent on the determination of bone mineral density (BMD) via dual-energy X-ray absorptiometry. According to the World Health Organization guidelines, patients with a T value of BMD below −2.5 can be diagnosed with osteoporosis (Wang et al. (Citation2019a); Yang et al. (Citation2020)). Metabolomics, which has emerged as an omics technique in systems biology, provides a dynamic overview of metabolic changes occurring during the disease progression by quantifying metabolites in biological samples, such as serum, plasma, urine, and feces (Qi et al. (Citation2016); Wang et al. (Citation2019b)).
Studies examining the correlation between metabolites and BMD have been previously performed mostly aiming at postmenopausal osteoporosis or glucocorticoid osteoporosis (Qi et al. (Citation2016); Malkawi et al. (Citation2018)). To determine the metabolic profile of osteoporosis more comprehensively, we examined the differential plasma metabolites in postmenopausal women with normal BMD, postmenopausal osteoporosis (PMO), and rheumatoid arthritis osteoporosis (RAOP), aiming to find a novel diagnostic target for osteoporosis.
Methods
Subjects
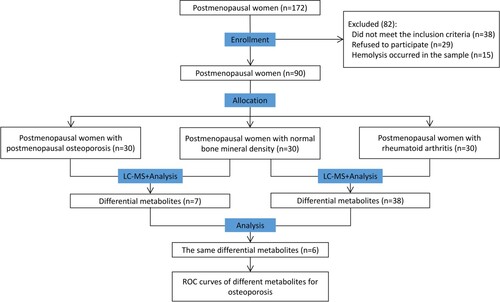
From March 2020 to June 2020, we randomly selected 30 postmenopausal women with normal BMD aged between 50 and 75 years and assigned them to the N group, 30 postmenopausal women with PMO aged between 49 and 73 years to the PMO group, and 30 postmenopausal women with RAOP aged between 50 and 66 years to the RAOP group (Figure ). All recruited subjects provided informed consent. This research was conducted after obtaining approval from the Ethics Committee of the First Affiliated Hospital of Bengbu Medical College (Approval Number: 2020KY041).
Figure 1. Distribution of study participants.
Inclusion and exclusion criteria
Inclusion criteria: (1) postmenopausal women; (2) dual-energy X-ray BMD measurement used to evaluate the lumbar spine and hip (including femoral neck) BMD values; (3) postmenopausal women with osteoporosis and those with RAOP with T values of ≤ −2.5, who were diagnosed with osteoporosis and severe osteoporosis; (4) postmenopausal women with normal BMD (T value ≥ −1).
Exclusion criteria: (1) subjects with severe malabsorption syndrome, enteritis, hyperparathyroidism, chronic infectious arthritis, osteomalacia, and other diseases that may affect bone metabolism or calcium absorption; (2) subjects with severe heart, liver, and kidney diseases, and other conditions such as diabetes, thyroid disease, and hyperlipidemia; (3) subjects who received glucocorticoids, estrogens, androgens, calcitonin, hypoglycemic drugs, statins, and other drugs that may affect bone density within three months before the study; (4) subjects with demonstrated addiction tendency in the past three years, such as fussy diet, excessive consumption of alcohol and caffeine, and smoking.
Blood sample collection
The whole blood samples were supplemented with heparin anticoagulant, rested at room temperature for 30 min (min), and centrifuged for 10 min at 1300 g–2000g. The supernatants were collected, frozen in liquid nitrogen, and stored at −80°C.
BMD measurement
The BMD values of the lumbar spine, femoral neck, and hips were measured by a dual-energy X-ray absorptiometry (Hologic Discovery W, Hologic Inc., Bedford, MA).
Sample extraction
After the samples were thawed at 4 °C, precooled methanol/acetonitrile/aqueous solution (2:2:1, v/v) was added in an appropriate amount to the samples and mixed lightly. These samples were subjected to ultrasonic- and low-temperature extraction for 30 min. Subsequently, the mixtures were rested at −20°C for 10 min and centrifuged at 14000 g for 20 min at a temperature of 4 °C to collect the supernatant, which was then dried in a vacuum. A total of 100 μL of acetonitrile (acetonitrile: water = 1:1, v/v) was mixed well with the supernatant for redissolution, followed by centrifugation at 4 °C for 15 min at a speed of 14000 g to collect the supernatant for mass spectrometry (MS).
Ultra-high performance liquid chromatography–mass spectrometry
The samples were isolated by ultra-high performance liquid chromatography (UHPLC) (Agilent 1290 Infinity LC). Subsequently, samples were placed in an autosampler in random order during the continuous analysis process. At the same time, quality control (QC) samples were inserted into the sample queue to monitor and assess the system stability and data reliability. MS analysis was performed using a mass spectrometer (AB Triple TOF 6600) to obtain the primary and secondary spectra of the samples.
Data and statistical analysis
All metabolites detected in positive and negative ion modes (including unidentified metabolites) were analyzed by univariate analysis (fold change > 1.5 or fold change < 0.67, differential metabolites with p < 0.05 were visualized in the form of volcano plots). The data were processed and inputted into the software SIMCA-P 14.1 (Umetrics, Umea, Sweden) for pattern recognition. After Pareto-scaling preprocessing, the data were analyzed by multidimensional statistical evaluation methods, including unsupervised principal component analysis (PCA), partial-least squares discriminant analysis (PLS-DA), and orthogonal partial-least squares discriminant analysis (OPLS-DA). The comparison between the three groups of differential metabolites was conducted via single-factor ANOVA, and the pairwise comparison was conducted by independent-sample t-test. p < 0.05 indicated statistical significance.
Results
Demographic characteristics of patients
No statistically significant differences were observed in age, menopausal onset, height, weight, body mass index (BMI), levels of total cholesterol (TC), triglyceride (TG), high-density lipoprotein (HDL), and low-density lipoprotein (LDL) among the three groups (p > 0.05). Compared with the N group, the PMO group showed significant differences in lumbar spine BMD and T values, femoral neck BMD and T values, and hip BMD and T values. The values of the aforementioned indices were lower in the PMO group than those in the N group (p < 0.05). Significant differences were also observed between the RAOP and N groups in terms of lumbar spine BMD and T values, femoral neck BMD and T values, and hip BMD and T values, with the values of the aforementioned indexes being lower in the RAOP group than those in the N group (p < 0.05) (Table ).
Table 1. General information of the three groups (X±SD).
Metabolites associated with osteoporosis
A total of 294 metabolites were detected in all samples. A total of 176 metabolites were identified in the positive ion mode and 153 metabolites in the negative ion mode. Metabolites were specifically classified as follows: 117 undefined metabolites; 58 organic acids and derivatives; 51 lipids and lipid-like molecules; 22 organoheterocyclic compounds; 14 organic oxygen compounds; 11 benzenoids; 9 nucleosides, nucleotides, and analogs; 6 organic nitrogen compounds; 2 phenylpropanoids and polyketides; 1 alkaloid and derivative; 1 organonitrogen compound; 1 organooxygen compound; 1 phenylpropanoid and polyketide/alkaloid and derivative (Figure A).
Figure 2. Univariate analysis: A. Classification of differential metabolites. B. The volcano plot of the PMO group vs the N group in positive ion mode. C. The volcano plot of the PMO group vs the N group in negative ion mode. D. The volcano plot of the RAOP group vs the N group in positive ion mode. E. The volcano plot of the RAOP group vs the N group in negative ion mode (Figure E). In B-E, the red circles indicate high expression, and the blue circles indicate low expression.
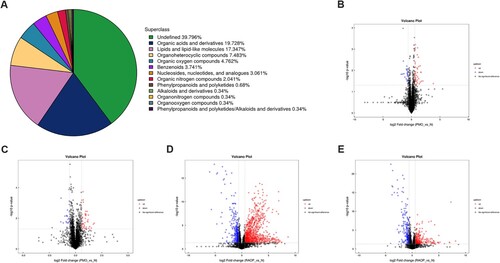
Based on the univariate analysis, all metabolites, including unidentified metabolites detected in positive and negative ion modes, were analyzed. The volcano plots of the PMO group that were compared with those of the N group in positive ion mode (Figure B) and negative ion mode (Figure C) showed that the red circles indicated high expression, and blue circles indicated low expression in the PMO group. The volcano plots of the RAOP group that were compared with those of the N group in positive ion mode (Figure D) and negative ion mode (Figure E) showed that the red circles indicated high expression, and the blue circles indicated low expression in the RAOP group.
Multidimensional statistical analysis
PCA, PLS-DA, and OPLS-DA models were applied to identify the differential metabolites between the PMO and N groups and those between the RAOP and N groups.
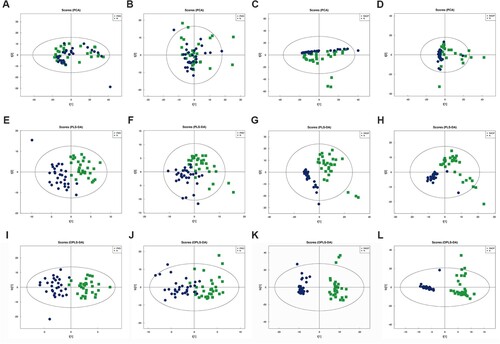
The distribution of metabolites was outlined after PCA. As shown in Figure A/B/C/D, the scatter plot failed to show a clear separation in both modes. The PLS-DA models also did show a clear separation in both modes (Figure E/F/G/H). Next, all samples were included to fit OPLS-DA models (Figure I/J/K/L), and the results showed that the PMO group and RAOP group could be clearly distinguished from the N group.
Figure 3. Multidimensional statistical analysis: A. PCA analysis of the PMO group vs the N group in positive ion mode. B. PCA analysis of the PMO group vs the N group in negative ion mode. C. PCA analysis of the RAOP group vs the N group in positive ion mode. D. PCA analysis of the RAOP group vs the N group in negative ion mode. E. PLS-DA analysis of the PMO group vs the N group in positive ion mode. F. PLS-DA analysis of the PMO group vs the N group in negative ion mode. G. PLS-DA analysis of the RAOP group vs the N group in positive ion mode. H. PLS-DA analysis of the RAOP group vs the N group in negative ion mode. I. OPLS-DA analysis of the PMO group vs the N group in positive ion mode. J. OPLS-DA analysis of the PMO group vs the N group in negative ion mode. K. OPLS-DA analysis of the RAOP group vs the N group in positive ion mode. L. OPLS-DA analysis of the RAOP group vs the N group in negative ion mode.
Differential metabolites between the PMO and N groups and those between the RAOP and N groups and comparison of differential metabolite levels among the three groups
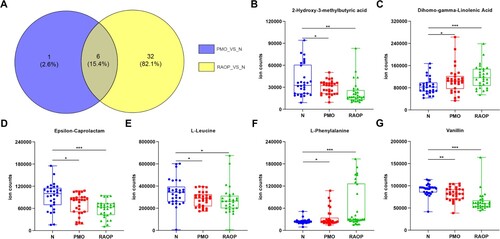
According to the variable importance for the projection (VIP) values obtained upon the application of the OPLS-DA model, three differential metabolites in the positive ion mode and five differential metabolites in the negative ion mode were observed between the PMO and N groups, the sum of which was seven metabolites because one metabolite was repeated in both groups. These metabolites were recorded as the metabolite set 1. A total of 16 differential metabolites in the positive ion mode and 23 differential metabolites in the negative ion mode were detected between the RAOP and N groups, the sum of which was 38 because one metabolite was repeated in both groups. These metabolites were recorded as the metabolite set 2. Ultimately, six metabolites, including 2-hydroxy-3-methyl butyric acid, dihomo-gamma-linolenic acid, epsilon-caprolactam, L-leucine, L-phenylalanine, and vanillin were observed in both metabolite sets 1 and 2.
We also analyzed the quantitative results of six metabolites and found that 2- hydroxy-3-methylbutyric acid, epsilon-caprolactam, L-leucine, and vanillin were highly expressed in the N group, while dihomo-gamma-linolenic acid and phenylalanine showed low expression in the N group (Figure ).
Figure 4. Differential metabolites between the PMO and N groups and those between the RAOP and N groups and comparison of differential metabolite levels among the three groups: A. The Wayne diagram of metabolite set 1 and metabolite set 2. B. Comparison of 2-hydroxy-3-methylbutyric acid levels among the three groups. C. Comparison of dihomo-gamma-linolenic acid levels among the three groups. D. Comparison of epsilon-caprolactam levels among the three groups. E. Comparison of L-leucine levels among the three groups. F. Comparison of L-phenylalanine levels among the three groups. G. Comparison of vanillin levels among the three groups. *p < 0.05, **p < 0.01, ***p < 0.001.
Diagnostic efficacy of six metabolites
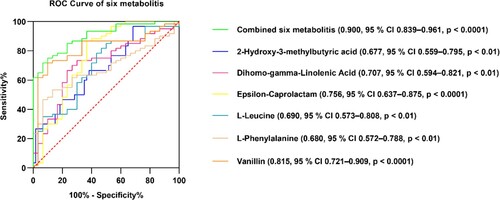
To elucidate the diagnostic efficacy of these six metabolites, the area under the curve (AUC) was calculated by the receiver operator characteristic (ROC) curve analysis, respectively, and the combined diagnostic efficacy of the six metabolites was evaluated by calculating the AUC of the ROC curve. The AUCs in the ROC curves for 2-hydroxy-3-methylbutyric acid, dihomo-gamma-linolenic acid, epsilon-caprolactam, L-leucine, L-phenylalanine, and vanillin were 0.677 (95% CI 0.559–0.795, p < 0.01), 0.707 (95% CI 0.594–0.821, p < 0.01), 0.756 (95% CI 0.637–0.875, p < 0.0001), 0.690 (95% CI 0.573–0.808, p < 0.01), 0.680 (95% CI 0.572–0.788, p < 0.01), 0.815 (95% CI 0.721–0.909, p < 0.0001), respectively. The combined AUC of the ROC curve for the six metabolites was 0.900 (95% CI 0.839–0.961, p < 0.0001) (Figure ).
Figure 5. Diagnostic efficacy of the six metabolites. The ROC curves of 2-hydroxy-3-methyl butyric acid, dihomo-gamma-linolenic acid, epsilon-caprolactam, L-leucine, L-phenylalanine, vanillin, and the six metabolites combined.
Discussion
The purpose of this study was to detect differential plasma metabolites between postmenopausal women with normal BMD and postmenopausal women with PMO, between postmenopausal women with normal BMD and postmenopausal RAOP osteoporosis to determine one or several metabolites as diagnostic targets for PMO and postmenopausal RAOP. A total of six metabolites including 2-hydroxy-3-methyl-butyric acid, epsilon-caprolactam, L-leucine, vanillin, dihomo-gamma-linolenic acid, and L-phenylalanine were found. The combined AUC of the ROC curve of the six metabolites was 0.900 (95% CI 0.839–0.961, p < 0.0001). The combination of these six metabolites showed high diagnostic efficiency. In this study, non-targeted metabolomics was used to find common diagnostic targets for PMO and postmenopausal RAOP, which is a preliminary exploration method to study common diagnostic targets for primary and secondary osteoporosis.
Osteoporosis is correlated with gender, age, BMI, and blood lipid levels (Kan et al. (Citation2021); Niu et al. (Citation2021); Ge et al. (Citation2021)). Currently, the gold diagnosis standard for osteoporosis is dual-energy X-ray bone absorptiometry (Luo et al. (Citation2022)). In this study, no significant differences in age, menopause onset, height, weight, BMI, TC, TG, HDL, and LDL levels were observed among the three groups. Compared with the N group, lumbar spine BMD and T values, femoral neck BMD and T values, and hip BMD and T values in the PMO group were significantly lower than those in the N group. Significantly, the levels of the indicators in the RAOP group were also significantly lower than those in the N group. The metabolomic approach has been applied to the study of diagnostic targets for a variety of diseases. Few studies have been conducted on osteoporosis, and most of these studies have mainly focused on single postmenopausal osteoporosis or glucocorticoid osteoporosis. Takeshi et al. performed a non-targeted metabolic analysis on postmenopausal women with low bone mineral density and normal controls and observed that in the low-bone mineral density group, the levels of gly-gly and cystine were significantly reduced but those of hydroxyproline (a marker of osteoporosis) were remarkably increased (Miyamoto et al. (Citation2017)). Similarly, Qi et al. studied premenopausal women with normal bone density, reduced bone mass, or osteoporosis using GC-MS, and they identified 12 metabolites capable of differentiating low BMD groups from normal BMD groups (Qi et al. (Citation2016)). Sina Pan performed a metabolomic study on a rat model of glucocorticoid osteoporosis using a 1H NMR-based metabonomic technique, and their findings demonstrated that serum lipid and lactate levels were increased in glucocorticoid-induced osteoporosis (GIO) rats, while the levels of creatine/creatinine, phosphatidylcholine/glycerophosphatidylcholine (PC/GPC), taurine, glycine, and glucose were reduced (Pan et al. (Citation2016)). Postmenopausal osteoporosis has the highest incidence rate among all cases of osteoporosis (Chen et al. (Citation2020)), followed by glucocorticoid osteoporosis, which is considered a secondary cause of osteoporosis (Adami and Saag (Citation2019)). GIO could be caused by a wide variety of other primary diseases. Owing to this fact and the intra-group consistency of the study population, patients with osteoporosis who were administered oral glucocorticoid for rheumatoid arthritis were selected (Ferreira et al. (Citation2016)). In the current study, we collected plasma samples from 30 postmenopausal women with normal BMD, 30 postmenopausal women with PMO, and 30 postmenopausal women with RAOP and performed metabolomic analysis. We observed that 2-hydroxy-3-methyl butyric acid, epsilon-caprolactam, L-leucine, and vanillin were highly expressed in the N group, while dihomo-gamma-linolenic acid and L-phenylalanine showed low expression in the N group.
Several human plasma metabolites are used in the diagnosis of osteoporosis (Watanabe et al. (Citation2022)); (Zhang et al. (Citation2021)). The plasma levels of L-leucine in the ovariectomy-induced osteoporosis model of female rats were significantly reduced in a previous non-targeted metabolomics study (Hu et al. (Citation2018)). Chen et al. found that vanillin could inhibit RANKL-induced osteoclast formation and function by activating the mitochondrial-dependent apoptosis signaling pathway (Chen et al. (Citation2018)). Lee et al. investigated the effect of Rubus coreanus vinegar in ovariectomy-induced osteoporosis in female rats and found that plasma phenylalanine levels were increased in the intervention group (Lee et al. (Citation2016)). Furthermore, 2-hydroxy-3-methylbutyric acid, epsilon-caprolactam, and dihomo-gamma-linolenic acid are not associated with osteoporosis, but they have been reported to be associated with other diseases (Loftfield et al. (Citation2021)); (Recber et al. (Citation2020)). In this study, the AUC values were calculated based on the ROC curve of six metabolites individually, and the combined diagnostic efficacy of six metabolites was evaluated by calculating the AUC values of the ROC curve. These six metabolites all showed diagnostic value, and the AUC of the combined ROC curve was 0.900.
This study had certain limitations. The sample size of this study was small. We aim to conduct targeted metabolomics studies with a large sample size in the future. In this study, only women with PMO and RAOP were selected, and hence, all types of osteoporosis were not covered. More osteoporosis types will be included in subsequent studies.
Conclusion
This study preliminarily screened diagnostic biomarkers for PMO and RAOP. A total of six metabolites with diagnostic values for osteoporosis in the plasma of postmenopausal women were found, and the combined diagnosis efficiency of the six metabolites was high.
Acknowledgments
We appreciated the staff members of the Department of Rheumatology, Changhai Hospital, Naval Medical University, Shanghai, China for the recruitment and sample collection of patients in the RAOP group. We also appreciate Shanghai Applied Protein Technology Co., Ltd. for metabolite detection work for us. We would like to thank Bullet Edits Limited for the linguistic editing and proofreading of the manuscript.
Author contributions
JZG, CCZ, and JG designed this work. JZ, KZ, and SFZ collected and analyzed data for the work and were responsible for drafting and revising the work. All of the authors approved the version to be published and agreed to be accountable for all aspects of the work.
Availability of data and material
All data generated or analyzed during this study have been included in the ScienceDB at http://doi.org/10.57760/sciencedb.01868.
Disclosure statement
No potential conflict of interest was reported by the author(s).
Ethics approval and consent to participate
The experimental protocol was established, according to the ethical guidelines of the Helsinki Declaration and was approved by the Ethics Committee of Bengbu Medical College (Approval Number: 2020KY041). Written informed consent was obtained from individual or guardian participants.
Additional information
Funding
References
- Adami G, Saag KG. 2019. Glucocorticoid-induced osteoporosis: 2019 concise clinical review. Osteoporos Int. 30:1145–1156.
- Chen G, Liu H, Wu X, Wang X, Liang J, Xu Y. 2020. Biomarkers of postmenopausal osteoporosis and interventive mechanism of catgut embedding in acupoints. Medicine (Baltimore). 99:e22178.
- Chen Y, Dou CE, Yi J, Tang R, Yu T, Zhou L, Luo W, Liang M, Yin X, Li J, Kang F, et al. 2018. Inhibitory effect of vanillin on RANKL-induced osteoclast formation and function through activating mitochondrial-dependent apoptosis signaling pathway. Life Sci. 208:305–314.
- Diebo BG, Sheikh B, Freilich M, Shah NV, Redfern JA, Tarabichi S, Shepherd EM, Lafage R, Passias PG, Najjar S, Schwab FJ. 2020. Osteoporosis and spine surgery: a critical analysis review. JBJS Rev. 8:e0160.
- Fang PZ, Chen YM, Chen JL, Sun JH, Tan JS, Wang RR, Wang X. 2020. What factors affect the methodological and reporting quality of clinical practice guidelines for osteoporosis? Protocol for a systematic review. Medicine (Baltimore). 99:e21811.
- Ferreira JF, Ahmed Mohamed AA, Emery P. 2016. Glucocorticoids and rheumatoid arthritis. Rheum Dis Clin North Am. 42:33–46. vii.
- Ge B, Lu SQ, Lei SF. 2021. The obesity indices mediate the relationships of blood lipids and bone mineral density in Chinese elders. Mol Cell Probes. 56:101705.
- Hu Y, Zhang X, Shan Y. 2018. LC-MS-based plasma metabolomics reveals metabolic variations in ovariectomy-induced osteoporosis in female Wistar rats. RSC Adv. 8:24932–24941.
- Kan B, Zhao Q, Wang L, Xue S, Cai H, Yang S. 2021. Association between lipid biomarkers and osteoporosis: a cross-sectional study. BMC Musculoskelet Disord. 22:759.
- Lee MY, Kim HY, Singh D, Yeo SH, Baek SY, Park YK, Lee CH. 2016. Metabolite profiling reveals the effect of dietary rubus coreanus vinegar on ovariectomy-induced osteoporosis in a Rat model. Molecules. 21:149.
- Loftfield E, Stepien M, Viallon V, Trijsburg L, Rothwell JA, Robinot N, Biessy C, Bergdahl IA, Bodén S, Schulze MB, Bergman M, et al. 2021. Novel biomarkers of habitual alcohol intake and associations with risk of pancreatic and liver cancers and liver disease mortality. J Natl Cancer Inst. 113:1542–1550.
- Luo W, Chen Z, Zhang Q, Lei B, Chen Z, Fu Y, Guo P, Li C, Ma T, Liu J, Ding Y, et al. 2022. Osteoporosis diagnostic model using a multichannel convolutional neural network based on quantitative ultrasound radiofrequency signal. Ultrasound Med Biol. 48:1590–1601.
- Malkawi AK, Alzoubi KH, Jacob M, Matic G, Ali A, Al Faraj A, Almuhanna F, Dasouki M, Abdel Rahman AM. 2018. Metabolomics based profiling of dexamethasone side effects in rats. Front Pharmacol. 9:46.
- Miyamoto T, Hirayama A, Sato Y, Koboyashi T, Katsuyama E, Kanagawa H, Miyamoto H, Mori T, Yoshida S, Fujie A, Morita M, et al. 2017. A serum metabolomics-based profile in low bone mineral density postmenopausal women. Bone. 95:1–4.
- Niu P, Li H, Liu D, Zhang YF, Liu Y, Liang C. 2021. Association between HDL-C and bone mineral density: an cross-sectional analysis. Int J Gen Med. 14:8863–8872.
- Pan S, Chen A, Han Z, Wang Y, Lu X, Yang Y. 2016. (1)H NMR-based metabonomic study on the effects of epimedium on glucocorticoid-induced osteoporosis. J Chromatogr B Analyt Technol Biomed Life Sci. 1038:118–126.
- Qi H, Bao J, An G, Ouyang G, Zhang P, Wang C, Ying H, Ouyang P, Ma B, Zhang Q. 2016. Association between the metabolome and bone mineral density in pre- and post-menopausal Chinese women using GC-MS. Mol BioSyst. 12:2265–2275.
- Recber T, Orgul G, Aydin E, Tanacan A, Nemutlu E, Kir S, Beksac MS. 2020. Metabolic infrastructure of pregnant women with methylenetetrahydrofolate reductase polymorphisms: a metabolomic analysis. Biomed Chromatogr. 34:e4842.
- Tuo XM, Zhu DL, Chen XF, Rong Y, Guo Y, Yang TL. 2020. The osteoporosis susceptible SNP rs4325274 remotely regulates the SOX6 gene through enhancers. Yi Chuan. 42:889–897.
- Wang J, Yan D, Zhao A, Hou X, Zheng X, Chen P, Bao Y, Jia W, Hu C, Zhang ZL, Jia W, et al. 2019a. Discovery of potential biomarkers for osteoporosis using LC-MS/MS metabolomic methods. Osteoporos Int. 30:1491–1499.
- Wang Y, Ma L, Zhang M, Chen M, Li P, He C, Yan C, Wan JB. 2019b. A simple method for peak alignment using relative retention time related to an inherent peak in liquid chromatography-mass spectrometry-based metabolomics. J Chromatogr Sci. 57:9–16.
- Watanabe K, Iida M, Harada S, Kato S, Kuwabara K, Kurihara A, Takeuchi A, Sugiyama D, Okamura T, Suzuki A, Amano K, et al. 2022. Metabolic profiling of charged metabolites in association with menopausal status in Japanese community-dwelling midlife women: tsuruoka metabolomic cohort study. Maturitas. 155:54–62.
- Yang TL, Shen H, Liu A, Dong SS, Zhang L, Deng FY, Zhao Q, Deng HW. 2020. A road map for understanding molecular and genetic determinants of osteoporosis. Nat Rev Endocrinol. 16:91–103.
- Zhang X, Xu H, Li GH, Long MT, Cheung CL, Vasan RS, Hsu YH, Kiel DP, Liu CT. 2021. Metabolomics insights into osteoporosis through association With bone mineral density. J Bone Miner Res. 36:729–738.
- Zhao Q, Shen H, Su KJ, Zhang JG, Tian Q, Zhao LJ, Qiu C, Zhang Q, Garrett TJ, Liu J, Deng HW. 2018. Metabolomic profiles associated with bone mineral density in US Caucasian women. Nutr Metab (Lond). 15:57.