
Abstract
Background: The ulcerative colitis (UC) associated immune cell network was revealed by analyzing the immune cell composition of inflamed and uninflamed mucosal biopsy samples from the same patients with UC. For differentially expressed macrophages, the differentially expressed genes (DEGs), functional enrichment analyses, and protein–protein interaction (PPI) network was analyzed to understand further the role of macrophages in the occurrence and development of disease.
Methods: GSE 179285 dataset and GSE123141 dataset were downloaded from the GEO database. We used the CIBERSORT algorithm to map immune cell infiltration between paired inflamed and uninflamed intestinal mucosal biopsies. GO and KEGG functional enrichment analyses were used to analyze DEGs in intestinal macrophage populations. The PPI network was constructed by the Search Tool for the Retrieval of Interacting Genes (STRING) database. Immunohistochemistry and qPCR were used to verify hub genes in the mouse model of UC.
Results: The inflamed tissues had a higher infiltration of M1 macrophages and M0 macrophages. M2 macrophages, naive B cells, gamma delta T cells (γδT cells), and resting mast cells were more abundant in uninflamed tissues. Functional enrichment analyses showed that the 141 DEGs are involved in multiple processes in the inflammatory response. The three genes (LCN2, CXCL1, SAA1) had the highest degrees of connectivity and may be hub genes. LCN2 was significantly overexpressed in colitis tissues compared with normal control tissues in the mouse model of UC.
Conclusion: Changes in macrophages were notable in the inflamed mucosa of UC patients. 141 DEGs were entered into GO and KEGG functional enrichment analyses; three hub gene candidates were selected.
Highlights:
There were significant differences in the distribution of macrophages in the inflamed and uninflamed mucosa of UC patients.
Functional enrichment analyses of DEGs in UC-associated intestinal macrophages were displayed.
Three genes (LCN2, CXCL1, SAA1) were identified as hub gene candidates.
Introduction
Ulcerative colitis (UC) is a chronic, nonspecific inflammatory bowel disease of unknown etiology. Common clinical symptoms are persistent or recurrent diarrhea, bloody mucopurulent stool accompanied by abdominal pain, and systemic symptoms of varying degrees. The incidence of UC varies geographically: data from 2011 showed the annual incidence of UC was about 24.3/100,000 person-years in Europe, 6.3/100,000 person-years in Asia and the Middle East, and 19.2/100,000 person-years in North America (Molodecky et al. Citation2012). Now the incidence of UC is rising globally, which has caused a great burden on patients’ physical health and mental status (Kaplan Citation2015; Kaplan and Windsor Citation2021). As more and more healthcare costs are invested in UC, it is urgent to understand the etiology and formulate management measures.
Dextran sulfate sodium (DSS)-induced colitis in mice is the most commonly used animal model of UC. As early as 1990, Okayasu established stable acute and chronic UC models in mice by giving drinking water containing 3–10% DSS (Okayasu et al. Citation1990). Since then, the model has been widely used to study intestinal flora, mucosal barrier, inflammatory status, and immune regulation in the context of UC (Gancarcikova et al. Citation2020; Sinha et al. Citation2022; Xu et al. Citation2020; Yang et al. Citation2022).
Genetic susceptibility, external environment, internal gut microbiota, and host immune response are thought to be associated with the pathogenesis of UC (Kobayashi et al. Citation2020; Ordas et al. Citation2012). With the deepening understanding of immune factors, immune cells, inflammatory signaling pathways, and key inflammatory molecules have been gradually explored. Macrophages, one of the most important immune cells in innate immunity, can produce various cytokines, soluble mediators and prevent excessive inflammatory response, and also play an important role in establishing and maintaining intestinal homeostasis (De Schepper et al. Citation2018). Previous studies revealed that the infiltration of M0 and M1 macrophages was increased and M2 macrophages were decreased in UC patients compared with normal samples (Xue et al. Citation2021). However, there is no data analysis of inflamed and uninflamed mucosal specimens in UC patients. This study aimed to show the immune cell infiltration map in inflamed intestinal mucosa of UC patients. DEGs were searched for the differentially distributed intestinal macrophages; functional enrichment analysis and PPI network contributed to explore the molecular mechanisms and hub genes.
Materials and methods
Microarray data
We used ‘ulcerative colitis’ or ‘UC’ as [MeSH Terms], filtration conditions were: ‘series’, ‘homo sapiens’ and ‘tissue’. Data on inflamed and uninflamed intestinal mucosa from the same UC patients was selected one by one. The microarray dataset GSE179285 was downloaded from Gene Expression Omnibus (GEO: https://www.ncbi.nlm.nih.gov/geo/). Then we used ‘ulcerative colitis’ and ‘macrophage’ as [MeSH Terms] to obtain GSE123141 from the GEO database. Platforms files, series matrix files, and supplementary files were downloaded for further analysis.
Immune cell infiltration map and analysis
The sample and probe data of GSE179285 were organized into matrices using Perl software. Based on standardized gene expression information, CIBERSORT obtained tissue immune cell composition through a deconvolution algorithm. R software (version 4.1.2) visualized 22 kinds of immune cell infiltration in the samples. ‘e1071’, ‘parallel’, ‘preprocessCore’, ‘pheatmap’, ‘corrplot’ and ‘vioplot’ packages needed to be installed.
Identification of differentially expressed genes
The DEGs in intestinal macrophages between UC patients and healthy controls were detected by R software according to the inclusion criteria of adjusted p-value < 0.05 and |logFC| > 2.0. ‘BiocManager’, ‘limma’ and ‘pheatmap’ packages were used to identify and visualize the differentially expressed genes.
Gene ontology (GO) and Kyoto encyclopedia of genes and genomes (KEGG) enrichment analysis
GO is a foundation for computational analysis of molecular biology and genetics experiments in biomedical research. We used this tool to understand the function of genes in three aspects: biological process (BP), cellular component (CC), and molecular function (MF). KEGG is the most common database for understanding high-level functions, molecular interaction, and relation networks. We used KEGG to understand biological pathways of DEGs. ‘clusterProfiler’, ‘org.Hs.eg.db’, ‘enrichplot’, ‘ggplot2’, ‘colorspace’, ‘stringi’ packages were installed in R software.
PPI network and hub gene candidates
The Search Tool for the Retrieval of Interacting Genes (STRING version: 11.5; https://cn.string-db.org/) was used to construct a PPI network of DEGs with interaction score ≥0.4. ‘string_interactions. tsv’ file was downloaded from this database and R software was used to analyze the number of adjacent nodes. Genes with adjacent nodes more than 25 and in the top 5% of the total number of genes were defined as hub gene candidates.
Animal experiments
We purchased six-week-old male C57BL/6J wild-type mice weighing 18–22 g from SPF (Beijing) BIOTECHNOLOGY Co., Ltd. To provide three biological replicates and in reference to previous literature (Deng et al. Citation2021; Ju et al. Citation2013), we limited the number of experimental animals to five in each group. Ten mice were randomly divided into a colitis group and control group (the RAND function in EXCEL was used for random numbering), with five mice in each group (five mice per cage, mice in the same group lived in the same cage). Mice in the colitis group freely drank distilled water containing 3% DSS for 7 days to create a UC mouse model, and the control group was allowed free access to normal drinking water. All mice ate common laboratory feed, and they were housed in a specific-pathogen-free environment at 25°C with 12-hour light–dark cycles. After 7 days, mice were euthanized (carbon dioxide inhalation), and colon tissues were retained for follow-up experiments. The experiment protocol complied with the ARRIVE guidelines 2.0. No experimental animals were excluded. The welfare of experimental animals was strictly guaranteed during the whole experiment process. This study was approved by the Ethics Committee of Beijing Friendship Hospital, Capital Medical University (IACUC ID: 22-2001).
Immunohistochemistry
A standard immunohistochemistry protocol was used in formalin-fixed sections of colon tissue, the primary antibodies against LCN2 (abcam, ab216462, 1:1000), CXCL1 (proteintech, 12335-1-AP, 1:100) and SAA1 (abcam, ab199030, 1:2000) were incubated overnight at 4°C. Then the sections were washed three times in PBS and incubated with a peroxidase-conjugated secondary antibody for 60 min. We evaluated immunostaining by multiplying the intensity score and proportion score. Intensity score according to the intensity of cell staining: 0 for no positive staining (negative), 1 for light yellow (weakly positive), 2 for brown (positive) and 3 for dark brown (strongly positive). Proportion score according to the percentage of positive cells: 1 for ≤ 25%, 2 for 26%−50%, 3 for 51%−75% and 4 points for > 75%. Histological scoring of each mouse was blindly examined by two pathologists.
qPCR analysis
Tissue RNA was isolated from fresh mouse colon sample by Trizol reagent. Total RNA (1 µg) was reverse-transcribed using a reverse transcriptase kit (TakaRa, cat. RR036A-1, Tokyo, Japan). Hieff® qPCR SYBR Green Master Mix (Yeasen Biotechnolog, cat. 11201ES03, Shanghai, China) was used for real-time qPCR. The comparative cycle threshold (Ct) method (2−ΔΔCT) was used to calculate relative expression; β-actin and GAPDH were used as the internal reference. The primers were listed as follows: LCN2 (F: 5’-GCAGGTGGTACGTTGTGGG-3’ R: 5’-CTCTTGTAGCTCATAGATGGTGC-3’), CXCL1 (F: 5’- CTGGGATTCACCTCAAGAACATC-3’ R: 5’- CAGGGTCAAGGCAAGCCTC-3’), SAA1 (F: 5’-GCTGACCAGGAAGCCAACAG-3’ R: 5’- GAGCTAATAGGAGGACGCTCAGT-3’), β-actin (F: 5’-GGCTGTATTCCCCTCCATCG-3’ R: 5’-CCAGTTGGTAACAATGCCATGT-3’), GAPDH (F: 5’-AGGTCGGTGTGAACGGATTTG-3’ R: 5’-GGGGTCGTTGATGGCAACA-3’)
Statistical analysis
Statistical analyses were performed on R (version 4.1.2) and GraphPad Prism 9.0 software. Non-parametric tests were applied in the bioinformatics analyses. Independent t-test was used to test the differences between control and UC groups. The Pearson correlation coefficient assessed correlations. The P values of paired analyses were obtained by the Wilcoxon test. P value < 0.05 was accepted as statistically different.
Results
Immune cell infiltration analysis
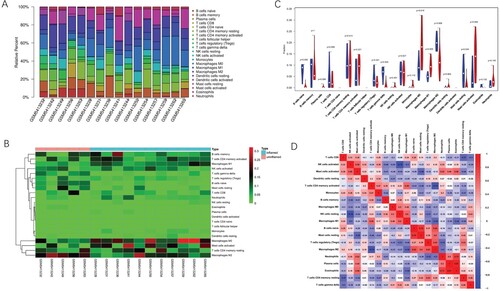
GPL6480 platform data, sample matrix data, and sample information data of GSE179285 were downloaded from the GEO database. Perl language and the CIBERSORT algorithm were used to analyze immune cell infiltration in the mucosal specimens. Five uninflamed and eleven inflamed samples were obtained with P < 0.05 as filter criteria. The composition of 22 immune cells in 16 samples was revealed (Figure (A)). Further, the heat map (Figure (B)) and violin plot (Figure (C)) demonstrated differences in the composition of immune cells between uninflamed and inflamed samples. The inflamed tissues had a higher infiltration of M1 macrophages and M0 macrophages. M2 macrophages, naive B cells, gamma delta T cells, and resting mast cells were more abundant in uninflamed tissues. In inflamed mucosa of UC patients, the correlation coefficient between eosinophils and plasma cells was the highest. Moreover, there was a significant negative correlation between M2 macrophages and activated memory CD4+ T cells, with a correlation coefficient of −0.74 (Figure (D)).
Figure 1. Immune infiltrate landscape of inflamed and uninflamed colitis samples. (A) The bar chart summarizes the percentage of 22 infiltrated immune cells in each sample. (B) Heat map of uninflamed and inflamed UC samples based on immune cell proportions; red, black, and green indicates high, moderate, and low proportions of immune cells, respectively. (C) Differences in the composition of each immune cell type in uninflamed and inflamed UC samples; red represents inflamed samples and blue represents uninflamed samples. (D) Correlation matrix of 22 infiltrating immune cells in the inflamed samples; red represents a positive correlation, blue represents a negative correlation and white represents no correlation between two kinds of cells.
Paired analysis and principal component analysis
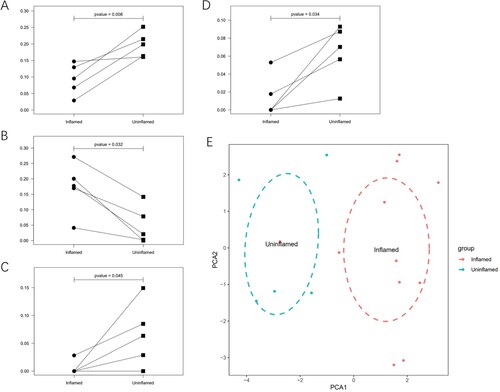
The above 16 samples contained five pairs of samples. Compared to the uninflamed group, inflamed mucosa from the same UC patient was characterized by the down-regulation of M2 macrophages, resting mast cells, and gamma delta T cells. Nevertheless, activated mast cells were more abundant in the inflamed group (Figure (A–D)). Principal component analysis (PCA) (Figure (E)) showed that the 22 types of immune cells were able to distinguish inflamed and uninflamed samples clearly.
Figure 2. Paired analysis and principal component analysis. (A) M2 macrophages are compared in inflamed and uninflamed mucosa from the same patient. The P values were obtained by the Wilcoxon test. (B) Activated mast cells are compared in inflamed and uninflamed mucosa from the same patient. (C) Resting mast cells are compared in inflamed and uninflamed mucosa from the same patient. (D) Gamma delta T cells are compared in inflamed and uninflamed mucosa from the same patient. (E) PCA results show that the immune cell infiltration analysis can distinguish the inflamed tissues from uninflamed tissues.
DEGs identification of macrophages in UC
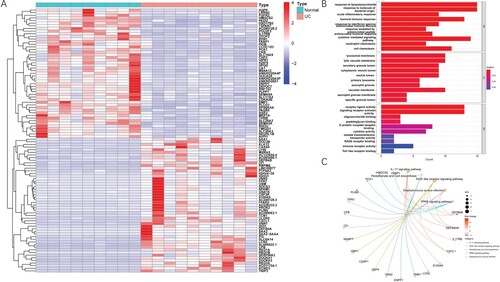
There were significant differences in the distribution of macrophages in the inflamed and uninflamed intestinal mucosa of UC patients, so we analyzed the mRNA expression of intestinal macrophage population in 19 samples from two groups: healthy donors and UC patients. According to the cutoff criteria of ∣log fold change (FC)∣ > 2.0 and adjusted P-value < 0.05, 141 DEGs in GSE123141 were found. We made a heat map (Figure (A)) to visualize the top 50 genes. In the inflamed group, 92 upregulated and 49 downregulated DEGs were identified (Supplementary Table S1).
Figure 3. Identification of DEGs and functional enrichment analysis. (A) Heat map of DEGs. Red represents up-regulation genes, blue represents down-regulation genes in the intestinal macrophage population between healthy donors and UC patients. (B) Top 30 clusters DEGs in GO. (C) Top 30 clusters DEGs in KEGG.
GO and KEGG analysis of DEGs
To explore the enrichment of 141 DEGs in function and signaling pathways, GO and KEGG functional enrichment analyses were performed (Figure (B,C)). The GO annotation has three categories: biological process (BP), cellular component (CC), and molecular function (MF). In the BP category, DEGs were enriched in ‘response to lipopolysaccharide’, ‘response to molecule of bacterial origin’, ‘acute inflammatory response’ and ‘humoral immune response’. The CC category showed that DEGs enriched in ‘lysosomal membrane’, ‘lytic vacuole membrane’, ‘secretory granule lumen’, and ‘cytoplasmic vesicle lumen’. In the MF category, the top four enriched items were ‘receptor ligand activity’, ‘signaling receptor activator activity’, ‘oligosaccharide binding’ and ‘peptidoglycan binding’. KEGG pathway analysis indicated that the DEGs were mainly associated with four pathways: ‘IL-17 signaling pathway’, ‘pantothenate and CoA biosynthesis’, ‘NOD-like receptor signaling pathway’ and ‘Staphylococcus aureus infection’.
Protein–protein interaction (PPI) analysis and hub gene candidates
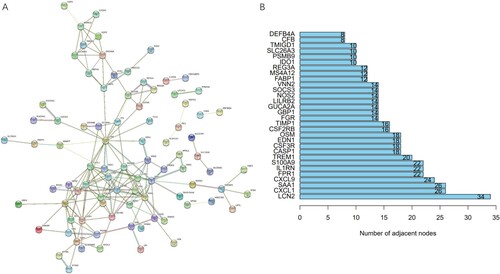
To better understand the interaction between DEGs, we used the STRING database (https://cn.string-db.org/) to establish the PPI network. We inputted 141 DEGs into the STRING database with the cutoff criteria of interaction score ≥ 0.4. The results showed that 87 genes involved 124 nodes and 173 edges (Figure (A)). The three genes (LCN2, CXCL1, SAA1) with the most nodes were selected as candidates for the hub genes (Figure (B)). The gene count of 5/44 was related to acute-phase response; 7/74 genes connected with acute inflammatory response; and the antimicrobial humoral immune response mediated by antimicrobial peptide gene count was 8/133 (Supplementary Table S2). Meanwhile, the three most correlated signal pathways were ‘interleukin-4 and interleukin-13 signaling’, ‘type II interferon signaling’ and ‘vitamin B12 metabolism’. The number of genes was 7/107, 6/36, and 5/50, respectively. (Supplementary Table S3-4).
Figure 4. Identification of hub gene candidates and PPI network. (A) The interaction network of DEGs is plotted, disconnected nodes are hidden. (B) The number of adjacent nodes of the top 30 genes.
Verification of hub gene candidates
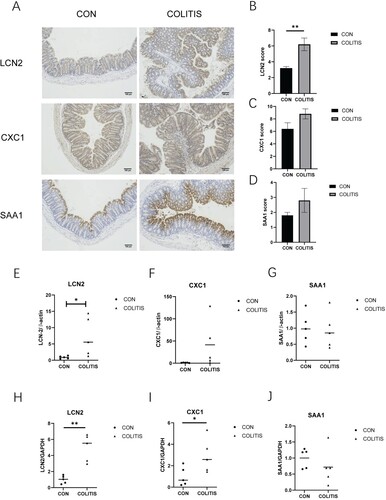
We used mouse colitis tissue for immunohistochemistry to understand the expression level of hub gene candidates. LCN2, CXCL1 and SAA1 were highly expressed in UC tissue (Figure (A)). But only the expression level of LCN2 was statistically significant between the colitis group and control group (Figure (B–D)). In addition, we verified the transcription level of these three genes using two housekeeping genes and obtained the same results as immunohistochemistry (Figure (E–J)).
Figure 5. The expression of hub gene candidates in mouse colitis tissue. (A) Immunohistochemical staining with LCN2, CXCL1 and SAA1; scale label is 100 μm. (B–D) Immunohistochemical score of three hub gene candidates. (E–G) The expression levels of LCN2, CXCL1, and SAA1 were relative to β-actin. (H–J) The expression levels of LCN2, CXCL1, and SAA1 were relative to GAPDH. Data are presented as mean ± SEM (n = 5 in each group), **p < 0.01, unpaired t-test was used.
Discussion
Currently, we do not know the characteristics and differences of the genomes between inflamed and uninflamed intestinal mucosa of UC patients. This study showed the map of inflammatory cell infiltration by analyzing the gene matrix of paired intestinal mucosa biopsy specimens in UC patients. We found that there were significant differences in the distribution of 22 types of immune cells between inflammatory and non-inflammatory specimens of UC patients. The PCA could distinguish the two types of samples clearly. Among these differential immune cells, the changes in macrophages were most remarkable, showing that M0 and M1 macrophages were up-regulated in inflammatory mucosa, while M2 macrophages were down-regulated. There are abundant macrophages in the lamina propria of the gastrointestinal mucosa. Macrophages are stimulated by pathogen-associated molecular patterns (PAMPs) through TLRs and polarized toward the M1 phenotype, which shows us increased secretion of pro-inflammatory cytokines and enhanced cytotoxicity and phagocytosis (Satoh, and Akira Citation2016; Tatiya-Aphiradee et al. Citation2018). Cytokines secreted by Th2 cells (such as IL-4 and IL-13) promote the transformation of macrophages into the M2 phenotype. M2 macrophages down-regulate immune response by secreting angiogenic factors and anti-inflammatory cytokines (such as IL-10 and TGF-β) and play a role in promoting tumor progression, repairing damaged tissues, and inhibiting inflammation (Wang et al. Citation2019). Recent studies have shown that modulating the polarization of M1 macrophages toward M2 macrophages can alleviate UC; inhibiting M1 macrophage polarization by a drug can reduce the level of inflammatory factors and ameliorate DSS-induced acute colitis (He et al. Citation2019; Lv et al. Citation2021; Xu et al. Citation2019; Zhuang et al. Citation2021). γδT cell is a unique type of T cell, which is abundant in the skin, lungs, and intestine. It plays an essential role in intestine immune surveillance and intestinal homeostasis. Meanwhile, γδT cell can kill tumor cells, showing potential therapeutic value in neoplastic diseases (Nielsen et al. Citation2017; Ribot et al. Citation2021; Sebestyen et al. Citation2020). Our study showed the infiltration of γδT cells in inflamed samples was significantly less than that in uninflamed specimens. Different states of γδT cells or subpopulations may be differentially enriched in UC patients compared with healthy controls; compared to stable colitis, exacerbation of UC results in a decreasing trend of γδT cells in peripheral blood with an increase of CD25, CD54, and CD62L expression (Boland et al. Citation2020; Gryglewski et al. Citation2021). In conclusion, significant differences in γδT cell distribution were found between healthy people and UC patients, between UC inflammatory mucosa and non-inflammatory mucosa, and in patients with different degrees of UC, providing new evidence for the identification of immune cell characteristics of UC. Regarding the number of B cells and their markers, the children with UC had a more significant proportion of CD23 + B cells and a lower proportion of CD5+ B cells compared with healthy controls (Rabe et al. Citation2019). Compared with the adult UC patients, higher percentages of naive B cells and lower percentages of memory B cells in pediatric UC patients were identified (Xiu et al. Citation2021). Our study revealed that the proportion of naive B cells in the inflammatory mucosa of UC patients was lower than that of non-inflammatory mucosa. Therefore, it is reasonable to assume that differential expression of B cells is indicative in UC patients.
Later, an in-depth analysis of the mRNA expression of UC-associated intestinal macrophages was performed. First, we found 141DEGs from the GSE123141 dataset by analyzing transcriptomes. Then we conducted GO and KEGG enrichment analysis for the DEGs, and the results showed the differentially expressed genes were mainly related to inflammatory, immune response, membrane structure, and cell signal transduction. The interactions between DEGs were plotted using the STRING database to map PPI networks. We defined three hub gene candidates with more than 25 junctions. The three hub gene candidates were LCN2, CXCL1, and SAA1.
Lipocalin-2 (LCN2) is a member of the lipocalin family and known to be expressed in neutrophils, macrophages, and epithelial cells. In autoimmune diseases, LCN2 regulates cellular immunity and inflammatory responses. According to a recent study, lipocalin-2 was highly expressed in CD4+ T cells and could promote Th1 cell differentiation through the IL-12-STAT4 axis, aggravating nephritis injury in lupus mice (Chen et al. Citation2020). LCN2 is involved in neuropathophysiological processes in various central nervous system (CNS) diseases, including exacerbation of neuroinflammation, cell death, and iron dysregulation; it may be a protective factor in the CNS under inflammatory conditions (Dekens et al. Citation2021; Kang et al. Citation2018). LCN2 is up-regulated in inflammatory bowel disease patients and animal models, which can enhance bacterial phagocytosis of macrophages, regulate intestinal microbiota, and maintain iron homeostasis, playing a protective role (Xiao et al. Citation2017).
Chemokine (C-X-C motif) ligand 1(CXCL1) has the chemotactic activity of neutrophils, which plays a vital role in infectious diseases, tumor genesis, and metastasis (Acharyya et al. Citation2012; Liu et al. Citation2019; Paudel et al. Citation2019). When inflammation occurs, mast cells release chemokines CXCL1/CXCL2 to initiate the early stages of neutrophil recruitment; after reaching the stimulated tissue, neutrophils infiltrate further in a macrophage-dependent manner (De Filippo et al. Citation2013). In DSS-induced UC mouse models, PTGER4 macrophages trigger the secretion of CXCL1, driving the differentiation and proliferation of regenerated crypt into epithelial cells to improve intestinal barrier function (Na et al. Citation2021).
Serum amyloid A (SAA) is a marker of many inflammatory diseases. In biopsies of UC patients, SAA1/2 is significantly expressed in inflammatory epithelial and lamina propria cells, not in adjacent non-inflammatory areas or normal mucosa (Okahara et al. Citation2005; Zhang et al. Citation2020). SAAs in serum promote the differentiation of pathogenic Th17 cells, and local expression of SAA enhances the pathogenicity of activated Th17 cells (Lee et al. Citation2020).
In our study, only LCN2 was significantly overexpressed in colitis tissues compared to normal control tissues. However, CXCL1 and SAA1 expression levels showed no statistical difference between control group and colitis group, which may have to do with individual differences in animal models because we took a free-drinking approach to modeling. In addition, due to the lack of tissue specimens from patients with UC, we adopted mouse colitis tissue for the validation experiment, which may not be entirely consistent with the database analysis results. In the future, we can use gavage to ensure the consistent drug intake, and further evidence may be provided by using patients’ colitis tissue.
In conclusion, we investigated immune cell infiltration characteristics in inflamed and uninflamed intestinal mucosa in patients with UC. Significant differences existed in the expression of macrophages, naive B cells, and γδT cells between the inflammatory and non-inflammatory regions. Aiming at the intestinal macrophage population of UC patients, we found 141 DEGs, and three genes (LCN2, CXCL1, SAA1) with the highest connection degree were selected as the candidates of hub genes. Immunohistochemical staining showed that LCN2 expression in colitis tissues was significantly higher than that in normal control group. In functional enrichment analysis, we knew that DEGs were mainly related to inflammatory, immune response, membrane structure, and cell signal transduction. They principally enriched in the following four pathways: ‘IL-17 signaling pathway’, ‘pantothenate and CoA biosynthesis’, ‘NOD-like receptor signaling pathway’ and ‘Staphylococcus aureus infection’. Although paired samples were analyzed in this study, there were still some limitations. The sample size was small, and the mechanism of remission of UC deserved further investigation. In the future, we can verify the genes and pathways involved in this study and explore the role of macrophages in active UC.
Ethical approval statement
The experiment of this study was conducted in accordance with the Laboratory Animal Management Regulations of the People’s Republic of China. This study was approved by the Ethics Committee of Beijing Friendship Hospital, Capital Medical University (IACUC ID: 22-2001).
Author contributions statement
Yiqiu Peng, Ruixia Liu, Yingyi Luan, and Chenghong Yin were involved in the entire conception, study design, data acquisition, and analysis. Zilu Cui, Yingying Li, and Yuxi Yang were involved in animal experiments and data analysis. Yiqiu Peng and Zilu Cui wrote the manuscript. Ruixia Liu, Yingyi Luan, and Chenghong Yin contributed to the project's supervision and completed the paper's review and revision. All authors read and approved the final manuscript to be published and agreed to be accountable for all aspects of the work.
Supplemental Material
Download MS Word (52.4 KB)Acknowledgements
We are grateful to all the staff of Clinical Laboratory at Capital Medical University Beijing Obstetrics and Gynecology Hospital for their technological support. We also thank our colleagues and technicians in the animal house, without whom this initiative could not have come to fruition.
Disclosure statement
No potential conflict of interest was reported by the authors.
Data availability statement
The data that support the findings of this study are available in the GEO database at https://www.ncbi.nlm.nih.gov/geo/query/acc.cgi?acc = GSE179285, https://www.ncbi.nlm.nih.gov/geo/query/acc.cgi?acc = GSE123141, including the platforms and supplementary file. The raw data of IHC and RT-qPCR was deposited at https://figshare.com with a DOI link https://doi.org/10.6084/m9.figshare.21511677.
Additional information
Funding
References
- Acharyya S, Oskarsson T, Vanharanta S, Malladi S, Kim J, Morris PG, Manova-Todorova K, Leversha M, Hogg N, Seshan VE, et al. 2012. A CXCL1 paracrine network links cancer chemoresistance and metastasis. Cell. 150(1):165–178. doi:10.1016/j.cell.2012.04.042.
- Boland BS, He Z, Tsai MS, Olvera JG, Omilusik KD, Duong HG, Kim ES, Limary AE, Jin W, Milner JJ, et al. 2020. Heterogeneity and clonal relationships of adaptive immune cells in ulcerative colitis revealed by single-cell analyses. Sci Immunol. 5(50):eabb4432. doi:10.1126/sciimmunol.abb4432.
- Chen W, Li W, Zhang Z, Tang X, Wu S, Yao G, Li K, Wang D, Xu Y, Feng R, et al. 2020. Lipocalin-2 Exacerbates Lupus Nephritis by Promoting Th1 Cell Differentiation. J Am Soc Nephrol. 31(10):2263–2277. doi:10.1681/ASN.2019090937.
- De Filippo K, Dudeck A, Hasenberg M, Nye E, van Rooijen N, Hartmann K, Gunzer M, Roers A, Hogg N. 2013. Mast cell and macrophage chemokines CXCL1/CXCL2 control the early stage of neutrophil recruitment during tissue inflammation. Blood. 121(24):4930–4937. doi:10.1182/blood-2013-02-486217.
- Dekens DW, Eisel ULM, Gouweleeuw L, Schoemaker RG, De Deyn PP, Naude PJW. 2021. Lipocalin 2 as a link between ageing, risk factor conditions and age-related brain diseases. Ageing Res Rev. 70:101414. doi:10.1016/j.arr.2021.101414.
- Deng F, Yan J, Lu J, Luo M, Xia P, Liu S, Wang X, Zhi F, Liu D. 2021. M2 Macrophage-Derived Exosomal miR-590-3p Attenuates DSS-Induced Mucosal Damage and Promotes Epithelial Repair via the LATS1/YAP/ beta-Catenin Signalling Axis. J Crohns Colitis. 15(4):665–677. doi:10.1093/ecco-jcc/jjaa214.
- De Schepper S, Verheijden S, Aguilera-Lizarraga J, Viola MF, Boesmans W, Stakenborg N, Voytyuk I, Schmidt I, Boeckx B, Dierckx de Casterle I, et al. 2018. Self-Maintaining Gut macrophages Are essential for intestinal homeostasis. Cell. 175(2):400–415.e13. doi:10.1016/j.cell.2018.07.048.
- Gancarcikova S, Lauko S, Hrckova G, Andrejcakova Z, Hajduckova V, Madar M, Kolesar Fecskeova L, Mudronova D, Mravcova K, Strkolcova G, et al. 2020. Innovative animal model of DSS-induced ulcerative colitis in pseudo germ-free mice. Cells. 9(12):2571. doi:10.3390/cells9122571.
- Gryglewski A, Richter P, Szczepanik M. 2021. Changes in gammadeltaT Cells in Peripheral Blood of Patients with Ulcerative Colitis Exacerbations. Arch Immunol Ther Exp (Warsz). 69(1):18. doi:10.1007/s00005-021-00620-x.
- He R, Li Y, Han C, Lin R, Qian W, Hou X. 2019. L-Fucose ameliorates DSS-induced acute colitis via inhibiting macrophage M1 polarization and inhibiting NLRP3 inflammasome and NF-kB activation. Int Immunopharmacol. 73:379–388. doi:10.1016/j.intimp.2019.05.013.
- Ju S, Mu J, Dokland T, Zhuang X, Wang Q, Jiang H, Xiang X, Deng ZB, Wang B, Zhang L, et al. 2013. Grape exosome-like nanoparticles induce intestinal stem cells and protect mice from DSS-induced colitis. Mol Ther. 21(7):1345–1357. doi:10.1038/mt.2013.64.
- Kang SS, Ren Y, Liu CC, Kurti A, Baker KE, Bu G, Asmann Y, Fryer JD. 2018. Lipocalin-2 protects the brain during inflammatory conditions. Mol Psychiatry. 23(2):344–350. doi:10.1038/mp.2016.243.
- Kaplan GG. 2015. The global burden of IBD: from 2015 to 2025. Nat Rev Gastroenterol Hepatol. 12(12):720–727. doi:10.1038/nrgastro.2015.150.
- Kaplan GG, Windsor JW. 2021. The four epidemiological stages in the global evolution of inflammatory bowel disease. Nat Rev Gastroenterol Hepatol. 18(1):56–66. doi:10.1038/s41575-020-00360-x.
- Kobayashi T, Siegmund B, Berre CL, Wei SC, Ferrante M, Shen B, Bernstein CN, Danese S, Peyrin-Biroulet L, Hibi T. 2020. Ulcerative colitis. Nat Rev Dis Primers. 6(1):74. doi:10.1038/s41572-020-0205-x.
- Lee JY, Hall JA, Kroehling L, Wu L, Najar T, Nguyen HH, Lin WY, Yeung ST, Silva HM, Li D, et al. 2020. Serum Amyloid A Proteins Induce Pathogenic Th17 Cells and Promote Inflammatory Disease. Cell. 180(1):79–91 e16. doi:10.1016/j.cell.2019.11.026.
- Liu ZY, Zheng M, Li YM, Fan XY, Wang JC, Li ZC, Yang HJ, Yu JM, Cui J, Jiang JL, et al. 2019. RIP3 promotes colitis-associated colorectal cancer by controlling tumor cell proliferation and CXCL1-induced immune suppression. Theranostics. 9(12):3659–3673. doi:10.7150/thno.32126.
- Lv Q, Xing Y, Liu Y, Chen Q, Xu J, Hu L, Zhang Y. 2021. Didymin switches M1-like toward M2-like macrophage to ameliorate ulcerative colitis via fatty acid oxidation. Pharmacol Res. 169:105613. doi:10.1016/j.phrs.2021.105613.
- Molodecky NA, Soon IS, Rabi DM, Ghali WA, Ferris M, Chernoff G, Benchimol EI, Panaccione R, Ghosh S, Barkema HW, Kaplan GG. 2012. Increasing incidence and prevalence of the inflammatory bowel diseases with time, based on systematic review. Gastroenterology. 142(1):46–54.e42. doi:10.1053/j.gastro.2011.10.001.
- Na YR, Jung D, Stakenborg M, Jang H, Gu GJ, Jeong MR, Suh SY, Kim HJ, Kwon YH, Sung TS, et al. 2021. Prostaglandin E2 receptor PTGER4-expressing macrophages promote intestinal epithelial barrier regeneration upon inflammation. Gut. 70(12):2249–2260. doi:10.1136/gutjnl-2020-322146.
- Nielsen MM, Witherden DA, Havran WL. 2017. gammadelta T cells in homeostasis and host defence of epithelial barrier tissues. Nat Rev Immunol. 17(12):733–745. doi:10.1038/nri.2017.101.
- Okahara S, Arimura Y, Yabana T, Kobayashi K, Gotoh A, Motoya S, Imamura A, Endo T, Imai K. 2005. Inflammatory gene signature in ulcerative colitis with cDNA macroarray analysis. Aliment Pharmacol Ther. 21(9):1091–1097. doi:10.1111/j.1365-2036.2005.02443.x.
- Okayasu I, Hatakeyama S, Yamada M, Ohkusa T, Inagaki Y, Nakaya R. 1990. A novel method in the induction of reliable experimental acute and chronic ulcerative colitis in mice. Gastroenterology. 98(3):694–702. doi:10.1016/0016-5085(90)90290-h.
- Ordas I, Eckmann L, Talamini M, Baumgart DC, Sandborn WJ. 2012. Ulcerative colitis. Lancet. 380(9853):1606–1619. doi:10.1016/S0140-6736(12)60150-0.
- Paudel S, Baral P, Ghimire L, Bergeron S, Jin L, DeCorte JA, Le JT, Cai S, Jeyaseelan S. 2019. CXCL1 regulates neutrophil homeostasis in pneumonia-derived sepsis caused by Streptococcus pneumoniae serotype 3. Blood. 133(12):1335–1345. doi:10.1182/blood-2018-10-878082.
- Rabe H, Malmquist M, Barkman C, Ostman S, Gjertsson I, Saalman R, Wold AE. 2019. Distinct patterns of naive, activated and memory T and B cells in blood of patients with ulcerative colitis or Crohn's disease. Clin Exp Immunol. 197(1):111–129. doi:10.1111/cei.13294.
- Ribot JC, Lopes N, Silva-Santos B. 2021. gammadelta T cells in tissue physiology and surveillance. Nat Rev Immunol. 21(4):221–232. doi:10.1038/s41577-020-00452-4.
- Satoh T, Akira S. 2016. Toll-Like receptor signaling and Its inducible proteins. Microbiol Spectr. 4(6). doi:10.1128/microbiolspec.MCHD-0040-2016.
- Sebestyen Z, Prinz I, Dechanet-Merville J, Silva-Santos B, Kuball J. 2020. Translating gammadelta (gammadelta) T cells and their receptors into cancer cell therapies. Nat Rev Drug Discov. 19(3):169–184. doi:10.1038/s41573-019-0038-z.
- Sinha A, Li Y, Mirzaei MK, Shamash M, Samadfam R, King IL, Maurice CF. 2022. Transplantation of bacteriophages from ulcerative colitis patients shifts the gut bacteriome and exacerbates the severity of DSS colitis. Microbiome. 10(1):105. doi:10.1186/s40168-022-01275-2.
- Tatiya-Aphiradee N, Chatuphonprasert W, Jarukamjorn K. 2018. Immune response and inflammatory pathway of ulcerative colitis. J Basic Clin Physiol Pharmacol. 30(1):1–10. doi:10.1515/jbcpp-2018-0036.
- Wang LX, Zhang SX, Wu HJ, Rong XL, Guo J. 2019. M2b macrophage polarization and its roles in diseases. J Leukoc Biol. 106(2):345–358. doi:10.1002/JLB.3RU1018-378RR.
- Xiao X, Yeoh BS, Vijay-Kumar M. 2017. Lipocalin 2: An Emerging Player in Iron Homeostasis and Inflammation. Annu Rev Nutr. 37:103–130. doi:10.1146/annurev-nutr-071816-064559.
- Xiu MX, Liu YM, Chen GY, Hu C, Kuang BH. 2021. Identifying Hub Genes, Key Pathways and Immune Cell Infiltration Characteristics in Pediatric and Adult Ulcerative Colitis by Integrated Bioinformatic Analysis. Dig Dis Sci. 66(9):3002–3014. doi:10.1007/s10620-020-06611-w.
- Xu M, Tao J, Yang Y, Tan S, Liu H, Jiang J, Zheng F, Wu B. 2020. Ferroptosis involves in intestinal epithelial cell death in ulcerative colitis. Cell Death Dis. 11(2):86. doi:10.1038/s41419-020-2299-1.
- Xu YW, Xing RX, Zhang WH, Li L, Wu Y, Hu J, Wang C, Luo QL, Shen JL, Chen X. 2019. Toxoplasma ROP16I/III ameliorated inflammatory bowel diseases via inducing M2 phenotype of macrophages. World J Gastroenterol. 25(45):6634–6652. doi:10.3748/wjg.v25.i45.6634.
- Xue G, Hua L, Zhou N, Li J. 2021. Characteristics of immune cell infiltration and associated diagnostic biomarkers in ulcerative colitis: results from bioinformatics analysis. Bioengineered. 12(1):252–265. doi:10.1080/21655979.2020.1863016.
- Yang J, Pei G, Sun X, Xiao Y, Miao C, Zhou L, Wang B, Yang L, Yu M, Zhang ZS, et al. 2022. RhoB affects colitis through modulating cell signaling and intestinal microbiome. Microbiome. 10(1):149. doi:10.1186/s40168-022-01347-3.
- Zhang J, Wang X, Xu L, Zhang Z, Wang F, Tang X. 2020. Investigation of Potential Genetic Biomarkers and Molecular Mechanism of Ulcerative Colitis Utilizing Bioinformatics Analysis. Biomed Res Int. 2020:4921387. doi:10.1155/2020/4921387.
- Zhuang H, Lv Q, Zhong C, Cui Y, He L, Zhang C, Yu J. 2021. Tiliroside Ameliorates Ulcerative Colitis by Restoring the M1/M2 Macrophage Balance via the HIF-1alpha/glycolysis Pathway. Front Immunol. 12:649463. doi:10.3389/fimmu.2021.649463.