
 ?Mathematical formulae have been encoded as MathML and are displayed in this HTML version using MathJax in order to improve their display. Uncheck the box to turn MathJax off. This feature requires Javascript. Click on a formula to zoom.
Abstract
Crohn’s disease (CD) is a nonspecific inflammatory disease of digestive tract with limited known biomarkers. We aimed to identify potential molecules involved in CD severity. Weighted gene co-expression network and differentially expressed gene analyses were used to explore hub genes associated with inflammation and involved in pathological processes of CD in the GSE83448 cohort. The expression and relationship of genes with clinical characteristics in normal and CD intestinal mucosa were validated in GSE208303 and our research cohorts. Five genes related to disease and inflammation were identified in the clinically significant modules that were differentially expressed in healthy controls and CD patients. Among them, solute carrier family 39 member 5 (SLC39A5) expression was reduced in CD tissues compared with that in normal tissues; low SLC39A5 expression was associated with CD-simplifying endoscopic score and stenosis. Furthermore, we broadened the bioinformatic threshold with qRT-PCR verification and western blot, and found that the expressions of cytochrome P450 family 2 subfamily S member 1 (CYP2S1), fatty acid 2-hydroxylase (FA2H), fatty acid binding protein 1 (FABP1), and Rho family GTPase 3 (RND3) were reduced in CD tissues. Therefore, SLC39A5, CYP2S1, FA2H, FABP1, and RND3 may be novel biomarkers for CD and associated with severity.
Highlights
SLC39A5 expression was reduced in CD tissues.
Low SLC39A5 expression was associated with CD-simplifying endoscopic score and stenosis.
CYP2S1, FA2H, FABP1, and RND3 were reduced in CD tissues.
Introduction
Crohn’s disease (CD) is a disease of the digestive system characterized by chronic segmental transmural inflammatory bowel disease that may affect the entire digestive tract, especially the distal ileum and adjacent colon (Ford Citation2021). The severity of CD varies among patients, and the main clinical symptoms include abdominal pain, diarrhea, fistula formation, and penetrating inflammation (Cushing and Higgins Citation2021). Microbial damage, genetic predisposition, changes in intestinal barrier permeability, stress, and immune abnormalities are believed to be involved in CD pathogenesis (Guo and Shen Citation2021; Hornschuh et al. Citation2021). Mesalamine, hormones, and immunosuppressants are the main therapeutic strategies for CD (Sulz et al. Citation2020). However, most patients experience recurrence, and the specific etiology of CD remains unclear. Therefore, exploring the molecular mechanisms involved in CD may contribute to its diagnosis and treatment.
In recent years, high-throughput sequencing and gene microarray, followed by bioinformatics analysis, have been employed to explore the key molecules involved in disease progression, contributing to the diagnosis and prognosis of disease (Pareek et al. Citation2011; McCombie et al. Citation2019). The Cancer Gene Expression Omnibus (GEO) is a major public database that stores various gene expression profiles of hundreds of diseases (McCombie et al. Citation2019; Albaradei et al. Citation2021). Differentially expressed gene (DEG) analysis and weighted gene co-expression network analysis (WGCNA) are two main bioinformatics analysis methods used to explore the key genes involved in disease progression. DEG analysis focuses on changes in gene expression levels among different samples (Costa-Silva et al. Citation2017). WGCNA is a systematic biological approach that focuses on the relationship between gene modules and clinical characteristics (Zhang and Horvath Citation2005). To date, a series of biomarkers for digestive system diseases have been identified using bioinformatics methods. For example, Xie et al. performed WGCNA and demonstrated that several genes associated with primary immunodeficiency, including CD4, CD3D, and CD40 ligands, are involved in the occurrence of inflammatory bowel diseases (Xie et al. Citation2018). By performing DEG analysis in a microarray cohort, Liu et al. demonstrated that four genes associated with m6A methylation regulation play key roles in colorectal cancer (Wei et al. Citation2021). However, effective biomarkers for CD remain unknown. Therefore, identifying the key genes involved in inflammation and CD severity has clinical significance in diagnosis and treatment.
In this study, bioinformatics analysis combined with qRT-PCR verification and clinical case review were used to identify key genes in CD. SLC39A5, cytochrome P450 family 2 subfamily S member 1 (CYP2S1), fatty acid 2-hydroxylase (FA2H), fatty acid binding protein 1 (FABP1), and Rho family GTPase 3 (RND3) were identified as core genes in CD, with lower expression in CD tissues. Among them, we found that low SLC39A5 expression was associated with CD, simplifying endoscopic score and stenosis. In conclusion, SLC39A5, CYP2S1, FA2H, FABP1, and RND3 may be key molecules involved in CD, which may act as biomarkers and targets for CD diagnosis and therapy.
Methods
Transcriptional profile preprocessing
The transcriptional profile (accession number: GSE83448) (Zabana et al. Citation2020) of intestinal mucosa biopsies obtained from healthy controls and CD patients and corresponding information of clinical characteristics were obtained from the GEO database (https://www.ncbi.nlm.nih.gov/gds) and set as the discovery cohort. The transcriptional profile was provided by Josep M, and was performed on the GPL18134 platform using GE Healthcare/Amersham Biosciences CodeLink Human Whole Genome Bioarray. In total, 14 intestinal mucosa biopsies obtained from healthy controls and 39 intestinal mucosa biopsies obtained from CD patients were included in the GSE83448 cohort. The gene expression profile of GSE208303 (Hong et al. Citation2017), containing nine intestinal mucosa biopsies provided by healthy controls and 26 intestinal mucosa biopsies obtained from CD patients, was used as the verification cohort. Before performing bioinformatics analysis, raw data were downloaded and pre-processed as follows: probe names were converted to gene names, the expression of the same genes was merged, genes with medium expression levels ≤1 were removed, and gene expression was normalized.
WGCNA construction and identification of significant modules
In this study, gene expression data of intestinal mucosa biopsies obtained from healthy controls and CD patients in the GSE83448 cohort were imported into R software (version: 4.0.5) (Chan Citation2018) and used to construct WGCNA using a standard procedure (Langfelder and Horvath Citation2008). First, hclust was used to cluster samples, and samples with heights >200 were set as outliers. After removing the outliers, a suitable soft threshold that could maintain scale-free topology >0.85 and mean connectivity close to 0 was set. A scale-free network was then constructed based on a suitable soft threshold. The weighted adjacency matrix of the gene pairs was then calculated and transformed into a topological overlap matrix (TOM). The hierarchical clustering method was used to construct the clustering tree structure of the TOM. Different branches of the cluster tree were represented by different modules. Modules with adjacency value <0.2 were merged, and the software automatically named each gene module with a color name. Genes with no co-expression relationships were placed in the gray module. The association between gene modules and clinical characteristics (disease state: with or without CD; inflammation: with or without inflammation) was calculated. Gene modules that were both associated with disease and inflammation with |correlation score| >0.3 and P<0.05, were set as potential clinically significant modules. Subsequently, the module membership (MM) and gene significance (GS) for each module were calculated; the MM of genes in the modules was significantly associated with their GS with a correlation score >0.3 and P<0.05, and the modules were set as clinically significant modules. Genes in clinically significant modules were used for further analysis.
DEG analysis and identification of potential hub genes
The DEGs between intestinal mucosa biopsies obtained from healthy controls and CD patients, as well as those with or without inflammation, were analyzed in R software using the edgeR package (Robinson et al. Citation2010). Genes with |LogFC| ≥ 1.0 or ≥0.5 and adjusted P-value < 0.05 were set as thresholds to consider as DEGs. DEGs and genes in clinically significant modules were used for intersection analysis, and intersecting genes were set as potential hub genes.
Protein–protein interaction (PPI) construction and identification of hub genes
Information on all potential hub genes was imported into the STRING online tool (https://string-db.org/) for PPI construction (Athanasios et al. Citation2017). The lines between the genes in the PPI network indicate connections.
Tissue collection and ethical statement
A total of 31 intestinal mucosa biopsies (from ileum and colon) of CD and adjacent tissues were collected during intestinal endoscopy in the gastroenterology department of Zhujiang Hospital Affiliated to Southern Medical University (Guangzhou, China). Tissue collection was approved by the Human Ethics Committee of Zhujiang Hospital Affiliated to Southern Medical University (approval number 2021-KY-150-01). Written informed consent was obtained from all patients enrolled in the experiments. The tissues were stored at −80°C prior to experimentation.
qRT-PCR
Total RNA was extracted from intestinal mucosa biopsies of CD and adjacent tissues using TRIzol reagent (Yeasen, Shanghai, China). The PrimeScript™ RT Reagent Kit (Takara, Japan) was used to reverse transcribe 800 ng of mRNA into cDNA, following concentration determination using a spectrophotometer. The final qRT-PCR was performed using 2 µL of cDNA, and SYBR Green (Thermo Fisher Scientific, USA) was used to detect the mRNA levels of the target genes. Gene expression was calculated using the 2-△△CT method and normalized to GAPDH mRNA level. The primers used in this study were as follows:
GAPDH forward: 5′-GGAGCGAGATCCCTCCAAAAT-3′;
GAPDH reversed: 5′-GGCTGTTGTCATACTTCTCATGG-3′;
SLC39A5 forward: 5′-GGTCCCCAGTGAGTCATCTG-3′;
SLC39A5 reversed: 5′-GCCAGGTAATGGTTCTGCTCC-3′;
CYP2S1 forward: 5′-GCGCTGTATTCAGGGCTCAT-3′;
CYP2S1 reversed: 5′-CTTCCAGCATCGCTACGGTT-3′;
FA2H forward: 5′-CGCCTCTACGACCTCTCCA-3′;
FA2H reversed: 5′-TGGTTCCATAGCAGGATCTGTC-3′;
FABP1 forward: 5′-ATGAGTTTCTCCGGCAAGTACC-3′;
FABP1 reversed: 5′-CTCTTCCGGCAGACCGATTG-3′;
RND3 forward: 5′-GCTCCATGTCTTCGCCAAG-3′;
RND3 reversed: 5′-AAAACTGGCCGTGTAATTCTCA-3′;
ERBB3 forward: 5′-GGTGATGGGGAACCTTGAGAT-3′;
ERBB3 reversed: 5′-CTGTCACTTCTCGAATCCACTG-3′.
Western blotting
Total protein in intestinal mucosa biopsies of CD and adjacent tissues was extracted using RIPA reagent (Beyotime, Guangzhou, China), and the protein concentration of each sample was determined by the bicinchoninic acid method. Protein samples were separated by 12% Omni-PAGE (Epizyme, Shanghai, China) and transferred to PVDF membranes (Epizyme, Shanghai, China). The membranes were blocked with 8% skim milk powder (Epizyme, Shanghai, China) for 2 h and then incubated with anti-GAPDH (1:2000; 60004-1-Ig, Proteintech, Wuhan, China), anti-SLC39A5 (1:500; 17285-1-AP, Proteintech, Wuhan, China), anti-CYP2S1 (1:500, 19100-1-AP, Proteintech, Wuhan, China), anti-FA2H (1:1000, 15452-1-AP, Proteintech, Wuhan, China), anti-FABP1 (1:2000, 13626-1-AP, Proteintech, Wuhan, China), and anti-RND3 (1:1000, 66228-1-Ig, Proteintech, Wuhan, China) at 4 °C overnight. After washing twice with PBS and incubating with secondary antibodies for 2 h, the membranes were developed using the ECL reagent (Epizyme, Shanghai, China). The relative expression of SLC39A5, CYP2S1, FA2H, FABP1 and RND3 was determined using GAPDH.
Gene set enrichment analysis (GSEA)
According to the median values of SLC39A5, patients were categorized into high and low expression groups. GSEA was used to determine the enriched KEGG terms. Statistical significance was set at P < 0.05.
Statistical analyses
Gene expression in adjacent and CD tissues was analyzed using a paired t-test. The relationship between SLC39A5 expression in Crohn’s lesions and the SES-CD scores of patients was analyzed using Pearson’s correlation analysis. |R| >0.3 and P<0.05, were set as cut-offs to consider significance. The relationship between SLC39A5 expression and clinical characteristics of CD patients, including year, smoking history, upper gastrointestinal symptoms, stenosis (or penetration), ESR↑ (CRP↑), and perianal region symptoms, was analyzed using Fisher’s exact test. P<0.05 was set as the significance threshold.
Results
WGCNA construction
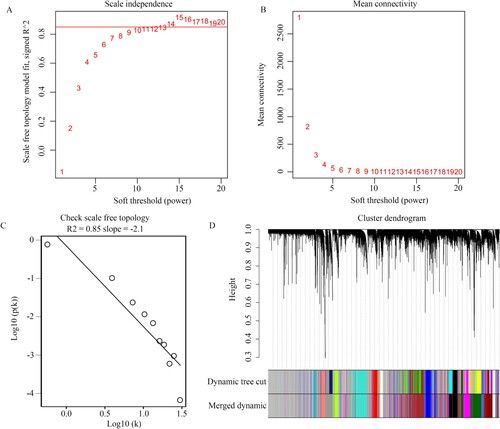
The transcriptional profile (accession number: GSE83448) of intestinal mucosa biopsies was obtained from healthy controls and CD patients, and corresponding information of clinical characteristics was obtained from the GEO database and used to construct WGCNA. The hclust function showed that there were no outliers (height >200) among these samples (Figure ). Similarly, the clinical information (CD disease state: yes or no; inflammation: with or without) was thorough. Therefore, all the genes in these samples and their corresponding clinical information were used to perform WGCNA. We found that it ensured a scale-free topology >0.85 (Figure (A)) and mean connectivity close to 0 (Figure (B)); the soft threshold (β value) was set as 14. Furthermore, under β = 14, the topological overlap matrix met the scale-free topology criterion, with R2 = 0.85 (Figure (C)). Therefore, we used β = 14 as a suitable soft threshold to construct WGCNA, and 15 co-expressed gene modules (darkturquoise, blue, brown, grey60, greenyellow, lightcyan, darkred, royalblue, turquoise, lightyellow, red, salmon, darkgreen, black, and magenta) were clustered (Figure (D)). In particular, when the genes had no co-expression relationship with each other they were clustered in the gray module.
Figure 1. Sample tree clustering of transcriptional profile of 53 intestinal mucosa biopsies and corresponding and clinical traits. Disease state: black indicates CD patients, and white indicates patients without CD. Inflammation: black indicates the tissues with inflammation, and white indicates the tissues without inflammation.
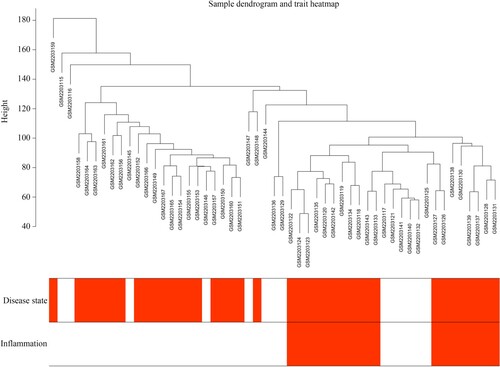
Figure 2. Construction of WGCNA. (A,B) Scale independence and mean connectivity of various soft threshold values (β). β with the scale independence >0.85 and mean connectivity closed to 0 was set as suitable. (C) Gene sets with the corresponding log10 and log10 P-values when the scale-free topology is set as β = 14. (D) Clustering dendrograms of all genes with dissimilarities based on topological overlap, together with their assigned module colors.
Identification of clinically significant modules
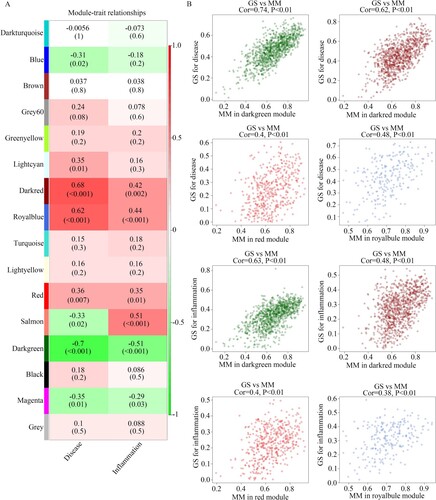
We then analyzed the relationship between gene modules and clinical characteristics. We found that the darkred (R = 0.68, P < 0.001; R = 0.42, P = 0.002), red (R = 0.36, P = 0.007; R = 0.35, P = 0.01), and royalblue (R = 0.62, P < 0.001; R = 0.44, P < 0.001) modules were positively and significantly associated with CD disease state and inflammation, whereas the darkgreen module (R = −0.7, P < 0.001; R = −0.51, P < 0.001) was negatively and significantly associated with disease state and inflammation (Figure (A)). We found that the MM in these gene modules was significantly associated with GS (Figure (B)). These four gene modules (darkred, red, royalblue, and darkgreen) were considered clinically significant gene modules. Therefore, 2752 genes (Supplementary Table 1) in these modules were used in further analysis.
Figure 3. Identification of clinical modules. (A) Heatmap showing the relationship between gene modules and clinical traits. (B) The relationship between module memberships of clinically significant modules and gene significance of inflammation and disease state are shown.
Identification of potential hub genes
DEG analysis was performed; a total of 489 DEGs with |LogFC| ≥ 1 were identified between the intestinal mucosa biopsies provided by healthy controls and those from CD patients (Figure (A); Supplementary Table 2); and 209 DEGs with |LogFC| ≥ 1 were identified between intestinal mucosa biopsies with or without inflammation from CD patients (Figure (B); Supplementary Table 3). After performing intersection analysis, 5 genes (CDHR5, SLC39A5, CYP2S1, TMEM61, and SCIN) which were in the clinically significant modules and differently expressed among intestinal mucosa biopsies from healthy controls, intestinal mucosa biopsies with inflammation from CD patients, and intestinal mucosa biopsies without inflammation from CD patients, were identified as hub genes (Figure (C)). Interestingly, these five genes were also downregulated in CD tissues, especially in the CD tissues with inflammation (Table ). Furthermore, by performing the PPI network analysis, we found that there were relationships between CDHR5, CYP2S1, and SLC39A5 (Figure (D)).
Figure 4. Identification of differently expressed genes in intestinal mucosa biopsies obtained from healthy controls and CD patients with or without inflammation. (A) Volcano plot showing the differently expressed genes in the intestinal mucosa biopsies obtained from healthy controls and CD patients with the threshold as LogFC ≥ 1. (B) Volcano plot showing the differently expressed genes in the intestinal mucosa biopsies with or without inflammation obtained from CD patients with the threshold as LogFC ≥ 1. (C) Intersection analysis was performed to identify differently expressed genes which were also clustered in the clinical modules. List 1: differently expressed genes in the intestinal mucosa biopsies obtained from healthy controls and CD patients. List 2: the differently expressed genes in the intestinal mucosa biopsies with or without inflammation obtained from CD patients. List 3: Genes in the clinical modules. (D) PPI network of SCIN, TMEM61, SLC39A5, CYP2S1, and CDHR5.
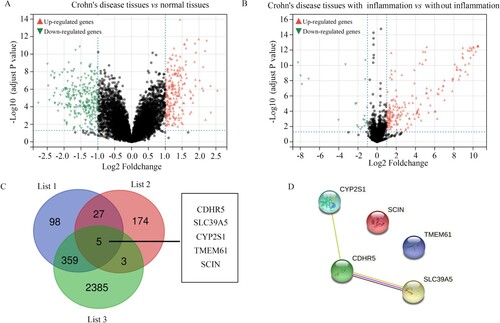
Table 1. The change level of SCIN, TMEM61, SLC39A5, CYP2S1 and CDHR5 among intestinal mucosa biopsies from healthy control, intestinal mucosa biopsies with inflammation from CD patients and intestinal mucosa biopsies without inflammation based on the data from GSE83448.
Verification of hub genes in the GSE208303 cohort
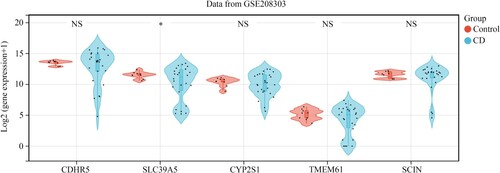
To verify the effectiveness of the five hub genes in CD, the GSE208303 cohort containing nine intestinal mucosa biopsies obtained from healthy controls and 26 intestinal mucosa biopsies obtained from CD patients was used as the verification cohort. Consistent with the results from the discovery cohort GSE83448, SLC39A5 expression was also reduced in intestinal mucosa biopsies obtained from patients in the GSE208303 cohort. However, CDHR5, CYP2S1, TMEM61, and SCIN expression levels did not change significantly in the GSE208303 cohort (Figure ). Therefore, SLC39A5 was selected as the hub gene for CD.
Figure 5. SCIN, TMEM61, SLC39A5, CYP2S1, and CDHR5 expression in the intestinal mucosa biopsies obtained from healthy controls and CD patients based on the data from GSE208303.
Validation of clinical value of SLC39A5 in CD tissues from our cohort
We then determined the expression of the hub gene SLC39A5 in the 31 CD tissues from our cohort via qRT-PCR. The mRNA levels of SLC39A5 were significantly lower in CD tissues than those in adjacent mucosal tissues (Figure (A)). Matched-pair analysis revealed that the mRNA levels of SLC39A5 were significantly reduced in 48.4% of CD tissues compared to those in their corresponding adjacent tissues (Figure (B,C)). Furthermore, by reviewing the clinical traits of the 31 CD patients (Table ), we found that mRNA levels of SLC39A5 were negatively associated with CD-simplifying endoscopic score (SES-CD; R = −0.51; Figure (D)). Moreover, we found that the protein levels of SLC39A5 were also lower in CD tissues compared with those in the corresponding adjacent tissues (Figure (E)). Furthermore, using Fisher’s exact test, we found that low SLC39A5 mRNA levels were associated with stenosis (Table ). This evidence indicated that SLC39A5 may act as a biomarker for CD associated with the severity of CD.
Figure 6. Clinical value of SLC39A5. (A) SLC39A5 expression in the 31 pair CD tissues and adjacent mucosa biopsies. (B,C) Matched-pair analysis for SLC39A5 expression between CD tissues and corresponding adjacent mucosa biopsies. (D) Pearson analysis for the relationship between SLC39A5 mRNA levels in CD tissues and SES-CD score. (E) Representative protein levels of SLC39A5 in 5 pair CD tissues and adjacent tissues determined by western blot. **P < 0.05.
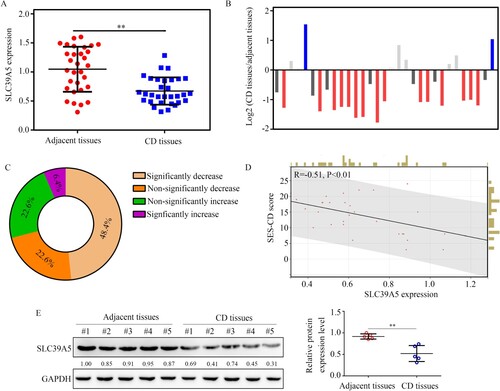
Table 2. The basic clinical traits of 31 CD patients who provided intestinal mucosa biopsies and expression of SLC39A5 in adjacent tissues and CD tissues.
Table 3. Fisher’s exact test was used to analyze the relationship between SLC39A5 expression in CD tissues and clinical traits of 31 CD patients.
GSEA for the pathways affected by SLC39A5 in CD
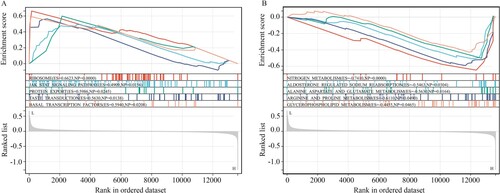
GSEA was performed to explore the molecular mechanisms of SLC39A5 in CD. Results indicated that SLC39A5 expression deficiency induced the activation of pathways of ‘ribosome,’ ‘JAK-STAT,’ ‘protein export,’ ‘taste transduction,’ and ‘basal transcription factors’ (Figure (A)), and suppressed the pathways of ‘nitrogen metabolism,’ ‘alanine aspartate and glutamate metabolism,’ ‘aldosterone regulated sodium reabsorption,’ ‘glycerophospholipid metabolism,’ and ‘arginine and proline metabolism’ in CD (Figure (B)).
Figure 7. GSEA for SLC39A5 in CD tissues. (A) Pathways activated in the CD tissues with low SLC39A5 expression. (B) Pathways inhibited in the CD tissues with low SLC39A5 expression.
Broadened bioinformatic threshold identified CYP2S1, FA2H, FABP1, and RND3 as biomarkers for CD
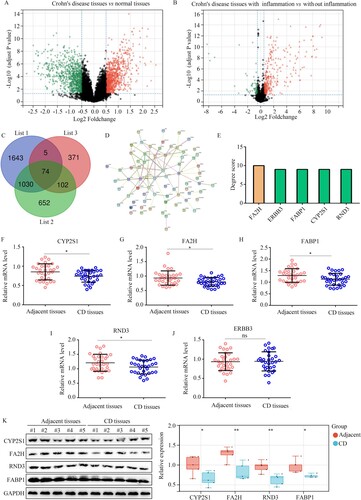
Finally, to obtain more biomarkers for CD, we broadened the threshold (LogFC ≥ 0.5) in the DEG analysis. In total, 1858 DEGs were identified between the intestinal mucosa biopsies of healthy controls and those from CD patients (Figure (A)); 552 DEGs were identified between the intestinal mucosa biopsies with or without inflammation from CD patients (Figure (B)). After performing intersection analysis, 74 genes were identified that were in the clinically significant modules and differentially expressed among intestinal mucosa biopsies from healthy controls and CD patients, with or without inflammation (Figure (C)). The 74 genes were then imported into the STRING tool and a PPI network was constructed (Figure (D)). By calculating the degree score of all genes, it was found that FA2H (degree score = 10), ERBB3 (degree score = 9), FABP1 (degree score = 9), CYP2S1 (degree score = 9), and RND3 (degree score = 9) had the top 5 degree scores (Figure (E)). We also detected their expression in CD and adjacent tissues using qRT-PCR. We found that the expression of CYP2S1 (Figure (F)), FA2H (Figure (G)), FABP1 (Figure (H)), and RND3 (Figure (I)) was decreased in CD tissues, whereas the expression of ERBB3 (Figure (J)) was not significantly changed. Furthermore, western blotting demonstrated that the expression of CYP2S1, FA2H, FABP1 and RND3 was also reduced in CD tissues (Figure (K)). Therefore, CYP2S1, FA2H, FABP1, and RND3 may also act as biomarkers of CD. However, it is worth noting that the amplitude of variation of CYP2S1, FA2H, FABP1, and RND3 was lower than SLC39A5.
Figure 8. CYP2S1, FA2H, FABP1, and RND3 were identified as biomarkers for CD while broadening the threshold of bioinformatics analysis. (A) Volcano plot showing the differently expressed genes in the intestinal mucosa biopsies obtained from healthy controls and CD patients, with the threshold as LogFC ≥ 0.5. (B) Volcano plot showing the differently expressed genes in the intestinal mucosa biopsies, with or without inflammation, obtained from CD patients, with the threshold as LogFC ≥ 0.5. (C) Intersection analysis was performed to identify differently expressed genes, which were also clustered in the clinical modules. List 1: Genes in the clinical modules. List 2: the differently expressed genes between the intestinal mucosa biopsies with or without inflammation from CD patients. List 3: differently expressed genes between the intestinal mucosa biopsies provided by healthy controls and those from CD patients. (D,E) Construction of PPI network of the 74 genes, and selection of hub genes in PPI network based on degree score. (F–J) qRT-PCR analysis was performed to analyze the expression of CYP2S1, FA2H, FABP1, RND3, and ERBB3 in CD tissues and adjacent tissues. (K) Western blotting analysis was performed to analyze the expression of CYP2S1, FA2H, FABP1, and RND3 in CD tissues and adjacent tissues. **P < 0.01; *P < 0.05; ns, not significant.
Discussion
The incidence and clinical characteristics of CD differ among regions and races. Although the etiology of CD has not been fully ascertained, genetics, environment, and inflammation are considered key factors in the development of CD. Early identification of the etiology of CD is important for diagnosis and treatment. Some researchers have shown that CRP level and ESR are valuable in the diagnosis of CD (Daniluk et al. Citation2019; Lee et al. Citation2020). However, their sensitivities and specificities were low. Therefore, there is an urgent need to explore biomarkers with high sensitivity and specificity to accurately diagnose CD.
Bioinformatics is an important tool for identifying disease mechanisms (Wooller et al. Citation2017). Here, by performing WGCNA in GSE83448, four clinically significant modules (darkgreen, darkred, red, and royalblue) associated with both CD disease state and inflammation were identified, and a total of 2752 genes were identified in these modules. Via DEG and intersection analyses, five genes were identified that were in the clinically significant modules and differentially expressed among intestinal mucosa biopsies from healthy controls, intestinal mucosa biopsies with inflammation from CD patients, and intestinal mucosa biopsies without inflammation from CD patients. Among them, SLC39A5 was reduced in CD tissues from the GSE208303 cohort and 31 CD tissues from our research group. The SES-CD score is a simple, reproducible, and easy-to-use endoscopic scoring system for CD that can be used to evaluate the activity and prognosis of CD. Patients with high SES-CD scores have higher CD activity and poorer prognosis (Daperno et al. Citation2004; Zheng et al. Citation2020). We found that SLC39A5 expression was negatively associated with SES-CD scores. In particular, SLC39A5 expression was negatively associated with stenosis (or penetration) in CD patients.
The zinc transporter SLC39A5 is a member of the ZIP family. It transports zinc into the cell and plays a key role in managing zinc levels inside the cell (Hennigar et al. Citation2016). As zinc is a key element for cells, SLC39A5 plays various roles in diseases. Wang et al. demonstrated that SLC39A5 is involved in diabetes progression by regulating insulin secretion in pancreatic β cells (Wang et al. Citation2019). Dong et al. demonstrated that SLC39A5-deficiency contributes to the progression of high myopia (Dong et al. Citation2021). Under physiological conditions, SLC39A5 protects the pancreas from zinc toxicity by regulating intestinal zinc excretion (Geiser et al. Citation2013). However, the role of SLC39A5 in CD is unclear. Here, unlike the pathogenic effects of the cognate family member SLC3A8 (Melia et al. Citation2019), we provided the first evidence that SLC39A5 may act as a biomarker associated with the severity of CD.
Furthermore, GSEA revealed that SLC39A5 regulated a series of pathways, including the JAK-STAT pathway. In addition to its significant role in cellular signaling, the JAK/STAT pathway is associated with several immune-mediated diseases (Banerjee et al. Citation2017; Hu et al. Citation2021). Abnormal activation of the JAK/STAT pathway exists in most CD cases (Xu et al. Citation2021), and a series of JAK/STAT pathway inhibitors have exhibited significant therapeutic effects in CD (Ma et al. Citation2019; Moon et al. Citation2021). The present study provides the first evidence that SLC39A5 may be linked to the activation of JAK/STAT and CD state. The restoration of SLC39A5 expression in mucosal tissues may be a novel strategy for treating CD.
Interestingly, broadening the threshold (LogFC ≥ 0.5) in DEG analysis and performing PPI network analysis identified five genes, CYP2S1, FA2H, FABP1, RND3, and ERBB3, that may act as biomarkers for CD. Via qRT-PCR analysis and western blotting, we found that the expression of CYP2S1, FA2H, FABP1, and RND3 was reduced in CD tissues. CYP2S1 encodes a cytochrome P450 monooxygenase that is involved in the metabolism of retinoids and eicosanoids. It catalyzes the breakdown of the inflammatory factor PGH2 to hydroxyheptadecatrienoic acid and malondialdehyde (Bui et al. Citation2011). In physiological and pathological states, CYP2S1 acts as a protective factor. For example, under hypoxia, cells upregulate CYP2S1 to avoid DNA damage (Cabrera-Cano et al. Citation2021). Dysregulated CYP2S1 expression has been observed in cancer, atherosclerosis, and inflammatory diseases (Saarikoski et al. Citation2005). FA2H encodes a protein that catalyzes the hydroxylation of free fatty acids at the C-2 position to produce 2-hydroxy fatty acids and is stereospecific for the production of (R)-2-hydroxy fatty acids (Hirao-Suzuki et al. Citation2020). Previous studies have found that loss of FA2H expression leads to the accumulation of intracellular polyunsaturated fatty acids, which may inhibit cell proliferation and migration (Yao et al. Citation2019). As 2-hydroxy fatty acids are key mediators for inflammation, FA2H also has the potential to regulate the inflammation response under physiological and pathological conditions (Guo et al. Citation2019). FABP1 encodes a protein that plays a role in the lipoprotein-mediated cholesterol uptake. It regulates intracellular lipid transport and has the potential to bind free fatty acids and their coenzyme A derivatives (Tsai et al. Citation2020). FABP1 overexpression promotes intestinal inflammation and tumorigenesis (Abbasi et al. Citation2020). Inhibition of FABP1 can ameliorate hepatic steatosis and inflammation (Mukai et al. Citation2017). RND3 encodes a GTPase superfamily protein. The RND3 protein can bind to GTP but has no GTPase activity. It negatively regulates cytoskeletal organization, causing adhesion loss (Dankel et al. Citation2019). RND3 can bind to the P65 protein and activate the NF-κB pathway, thus leading to the production of inflammatory factors (Dong et al. Citation2021). Our study provides the first evidence that CYP2S1, FA2H, FABP1, and RND3 may act as biomarkers of CD.
Although we have provided some biomarkers for the diagnosis of CD, the present study has some limitations. First, bioinformatics has limitations. For the DEG analysis, the results were correlated with the threshold. High threshold settings will cause more false negative results, whereas low thresholds will cause more false positive results. Second, the threshold of DEG analysis is associated with the rangeability of the identified genes. Genes identified using a high threshold are often accompanied by a large change in their expression. Therefore, we only focused on the role of genes and ignored the effects of non-coding RNA on CD. Third, more cases should be examined to verify the effectiveness of SLC39A5, CYP2S1, FA2H, FABP1, and RND3 in CD. Moreover, the effects and molecular mechanisms of the biomarkers identified in our study on intestinal mucosal cells should be determined by additional cell or animal experiments.
In conclusion, we provided the first evidence to demonstrate that SLC39A5, CYP2S1, FA2H, FABP1, and RND3 may be novel biomarkers for CD, and that SLC39A5 has diagnostic value in estimating the activity of CD and the degree of inflammation. SLC39A5, CYP2S1, FA2H, FABP1, and RND3 may serve as novel biomarkers and targets for the diagnosis and treatment of CD.
Availability of data and materials
Transcriptional profiles (accession numbers: GSE83448 and GSE208303) of intestinal mucosa biopsies obtained from healthy controls and CD patients and corresponding information of clinical characteristics were obtained from the Gene Expression Omnibus database (https://www.ncbi.nlm.nih.gov/gds). All original data and R scripts are shown at doi:10.6084/m9.figshare.20632272.v6.
Supplemental Material
Download MS Word (90.5 KB)Acknowledgements
We appreciate the staff who participate in the daily maintenance and updating of the GEO database. Human Ethics Committee of Zhujiang Hospital Affiliated to Southern Medical University approved and administrated the tissue collection (approval number 2021-KY-150-01). LM, WQ, and ZZ designed the experiments and performed the analyses. ZQ, LY, MZ, and MH collected the data and constructed the figures. All authors reviewed the manuscript and approved its submission.
Disclosure statement
No potential conflict of interest was reported by the author(s).
Additional information
Funding
References
- Abbasi N, Long T, Li Y, Yee BA, Cho BS, Hernandez JE, Ma E, Patel PR, Sahoo D, Sayed IM, et al. 2020. DDX5 promotes oncogene C3 and FABP1 expressions and drives intestinal inflammation and tumorigenesis. Life Sci Alliance. 3:10. doi:10.26508/lsa.202000772.
- Albaradei S, Thafar M, Alsaedi A, Van Neste C, Gojobori T, Essack M, Gao X. 2021. Machine learning and deep learning methods that use omics data for metastasis prediction. Comput Struct Biotechnol J. 19:5008–5018. doi:10.1016/j.csbj.2021.09.001.
- Athanasios A, Charalampos V, Vasileios T, Ashraf GM. 2017. Protein-protein interaction (PPI) network: recent advances in drug discovery. Curr Drug Metab. 18(1):5–10. doi:10.2174/138920021801170119204832.
- Banerjee S, Biehl A, Gadina M, Hasni S, Schwartz DM. 2017. JAK-STAT signaling as a target for inflammatory and autoimmune diseases: current and future prospects. Drugs. 77(5):521–546. doi:10.1007/s40265-017-0701-9.
- Bui P, Imaizumi S, Beedanagari SR, Reddy ST, Hankinson O. 2011. Human CYP2S1 metabolizes cyclooxygenase- and lipoxygenase-derived eicosanoids. Drug Metab Dispos. 39(2):180–190. doi:10.1124/dmd.110.035121.
- Cabrera-Cano A, Dávila-Borja VM, Juárez-Méndez S, Marcial-Quino J, Gómez-Manzo S, Castillo-Rodríguez RA. 2021. Hypoxia as a modulator of cytochromes P450: overexpression of the cytochromes CYP2S1 and CYP24A1 in human liver cancer cells in hypoxia. Cell Biochem Funct. 39(4):478–487. doi:10.1002/cbf.3612.
- Chan BKC. 2018. Data analysis using R programming. Adv Exp Med Biol. 1082:47–122. doi:10.1007/978-3-319-93791-5_2.
- Costa-Silva J, Domingues D, Lopes FM. 2017. RNA-Seq differential expression analysis: an extended review and a software tool. PLoS One. 12(12):e0190152. doi:10.1371/journal.pone.0190152.
- Cushing K, Higgins PDR. 2021. Management of Crohn disease: a review. JAMA. 325(1):69–80. doi:10.1001/jama.2020.18936.
- Daniluk U, Daniluk J, Krasnodebska M, Lotowska JM, Sobaniec-Lotowska ME, Lebensztejn DM. 2019. The combination of fecal calprotectin with ESR, CRP and albumin discriminates more accurately children with Crohn’s disease. Adv Med Sci. 64(1):9–14. doi:10.1016/j.advms.2018.08.001.
- Dankel SN, Røst TH, Kulyté A, Fandalyuk Z, Skurk T, Hauner H, Sagen JV, Rydén M, Arner P, Mellgren G. 2019. The Rho GTPase RND3 regulates adipocyte lipolysis. Metabolism. 101:153999. doi:10.1016/j.metabol.2019.153999.
- Daperno M, D’haens G, Van Assche G, Baert F, Bulois P, Maunoury V, Sostegni R, Rocca R, Pera A, Gevers A, et al. 2004. Development and validation of a new, simplified endoscopic activity score for Crohn’s disease: the SES-CD. Gastrointest Endosc. 60(4):505–512. doi:10.1016/S0016-5107(04)01878-4.
- Dong H, Sun Q, Zhang Y, Li Y, Yuan F, Mao S, Liu B. 2021a. Genetic deletion of Rnd3 suppresses apoptosis through NF κB signaling in the brain. Oncol Rep. 45(2):595–605. doi:10.3892/or.2020.7884.
- Dong S, Tian Q, Zhu T, Wang K, Lei G, Liu Y, Xiong H, Shen L, Wang M, Zhao R, et al. 2021b. SLC39A5 dysfunction impairs extracellular matrix synthesis in high myopia pathogenesis. J Cell Mol Med. 25(17):8432–8441. doi:10.1111/jcmm.16803.
- Ford MM. 2021. Crohn’s disease obstructions. Clin Colon Rect Surg. 34(4):227–232. doi:10.1055/s-0041-1729926.
- Geiser J, De Lisle RC, Andrews GK. 2013. The zinc transporter Zip5 (Slc39a5) regulates intestinal zinc excretion and protects the pancreas against zinc toxicity. PLoS One. 8(11):e82149. doi:10.1371/journal.pone.0082149.
- Guo C, Shen J. 2021. Cytoskeletal organization and cell polarity in the pathogenesis of Crohn’s disease. Clin Rev Allergy Immunol. 60(2):164–174. doi:10.1007/s12016-020-08795-5.
- Guo FX, Wu Q, Li P, Zheng L, Ye S, Dai XY, Kang CM, Lu JB, Xu BM, Xu YJ, et al. 2019. The role of the LncRNA-FA2H-2-MLKL pathway in atherosclerosis by regulation of autophagy flux and inflammation through mTOR-dependent signaling. Cell Death Differ. 26(9):1670–1687. doi:10.1038/s41418-018-0235-z.
- Hennigar SR, Kelley AM, McClung JP. 2016. Metallothionein and zinc transporter expression in circulating human blood cells as biomarkers of zinc status: a systematic review. Adv Nutr. 7(4):735–746. doi:10.3945/an.116.012518.
- Hirao-Suzuki M, Koga T, Sakai G, Kobayashi T, Ishii Y, Miyazawa H, Takiguchi M, Sugihara N, Toda A, Ohara M, et al. 2020. Fatty acid 2-hydroxylase (FA2H) as a stimulatory molecule responsible for breast cancer cell migration. Biochem Biophys Res Commun. 531(2):215–222. doi:10.1016/j.bbrc.2020.07.043.
- Hong SN, Joung JG, Bae JS, Lee CS, Koo JS, Park SJ, Im JP, Kim YS, Kim JW, Park WY, et al. 2017. RNA-seq reveals transcriptomic differences in inflamed and noninflamed intestinal mucosa of Crohn’s disease patients compared with normal mucosa of healthy controls. Inflamm Bowel Dis. 23(7):1098–1108. doi:10.1097/MIB.0000000000001066.
- Hornschuh M, Wirthgen E, Wolfien M, Singh KP, Wolkenhauer O, Däbritz J. 2021. The role of epigenetic modifications for the pathogenesis of Crohn’s disease. Clin Epigenet. 13(1):108. doi:10.1186/s13148-021-01089-3.
- Hu X, Li J, Fu M, Zhao X, Wang W. 2021. The JAK/STAT signaling pathway: from bench to clinic. Signal Transduct Target Ther. 6(1):402. doi:10.1038/s41392-021-00791-1.
- Langfelder P, Horvath S. 2008. WGCNA: an R package for weighted correlation network analysis. BMC Bioinform. 9:559. doi:10.1186/1471-2105-9-559.
- Lee CH, Yoon H, Oh DJ, Lee JM, Choi YJ, Shin CM, Park YS, Kim N, Lee DH, Kim JS. 2020. The prevalence of sarcopenia and its effect on prognosis in patients with Crohn’s disease. Intest Res. 18(1):79–84. doi:10.5217/ir.2019.00107.
- Ma C, Jairath V, Vande Casteele N. 2019. Pharmacology, efficacy and safety of JAK inhibitors in Crohn’s disease. Best Pract Res Clin Gastroenterol. 38–39:101606. doi:10.1016/j.bpg.2019.03.002.
- McCombie WR, McPherson JD, Mardis ER. 2019. Next-generation sequencing technologies. Cold Spring Harb Perspect Med. 9:11.
- Melia JMP, Lin R, Xavier RJ, Thompson RB, Fu D, Wan F, Sears CL, Donowitz M. 2019. Induction of the metal transporter ZIP8 by interferon gamma in intestinal epithelial cells: potential role of metal dyshomeostasis in Crohn’s disease. Biochem Biophys Res Commun. 515(2):325–331. doi:10.1016/j.bbrc.2019.05.137.
- Moon SY, Kim KD, Yoo J, Lee JH, Hwangbo C. 2021. Phytochemicals targeting JAK-STAT pathways in inflammatory bowel disease: insights from animal models. Molecules. 26(9):2824. doi:10.3390/molecules26092824.
- Mukai T, Egawa M, Takeuchi T, Yamashita H, Kusudo T. 2017. Silencing of FABP1 ameliorates hepatic steatosis, inflammation, and oxidative stress in mice with nonalcoholic fatty liver disease. FEBS Open Bio. 7(7):1009–1016. doi:10.1002/2211-5463.12240.
- Pareek CS, Smoczynski R, Tretyn A. 2011. Sequencing technologies and genome sequencing. J Appl Genet. 52(4):413–435. doi:10.1007/s13353-011-0057-x.
- Robinson MD, McCarthy DJ, Smyth GK. 2010. Edger: a bioconductor package for differential expression analysis of digital gene expression data. Bioinformatics. 26(1):139–140. doi:10.1093/bioinformatics/btp616.
- Saarikoski ST, Rivera SP, Hankinson O, Husgafvel-Pursiainen K. 2005. CYP2S1: a short review. Toxicol Appl Pharmacol. 207(2):62–69. doi:10.1016/j.taap.2004.12.027.
- Sulz MC, Burri E, Michetti P, Rogler G, Peyrin-Biroulet L, Seibold F. 2020. Treatment algorithms for Crohn’s disease. Digestion. 101(Suppl. 1):43–57. doi:10.1159/000506364.
- Tsai IT, Wu CC, Hung WC, Lee TL, Hsuan CF, Wei CT, Lu YC, Yu TH, Chung FM, Lee YJ, et al. 2020. FABP1 and FABP2 as markers of diabetic nephropathy. Int J Med Sci. 17(15):2338–2345. doi:10.7150/ijms.49078.
- Wang X, Gao H, Wu W, Xie E, Yu Y, He X, Li J, Zheng W, Wang X, Cao X, et al. 2019. The zinc transporter Slc39a5 controls glucose sensing and insulin secretion in pancreatic β-cells via Sirt1- and Pgc-1α-mediated regulation of Glut2. Protein Cell. 10(6):436–449. doi:10.1007/s13238-018-0580-1.
- Wei R, Quan J, Li S, Liu H, Guan X, Jiang Z, Wang X. 2021. Integrative analysis of biomarkers through machine learning identifies stemness features in colorectal cancer. Front Cell Dev Biol. 9:724860. doi:10.3389/fcell.2021.724860.
- Wooller SK, Benstead-Hume G, Chen X, Ali Y, Pearl FMG. 2017. Bioinformatics in translational drug discovery. Biosci Rep. 37(4):372017. doi:10.1042/BSR20160180.
- Xie D, Zhang Y, Qu H. 2018. Crucial genes of inflammatory bowel diseases explored by gene expression profiling analysis. Scand J Gastroenterol. 53(6):685–691. doi:10.1080/00365521.2018.1461923.
- Xu P, Becker H, Elizalde M, Pierik M, Masclee A, Jonkers D. 2021. Interleukin-28A induces epithelial barrier dysfunction in CD patient-derived intestinal organoids. Am J Physiol Gastrointest Liver Physiol. 320(5):G689–G699. doi:10.1152/ajpgi.00064.2020.
- Yao Y, Yang X, Sun L, Sun S, Huang X, Zhou D, Li T, Zhang W, Abumrad NA, Zhu X, et al. 2019. Fatty acid 2-hydroxylation inhibits tumor growth and increases sensitivity to cisplatin in gastric cancer. EBiomedicine. 41:256–267. doi:10.1016/j.ebiom.2019.01.066.
- Zabana Y, Lorén V, Domènech E, Aterido A, Garcia-Jaraquemada A, Julià A, Vicario M, Pedrosa E, Ferreiro M, Troya J, et al. 2020. Transcriptomic identification of TMIGD1 and its relationship with the ileal epithelial cell differentiation in Crohn’s disease. Am J Physiol Gastrointest Liver Physiol. 319(2):G109–G120. doi:10.1152/ajpgi.00027.2020.
- Zhang B, Horvath S. 2005. A general framework for weighted gene co-expression network analysis. Stat Appl Genet Mol Biol. 4:17. doi:10.2202/1544-6115.1128.
- Zheng X, Li M, Wu Y, Lin X, Zhang Z, Zheng W, Wang M. 2020. Assessment of pediatric Crohn’s disease activity: validation of the magnetic resonance enterography global score (MEGS) against endoscopic activity score (SES-CD). Abdom Radiol. 45(11):3653–3661. doi:10.1007/s00261-020-02590-8.