
Abstract
There is an urgent need to explore and validate novel biomarkers relevant to patients with myocardial infarction (MI), which is the leading cause of death in the world. Dysregulated microRNAs (miRNAs) and messenger RNAs (mRNAs) based on two Gene Expression Omnibus microarrays were analyzed using bioinformatics technology and experiments. KEGG and GO enrichment analyses were performed to explore potential mechanisms of myocardial infarction progression. Immune infiltration analysis was used to assess the relationship between the immune microenvironment and myocardial infarction. The DOX-induced myocardial injury model was used to simulate myocardial infarction. qRT-PCR was performed to validate the expression of hub genes. 5 downregulated miRNAs and 14 upregulated mRNAs were identified in total. Functional analysis revealed that some immune-related pathways were significantly enriched. T cells CD8+ were mainly enriched in the normal tissues compared to the myocardial infarction tissues. Meanwhile, the T cells CD4+ memory resting were highly enriched in the myocardial infarction tissues compared to the normal tissues. Experimental validation of miRNAs and mRNAs contributed to the identification of 4 miRNAs and 12 mRNAs that may play a crucial role in the DOX-induced myocardial infarction cell model. Our study successfully identified several genes that may be related to myocardial infarction progression.
Introduction
Myocardial infarction (MI) is a common ischemic heart disease, which is usually caused by acute coronary artery occlusion (Zou et al. Citation2019). It involves tissue-disruptive and sterile proinflammatory responses, and has become the leading cause of death worldwide (Arslan et al. Citation2011; Marchant et al. Citation2012). MI can cause damage to cardiomyocytes and lead to the formation of fibrotic scars, which may eventually lead to heart failure (Deshmukh et al. Citation2019). Acute MI (AMI) is characterized by acute onset and the consequences seriously threaten the person’s health (Fan et al. Citation2019). The characteristic changes caused by MI are irreversible damage. With the development of basic research and clinical practice, the therapeutic targets of patients with MI are still in urgent need.
MicroRNAs (miRNAs) are short non-coding RNA molecules with 22–24 nucleotides. Recent reports have indicated that miRNAs have been identified to be key regulators in heart diseases and are involved in the cardiac signaling and transcription pathway (Alfar et al. Citation2018). Therefore, miRNAs can regulate heart function and cardiac pathology. Wang et al. have revealed a novel regulating model, which is APF/miR-188-3p/ATG7 axis in the heart (Wang et al. Citation2015). Besides, Gao et al. found that miR-19a/19b plays an important role in cardiac regeneration and protection from myocardial infarction (Gao et al. Citation2019). In other studies, miR-302-367 functions as a key component of the Hippo/Yap pathway that can regulate cardiomyocyte proliferation and heart regeneration, and it has been demonstrated that miR-34a can enhance cardiomyocyte proliferation and regeneration in response to MI (Tian et al. Citation2015; Yang et al. Citation2015). Meanwhile, messenger RNAs (mRNAs) are also identified as diagnostic biomarkers for MI and can assess MI progression (Ortiz-Sánchez et al. Citation2019; Yuan et al. Citation2019). Nonetheless, there are still few studies illustrating the miRNA-mRNA regulatory network in MI disease.
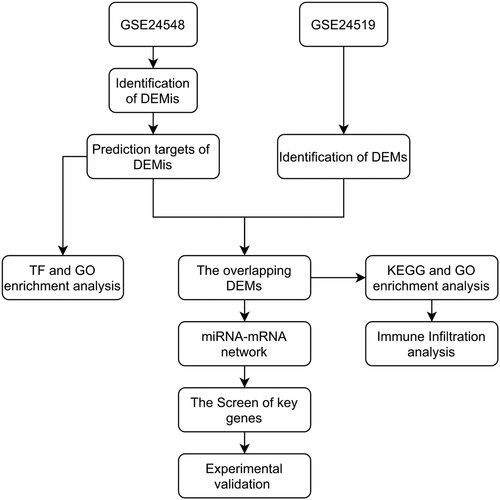
In our study, we first retrieved the miRNAs and mRNAs microarray data and paired control data of MI patients. We constructed the miRNA-mRNA network according to the ceRNA mechanism and theory (Ebert and Sharp Citation2010) (Figure ). Our study confirmed a few credible miRNAs and identified potential pathological mechanisms and targets for MI patients via bioinformatic analysis.
Figure 1. The flowchart of the whole study.
Materials & methods
Data source and filtering criteria
MI patients’ miRNA (GSE24548) and mRNA (GSE24519) microarray data sets were downloaded from Gene Expression Omnibus (GEO) (https://www.ncbi.nlm.nih.gov/geoprofiles). The miRNA expression profile performed on the platform GPL8227 included 4 first acute MI (FAMI) patients and 3 controls. And the mRNA expression profile data performed on the platform GPL2895 included 34 FAMI patients and 4controls.
The limma package in R studio was performed to get the differentially expressed miRNAs (DEMis) and mRNAs (DEMs) from the MI microarray profile data. First, the series matrix data were normalized with the logarithmic function (log2). More than one gene mapped into the same probe and genes with opposite different expression results were deleted. The average expression value is equal to the expression value of the gene if multiple probes are located in the same gene. The DEMis and DEMs were filtered by the adjusted P-value <0.05 and |log FC| > 0.5. Volcano plots and heatmaps were drawn by the plot and heatmap packages in the R studio and an online platform (http://www.bioinformatics.com.cn/).
Screening of potential transcription factors and GO analysis of DEMis
The FunRich (3.1.3) software was used to identify the enriched transcription factors (TFs) regulating target genes of DEMis and analysis of the biological process (BP), cellular component (CC), and molecular function (MF) of miRNAs (Hou et al. Citation2019).
Predicted targets of DEMis
The targeted mRNAs of DEMis were predicted by using the miRWalk database (http://mirwalk.umm.uni-heidelberg.de/). We eventually obtained DEMi-DEM pairs after matching the DEMs in the previously selected mRNA microarray.
miRNA-mRNA network
All the DEMi-DEM pairs were imported into the Cytoscape software (version 3.8.2) to construct the miRNA-mRNA network. Then, we uploaded all the mRNAs to the STRING database (http://www.string-db.org/) to get the PPI network. Lastly, the miRNA-mRNA network and PPI network were merged into a final network. Meanwhile, the node degrees, closeness, and betweenness scores of the network were assessed.
GO and pathway analysis
We uploaded all the mRNAs to the KOBAS 3.0 (http://kobas.cbi.pku.edu.cn/kobas3/?t=1) and David database (https://david.ncifcrf.gov/tools.jsp). The GO terms and pathways with P < 0.05 were considered statistically significant.
Immune infiltration analysis
To estimate the proportion of infiltrating immune cells, normalized gene expression data of GSE24519 was uploaded to HiPlot software (version 0.1.0). The proportion of infiltrating immune cells was calculated with the CIBERSORT algorithm, the rank-sum test was used for comparison between groups, and the Spearman correlation coefficient was used to describe the association between the proportion of immune cells and gene expression. P < 0.05 was considered statistically significant.
The myocardial injury model
The H9C2 cells derived from rat embryonic heart tissue were obtained from the Cell Bank of Shanghai Institutes for Biological Sciences. The myocardial injury model is that the H9C2 cells were cultured in DMEM containing doxorubicin (DOX, 2 µM) (Solaribio, Life Science, Beijing, China) for 24 h (Chen, Jiang, et al. Citation2019). Besides, we also used the isoproterenol (ISO, 0.1 mg/ml) to treat H9C2 cells for 24 h to construct the H9C2 cell injury model. The follow-up experiments were then conducted based on our previous study.
Flow cytometry
After the myocardial infarction model was constructed, the supernatant of each group of cells was collected separately. The H9C2 cells in each group were digested with trypsin and resuspended in DMEM and supernatant, centrifuged at 1300 rpm for 5 min, and the supernatant then discarded. The cells were resuspended in 200 µL buffer, 10 µL Annexin V-FITC was added, and incubated for 10 min at room temperature. Then the cells were resuspended in 200 µL buffer again after centrifugation (1000 rpm, 5 min), followed by the addition of 5 µL propidium iodide (PI). Cells were incubated for 15 min at 4°C in the dark. The apoptosis rate of each group of cells was then detected by flow cytometry (BD Accuri™ C6 PLUS), with the experiment being repeated three times.
RT and qRT-PCR
Total RNA was obtained from H9C2 cells by using TRIzol reagent (Invitrogen, CA, USA), and the whole experimental procedure was performed according to previous study (Lin et al. Citation2022). The mRNA and miRNA primers were designed and synthesized by Sangon (Shanghai, China) and RiboBio (Guangzhou, China) respectively. The results were analyzed by using the 2−ΔΔCt method. The primer sequences are shown in Supplementary Table 1 and 2.
Statistical analysis
Difference between the two groups was assessed using the Student’s t-test. The adjusted P-value was obtained using the Benjamini and Hochberg method. And adjusted P-value <0.05 was considered significant.
Results
The screening results of DEMis in MI microarray data
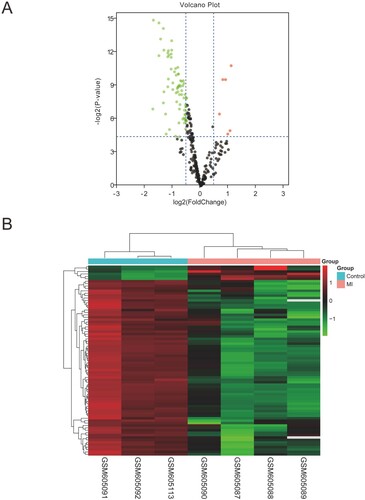
The DEMis data retrieved from GEO was analyzed according to the filtering criterion (|logFC| > 0.5, adjusted P < 0.05) described before. We identified 63 dysregulated DEMis, including 4 upregulated miRNAs and 59 downregulated miRNAs. The volcano plot and heatmap were drawn to show the distribution and differential expression of DEMis between MI and healthy groups (Figure (A,B)).
Figure 2. The screening results of DEMis. (A) Volcano plot of differentially expressed miRNAs (|log2FC| > 0.5, adjusted P < 0.05). (B) The differential expression heatmap of miRNAs.
GO and TF enrichment analysis of DEMis
For TFs enrichment analysis, we imported 63 dysregulated DEMis to FunRich (3.1.3) software and identified 29 miRNAs (Table ). Meanwhile, we chose the top 10 TFs which had a strong closeness to DEMis via exploring the enrichment of transcription factor. And it is indicated that the TFs including SP1, EGR1, SP4, POU2F1, NKX6-1, MEF2A, PBX1, FOXA1, LHX3, and YY1 are in regulatory relationships with DEMis (Figure (A)).
Figure 3. GO and transcription factor enrichment analysis of DEMis. (A) The transcription factor enrichment analysis of DEMis. (B) The cellular component terms related to DEMis in GO enrichment analysis. (C) The biological process terms related to DEMis in GO enrichment analysis. (D) The molecular function terms related to DEMis in GO enrichment analysis.
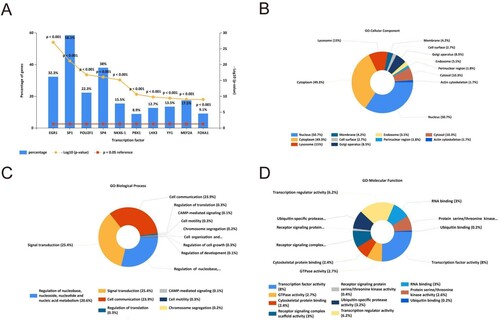
Table 1. The differentially expressed miRNAs.
Next, we performed the GO enrichment analysis. The CC terms showed that the most enrichment targets of miRNAs may be positioned in the nucleus, cytoplasm, lysosome, and golgi apparatus (Figure (B)). And the BP terms showed that most miRNAs were involved in signal transduction; cell communication; regulation of nucleobase, nucleoside, nucleotide, and nucleic acid metabolism (Figure (C)). As to the MF terms, most of the genes were related to transcription factor activity, transcription regulatory activity, ubiquitin-specific protease activity, receptor signaling complex scaffold activity, GTPase activity, and RNA binding, etc. (Figure (D)).
The screening results of DEMs in MI microarray data
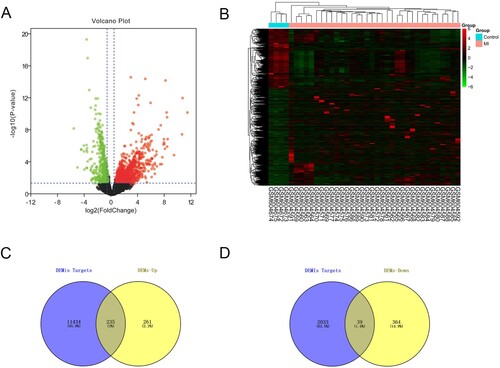
We downloaded the GSE24519 microarray data from the GEO database, and the microarray data were collected from 34 MI patients and 4 healthy controls. The threshold value was as described before (|logFC| > 0.5, adjusted P-value < 0.05). Then, we confirmed 496 upregulated and 403 downregulated genes after deleting the repeated or unidentified genes (Figure (A,B)). Meanwhile, we used the miRWalk database to predict the potential downstream targets of miRNAs. At length, we selected the intersection of upregulated DEMs and downregulated-miRNAs’ target genes (or downregulated-DEMs’ and upregulated miRNAs’ target genes) for further analysis (Figure (C,D)).
Figure 4. The screening results of DEMs. (A) Volcano plot of differentially expressed mRNAs (|log2FC| > 0.5, adjusted P < 0.05). (B) The differential expression heatmap of mRNAs. (C and D) Venn diagram was drawn to show the overlapping genes between up-/down-regulated miRNA targets and up-/down- regulated mRNAs.
The miRNA-mRNA network in MI
We first imported DEMs and DEMis to the Cytoscape software (version 3.8.2) to construct the initial miRNA-mRNA network (Figure (A)). Then, we utilized the cytoHubba plugin of Cytoscape software to calculate the parameters of degree, closeness, and betweenness in the miRNA-mRNA network. We thus filtered the top 10 key genes in these three algorithms (Figure (B–D)). After that, we took the intersection of the top ten genes screened in the three algorithms and finally obtained five key miRNAs (hsa-miR-15a-3p, hsa-miR-139-3p, hsa-miR-17-3p, has-miR-24-1-5p, and hsa-miR-326) (Figure (E)). The results of the three algorithms are presented in Table .
Figure 5. Construction of miRNA-mRNA network. (A) The network of all the DEMis and DEMs. (B) The top 10 genes with shortest paths in the betweenness algorithm analysis. (C) The top 10 genes with shortest paths in the closeness algorithm analysis. (D) The top 10 genes with shortest paths in the degree algorithm analysis. (E) The overlapping genes of betweenness, closeness, and degree analysis results.
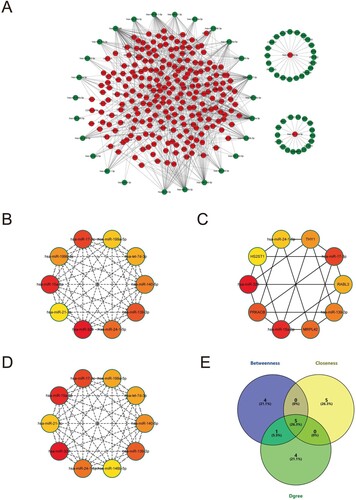
Table 2. The overlapping miRNAs of Degree, Closeness, and Betweenness algorithm analysis.
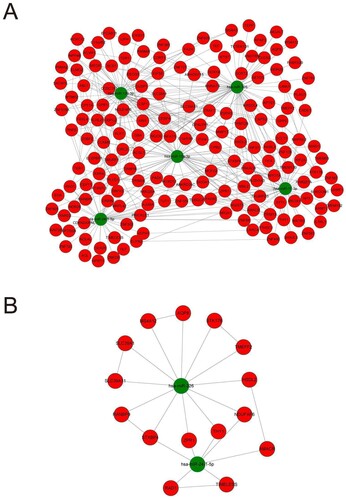
The results of the previous analysis can be tentatively considered the 5 miRNAs as key genes in the whole network, so our further study will focus on these five genes and their targets. We first imported the miRNAs and mRNAs into the Cytoscape software to produce the initial ceRNA network. Meanwhile, we also imported the mRNAs into the String database to construct the PPI network. In the end, we merged the two networks to obtain the final ceRNA network (Figure (A)). MCODE in Cytoscape was used to perform module analysis. And we found that 2 miRNAs and 15 mRNAs were in the module (MCODE score = 3.125), as shown in Figure (B). This module included 17 nodes and 25 edges. Therefore, the genes in the module may be key indicators of the disease that causes myocardial infarction.
Figure 6. The final ceRNA network and its sub-network. (A) The final ceRNA network consisted of 5 miRNAs and their targets. (B) The key module of final network.
Functional enrichment analysis of DEMs in the miRNA-mRNA network
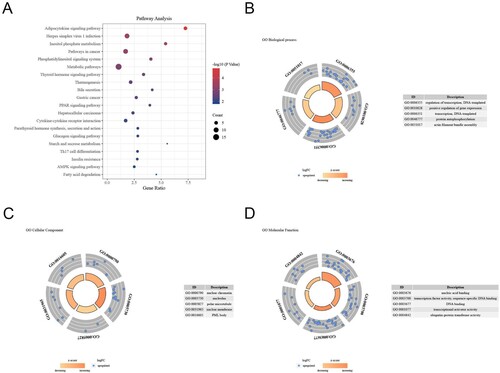
As shown in Figure , the relationships between DEMs and the top 10 enriched pathways are shown in the bubble chart (Figure (A)). DEMs’ GO analysis indicated that the BP terms were mostly and significantly enriched in regulation of transcription, DNA templated, positive regulation of gene expression, protein autophosphorylation, and actin filament bundle assembly, etc. (Figure (B)). And the CC terms were significantly enriched in the nuclear chromatin, nucleolus, polar microtubule, nuclear membrane, and PML body, etc. (Figure (C)). Moreover, the MF terms were mainly enriched in nucleic acid binding, transcription factor activity, sequence-specific DNA binding, DNA binding, transcriptional activator activity, and ubiquitin-protein transferase activity kinase activity, etc. (Figure (D)). Afterward, we confirmed a total of 5 miRNAs and 15 mRNAs.
Figure 7. GO and pathway analysis of DEMS in the miRNA-mRNA network. (A) The top 10 pathways related to DEMs were shown in the bubble chart. (B) The biological process terms related to DEMs in GO enrichment analysis. (C) The cellular component terms related DEMs in GO enrichment analysis. (D) The molecular function terms related DEMs in GO enrichment analysis.
Immune infiltration analysis of GSE24519
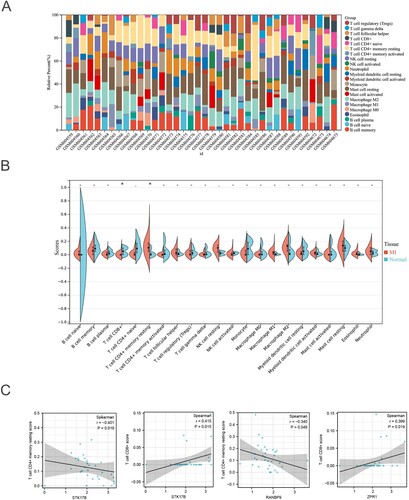
According to the results of pathway analysis, an association existed between the DEMs and some immune-related pathways. The proportion of infiltrating immune cells of the samples from the GSE24519 was analyzed through the CIBERSORT algorithm and visualized in Figure (A). The results showed that CD8+ T cells are mainly enriched in normal tissues compared to the MI tissues, while the CD4 + memory resting T cells are highly enriched in MI tissues compared to normal tissues (Figure (B)). Moreover, we also explored the relationship between hub DEMs and the immune infiltration level. Results suggested that STK17B is negatively correlated with the CD4+ memory resting T cells enrichment score, and positively correlated with the CD8+ T cell enrichment score. Besides, RANBP9 is also negatively correlated with the CD4+ memory resting T cells enrichment score, and ZPR1 is positively correlated with the CD8+ T cell enrichment score (Figure (C)). Together, dysregulation of hub genes may lead to an altered immune microenvironment, resulting in the MI progression.
Figure 8. Immune analysis of GSE24519: (A) The proportion of immune cells. (B) The difference analysis of immune cell enrichment scores between MI and normal tissues. (C) The correlation analysis between hub genes and specific immune cells.
Validation of DEMis and DEMs expression
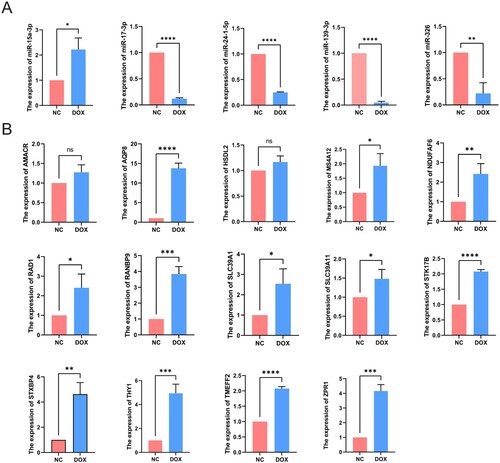
The flow cytometry was used to validate the cell model for DOX-induced MI; compared with the NC group, the apoptosis rate of H9C2 cells in the DOX group was significantly increased (Supplementary Figure 1). After the 15 differentially expressed mRNAs and 5 differentially expressed miRNAs were screened by bioinformatical analysis, we verified the expression levels of these differential genes in the H9C2 cell model by using qRT-PCR. As shown in Figure (A), we found that 4 of 5 miRNAs (miR-139-3p, miR-17-3p, miR-24-1-5p, and miR-326) are indeed downregulated in the MI model. In contrast, the expression of miR-15a-3p was upregulated in H9C2 cells. Meanwhile, we verified that RAD1, THY1, NDUFAF6, TMEFF2, STK17B, AQP8, MS4A12, SLC39A1, SLC39A11, RANBP9, STXBP4, and ZPR1 are indeed upregulated in the H9C2 cell model. Otherwise, there was no significant difference in the expression of AMACR and HSDL2 between NC group and DOX group (Figure (B)). Then, we also detected the expression of hub genes in NC and ISO-induced myocardial injury cell model, and we found similar results mentioned above. However, the expression level of hsa-miR-139-3p and hsa-miR-24-1-5p were different to what was expected. Moreover, the rest hub genes also exhibited similar expression trends, indicating that these key genes we discovered may be involved in the pathogenesis of myocardial infarction (Supplementary Figure 2 and 3).
Figure 9. Validation of DEMis and DEMs expression. (A) The qRT-PCR results of key miRNAs. (B) The qRT-PCR results of key mRNAs.
Discussion
Myocardial infarction is the leading cause of death worldwide and often the leading cause of sudden death (Bayés de Luna and Guindo Citation1990; Eguchi et al. Citation2019). Also, the proliferation and differentiation of cardiomyocytes to maturity during cardiac development is particularly complex, and it involves transcriptional and epigenetic regulation of multiple genes. Earlier studies suggested that cardiomyocytes at the end of differentiation would then exit the cell cycle and the cells themselves would lose their ability to proliferate (Xin et al. Citation2013). When the adult heart is damaged by factors such as ischemia and hypoxia, the myocardial cells can no longer regenerate themselves, and then scarring and large infarcts will slowly form, which can seriously affect the heart's pumping function and lead to the death of the body (van Rooij Citation2016; Gao et al. Citation2019). In recent years, there has been a lot of research in the cardiovascular direction and many efforts have been made to promote cardiovascular health in humans, but myocardial infarction is still the leading cause of mortality and morbidity (Smith et al. Citation2007; Gyöngyösi et al. Citation2016, Citation2018). Myocardial hypertrophy, cardiomyocyte apoptosis, and myocardial fibrosis are pathological changes following myocardial infarction but with unclear mechanisms (McCarroll et al. Citation2018; Ramasamy et al. Citation2018). Therefore, the mechanism of cardiac repair is what we urgently need now; it can not only help us find more treatments for myocardial infarction disease but also advance the further development of scientific research. Our study is to predict genes that may play a role in myocardial infarction through bioinformatic analysis and also to validate them for further study.
In our study, we firstly screened the differentially expressed genes by GEO database, then used Cytoscape software to construct the miRNA-mRNA network, and then combined with cytoHubba plugin to calculate the hub genes. This algorithm for identifying key genes has also been used in other studies (Fu et al. Citation2021; Luo et al. Citation2021), and we finally identified 5 miRNAs and 15 mRNAs as hub genes for the development of myocardial infarction. miRNAs are short non-coding RNAs usually between 18 and 22 nucleotides long which have the ability to post-transcriptionally control mRNA/protein expression by inhibiting translation or promoting degradation of target mRNA (Fasolo et al. Citation2019). And due to their small size, it has been predicted that miRNAs have the ability to modulate most mammalian genes and play an essential role in the progression of diseases (Ha and Kim Citation2014). Furthermore, due to the hairpin structure of precursor miRNA, their processing results in the generation of −3p and −5p strands, which can bind complementary and distinct mRNAs. miRNAs have been therefore put forward as pivotal regulators of mRNA and protein expression owing to their unique characteristics. The previous review reported that miRNAs could be a potential molecular therapeutic strategy for cardiovascular disease (Kwekkeboom et al. Citation2014; Samanta et al. Citation2016).
Our study found that the 4 miRNAs and 11 mRNAs might exert effects on the development of MI. We therefore searched the PubMed database and found that 4 mRNAs (SLC39A1, AQP8, THY1, and ZPR1) have been studied, but no research has studied the rest of genes in cardiovascular diseases. From our analysis, these 4 miRNAs and 11 mRNAs as key genes were shown to be differentially expressed in the myocardial infarction disease. After searching the PubMed database, it has been reported that hsa-miR-139-3p can inhibit the migration, invasion, proliferation of cancer cells and alleviate the progression of cervical cancer, hepatocellular carcinoma (HCC), and HPV-16-induced carcinoma (Sannigrahi et al. Citation2017; Wang et al. Citation2019; Xu et al. Citation2020); In non-oncological diseases, miR-139-3p could also attenuate ischemic stroke injury through the miR-139-3p/SMAD3/Bcl2 signal axis (Yang et al. Citation2022); has-miR-17-3p can be upregulated by METTL3 to improve rat cardiomyocyte proliferation and subsequently ameliorate MI (Zhao et al. Citation2021); hsa-miR-17-3p can also affect the sorafenib resistance in HCC and improve the accuracy of Traditional Chinese Medicine (TCM) syndrome classification in hepatitis B virus-caused liver cirrhosis (Awan et al. Citation2017; Liu et al. Citation2017); hsa-miR-326 can regulate the progression of cardiac hypertrophy through blocking JAK/STAT and MAPK signaling pathways and promote the progression of non-small cell lung cancer (Chen, Liu, et al. Citation2019; Zhang et al. Citation2020); hsa-miR-15a-3p can induce apoptosis in human cancer cell lines (Druz et al. Citation2013) and attenuate diabetic retinal angiogenesis in RF/6A cells (Zhu et al. Citation2022); a recent clinical study found that a high expression of miR-24-1-5p is associated with an increased risk of recurrence of prostate cancer after radical prostatectomy (Stikbakke et al. Citation2022) and upregulation of miR-24 expression initiated angiogenesis by targeting PHD1 after cerebral hemorrhage (Cui et al. Citation2020). And most mRNAs were involved in the progression of cancer, being able to regulate the migration, invasion, and proliferation of cancer cells (Shen-Ong et al. Citation2003; Dalerba et al. Citation2011; Sun et al. Citation2014; Dai et al. Citation2016; Otaka et al. Citation2017; Lan et al. Citation2018; Bianco et al. Citation2019; Ding et al. Citation2019; Jia et al. Citation2019; Lopes et al. Citation2019).
Next, we synthesized 5 miRNAs and 14 mRNAs primers screened before, and used qRT-PCR to detect gene expression levels in a DOX-induced MI cell model. Furthermore, we also detected the expression level of these hub genes in an ISO-induced MI cell model. The results show that, except for individual genes, most of them have similar expression trends, indicating that these genes may be involved in the physiological process of myocardial infarction. And it can partly express that our study is correct and meaningful for myocardial infarction disease. Nevertheless, there are limitations to the overall study. Although a simple validation of our predicted genes was performed, it cannot be fully demonstrated that they can indeed influence the development of myocardial infarction. Because only gene pathways were predicted and simply validated, the study still lacks further research, but it can be a crucial reference for future studies. In the meantime, although a few genes may differ from what we expected, this can still help us find a novel direction for further study.
Conclusions
In the present study, based on the GEO microarray data, bioinformatic analysis, and experimental verification, we not only identified and detected 3 differentially expressed miRNAs in MI but also acquired 12 hub genes that might induce MI progression. And the immune infiltration analysis suggested that dysregulation of hub genes may lead to altered immune microenvironment, resulting in MI progression. These findings of our study can serve as a crucial reference for future research and might provide reliable candidate biomarkers for the development of MI disease.
Authors’ contributions
LJ Wang and JC Liu designed the plan. LJ Wang, BQ Qiu, and HX Zou collected the data and wrote the manuscript. CW Gong and SQ Lai analyzed the data and assisted BQ Qiu in performing the experiments. All authors participated in the discussion of the interpretation of data for the work. JJ Xu, YB Wu, and JC Liu provided the guidance and corrections of experiments and manuscript. All authors have approved the final manuscript and agreed to be accountable for all aspects of the work.
Supplemental Material
Download Zip (489.3 KB)Acknowledgements
We acknowledge GEO, and other databases for providing their platforms and contributors for uploading their meaningful datasets.
Disclosure statement
No potential conflict of interest was reported by the author(s).
Data availability statement
The microarray data that support the findings of this study are available in the Gene Expression Omnibus database at https://www.ncbi.nlm.nih.gov/geoprofiles. The data of experiments in this study are included in the Figshare database (https://doi.org/10.6084/m9.figshare.20280393.v1).
Additional information
Funding
References
- Alfar EA, El-Armouche A, Guan K. 2018. MicroRNAs in cardiomyocyte differentiation and maturation. Cardiovasc Res. 114(6):779–781. doi:10.1093/cvr/cvy065.
- Arslan F, de Kleijn DP, Pasterkamp G. 2011. Innate immune signaling in cardiac ischemia. Nat Rev Cardiol. 8(5):292–300. doi:10.1038/nrcardio.2011.38.
- Awan FM, Naz A, Obaid A, Ikram A, Ali A, Ahmad J, Naveed AK, Janjua HA. 2017. MicroRNA pharmacogenomics based integrated model of miR-17-92 cluster in sorafenib resistant HCC cells reveals a strategy to forestall drug resistance. Sci Rep. 7(1):11448. doi:10.1038/s41598-017-11943-1.
- Bayés de Luna A, Guindo J. 1990. Sudden death in ischemic heart disease. Rev Port Cardiol. 9(5):473–479.
- Bianco JN, Bergoglio V, Lin Y-L, Pillaire M-J, Schmitz A-L, Gilhodes J, Lusque A, Mazières J, Lacroix-Triki M, Roumeliotis TI, et al. 2019. Overexpression of Claspin and Timeless protects cancer cells from replication stress in a checkpoint-independent manner. Nat Commun. 10(1):910. doi:10.1038/s41467-019-08886-8.
- Chen C, Jiang L, Zhang M, Pan X, Peng C, Huang W, Jiang Q. 2019. Isodunnianol alleviates doxorubicin-induced myocardial injury by activating protective autophagy. Food Funct. 10(5):2651–2657. doi:10.1039/C9FO00063A.
- Chen H-T, Liu H, Mao M-J, Tan Y, Mo X-Q, Meng X-J, Cao M-T, Zhong C-Y, Liu Y, Shan H, Jiang G-M. 2019. Crosstalk between autophagy and epithelial-mesenchymal transition and its application in cancer therapy. Mol Cancer. 18(1):101. doi:10.1186/s12943-019-1030-2.
- Cui H, Yang A, Zhou H, Wang Y, Luo J, Zhou J, Liu T, Li P, Zhou J, Hu E, et al. 2020. Thrombin-induced miRNA-24-1-5p upregulation promotes angiogenesis by targeting prolyl hydroxylase domain 1 in intracerebral hemorrhagic rats. J Neurosurg. 134(5):1515–1526.
- Dai H, Lv YF, Yan GN, Meng G, Zhang X, Guo QN. 2016. RanBP9/TSSC3 complex cooperates to suppress anoikis resistance and metastasis via inhibiting Src-mediated Akt signaling in osteosarcoma. Cell Death Dis. 7(12):e2572. doi:10.1038/cddis.2016.436.
- Dalerba P, Kalisky T, Sahoo D, Rajendran PS, Rothenberg ME, Leyrat AA, Sim S, Okamoto J, Johnston DM, Qian D, et al. 2011. Single-cell dissection of transcriptional heterogeneity in human colon tumors. Nat Biotechnol. 29(12):1120–1127. doi:10.1038/nbt.2038.
- Deshmukh V, Wang J, Martin JF. 2019. Leading progress in heart regeneration and repair. Curr Opin Cell Biol. 61:79–85. doi:10.1016/j.ceb.2019.07.005.
- Ding B, Lou W, Xu L, Li R, Fan W. 2019. Analysis the prognostic values of solute carrier (SLC) family 39 genes in gastric cancer. Am J Transl Res. 11(1):486–498.
- Druz A, Chen YC, Guha R, Betenbaugh M, Martin SE, Shiloach J. 2013. Large-scale screening identifies a novel microRNA, miR-15a-3p, which induces apoptosis in human cancer cell lines. RNA Biol. 10(2):287–300. doi:10.4161/rna.23339.
- Ebert MS, Sharp PA. 2010. MicroRNA sponges: progress and possibilities. RNA (New York, NY). 16(11):2043–2050.
- Eguchi S, Takefuji M, Sakaguchi T, Ishihama S, Mori Y, Tsuda T, Takikawa T, Yoshida T, Ohashi K, Shimizu Y, et al. 2019. Cardiomyocytes capture stem cell-derived, anti-apoptotic microRNA-214 via clathrin-mediated endocytosis in acute myocardial infarction. J Biol Chem. 294(31):11665–11674. doi:10.1074/jbc.RA119.007537.
- Fan YZ, Huang H, Wang S, Tan GJ, Zhang QZ. 2019. Effect of lncRNA MALAT1 on rats with myocardial infarction through regulating ERK/MAPK signaling pathway. Eur Rev Med Pharmacol Sci. 23(20):9041–9049.
- Fasolo F, Di Gregoli K, Maegdefessel L, Johnson JL. 2019. Non-coding RNAs in cardiovascular cell biology and atherosclerosis. Cardiovasc Res. 115(12):1732–1756. doi:10.1093/cvr/cvz203.
- Fu Y, Liu Q, Bao Q, Wen J, Liu Z, Hu Y, He G, Peng C, Xu Y, Zhang W. 2021. Development and analysis of long non-coding RNA-associated competing endogenous RNA network for osteosarcoma metastasis. Hereditas. 158(1):9. doi:10.1186/s41065-021-00174-0.
- Gao F, Kataoka M, Liu N, Liang T, Huang Z-P, Gu F, Ding J, Liu J, Zhang F, Ma Q, et al. 2019. Therapeutic role of miR-19a/19b in cardiac regeneration and protection from myocardial infarction. Nat Commun. 10(1):1802. doi:10.1038/s41467-019-09530-1.
- Gyöngyösi M, Haller PM, Blake DJ, Martin Rendon E. 2018. Meta-Analysis of cell therapy studies in heart failure and acute myocardial infarction. Circ Res. 123(2):301–308. doi:10.1161/CIRCRESAHA.117.311302.
- Gyöngyösi M, Wojakowski W, Navarese EP, Moye L. 2016. Meta-Analyses of human cell-based cardiac regeneration therapies. Circ Res. 118(8):1254–1263. doi:10.1161/CIRCRESAHA.115.307347.
- Ha M, Kim VN. 2014. Regulation of microRNA biogenesis. Nat Rev Mol Cell Biol. 15(8):509–524. doi:10.1038/nrm3838.
- Hou Y, Wang Y, Xu S, Qi G, Wu X. 2019. Bioinformatics identification of microRNAs involved in polycystic ovary syndrome based on microarray data. Mol Med Rep. 20(1):281–291. doi:10.3892/mmr.2015.3387.
- Jia L-H, Hu M-D, Liu Y, Xiong X, Wang W-J, Wang J-G, Li Q-G. 2019. Hsdl2 promotes bladder cancer growth in vitro and in vivo. Int J Med Sci. 16(5):654–659. doi:10.7150/ijms.31288.
- Kwekkeboom RF, Lei Z, Doevendans PA, Musters RJ, Sluijter JP. 2014. Targeted delivery of miRNA therapeutics for cardiovascular diseases: opportunities and challenges. Clin Sci (Lond). 127(6):351–365. doi:10.1042/CS20140005.
- Lan Y, Han J, Wang Y, Wang J, Yang G, Li K, Song R, Zheng T, Liang Y, Pan S, et al. 2018. STK17B promotes carcinogenesis and metastasis via AKT/GSK-3β/Snail signaling in hepatocellular carcinoma. Cell Death Dis. 9(2):236. doi:10.1038/s41419-018-0262-1.
- Lin X-H, Liu Z-Y, Zhang D-Y, Zhang S, Tang W-Q, Li D-P, Zhang F, Chen R-X, Weng S-Q, Xue R-Y, Dong L. 2022. circRanGAP1/miR-27b-3p/NRAS Axis may promote the progression of hepatocellular Carcinoma. Exp Hematol Oncol. 11(1):92. doi:10.1186/s40164-022-00342-6.
- Liu Y, Wang M, Luo Y, Chen J, Lu Y, Shi Y, Tang C, Zhou Q, Zhang H, Hu Y, et al. 2017. MiRNA-target network analysis identifies potential biomarkers for Traditional Chinese Medicine (TCM) syndrome development evaluation in hepatitis B caused liver cirrhosis. Sci Rep. 7(1):11054. doi:10.1038/s41598-017-11351-5.
- Lopes JL, Chaudhry S, Lopes GS, Levin NK, Tainsky MA. 2019. FANCM, RAD1, CHEK1 and TP53I3 act as BRCA-like tumor suppressors and are mutated in hereditary ovarian cancer. Cancer Genet. 235-236:57–64.
- Luo X, Tu T, Zhong Y, Xu S, Chen X, Chen L, Yang F. 2021. Cerna network analysis shows that lncRNA CRNDE promotes progression of glioblastoma through sponge mir-9-5p. Front Genet. 12:617350. doi:10.3389/fgene.2021.617350.
- Marchant DJ, Boyd JH, Lin DC, Granville DJ, Garmaroudi FS, McManus BM. 2012. Inflammation in myocardial diseases. Circ Res. 110(1):126–144. doi:10.1161/CIRCRESAHA.111.243170.
- McCarroll CS, He W, Foote K, Bradley A, McGlynn K, Vidler F, Nixon C, Nather K, Fattah C, Riddell A, et al. 2018. Runx1 deficiency protects against adverse cardiac remodeling after myocardial infarction. Circulation. 137(1):57–70. doi:10.1161/CIRCULATIONAHA.117.028911.
- Ortiz-Sánchez P, Villalba-Orero M, López-Olañeta MM, Larrasa-Alonso J, Sánchez-Cabo F, Martí-Gómez C, Camafeita E, Gómez-Salinero JM, Ramos-Hernández L, Nielsen PJ, et al. 2019. Loss of SRSF3 in cardiomyocytes leads to decapping of contraction-related mRNAs and severe systolic dysfunction. Circ Res. 125(2):170–183. doi:10.1161/CIRCRESAHA.118.314515.
- Otaka Y, Rokudai S, Kaira K, Fujieda M, Horikoshi I, Iwakawa-Kawabata R, Yoshiyama S, Yokobori T, Ohtaki Y, Shimizu K, et al. 2017. Stxbp4 drives tumor growth and is associated with poor prognosis through PDGF receptor signaling in lung squamous cell carcinoma. Clin Cancer Res. 23(13):3442–3452. doi:10.1158/1078-0432.CCR-16-1815.
- Ramasamy S, Velmurugan G, Rekha B, Anusha S, Shanmugha Rajan K, Shanmugarajan S, Ramprasath T, Gopal P, Tomar D, Karthik KV, et al. 2018. Egr-1 mediated cardiac miR-99 family expression diverges physiological hypertrophy from pathological hypertrophy. Exp Cell Res. 365(1):46–56. doi:10.1016/j.yexcr.2018.02.016.
- Samanta S, Balasubramanian S, Rajasingh S, Patel U, Dhanasekaran A, Dawn B, Rajasingh J. 2016. MicroRNA: a new therapeutic strategy for cardiovascular diseases. Trends Cardiovasc Med. 26(5):407–419. doi:10.1016/j.tcm.2016.02.004.
- Sannigrahi MK, Sharma R, Singh V, Panda NK, Rattan V, Khullar M. 2017. Role of host miRNA Hsa-miR-139-3p in HPV-16-induced carcinomas. Clin Cancer Res. 23(14):3884–3895. doi:10.1158/1078-0432.CCR-16-2936.
- Shen-Ong GL, Feng Y, Troyer DA. 2003. Expression profiling identifies a novel alpha-methylacyl-CoA racemase exon with fumarate hydratase homology. Cancer Res. 63(12):3296–3301.
- Smith RR, Barile L, Cho HC, Leppo MK, Hare JM, Messina E, Giacomello A, Abraham MR, Marbán E. 2007. Regenerative potential of cardiosphere-derived cells expanded from percutaneous endomyocardial biopsy specimens. Circulation. 115(7):896–908. doi:10.1161/CIRCULATIONAHA.106.655209.
- Stikbakke E, Wilsgaard T, Haugnes HS, Pedersen MI, Knutsen T, Støyten M, Giovannucci E, Eggen AE, Thune I, Richardsen E. 2022. Expression of miR-24-1-5p in tumor tissue influences prostate cancer recurrence: the PROCA- study. Cancers. 14(5).
- Sun T, Du W, Xiong H, Yu Y, Weng Y, Ren L, Zhao H, Wang Y, Chen Y, Xu J, et al. 2014. TMEFF2 deregulation contributes to gastric carcinogenesis and indicates poor survival outcome. Clin Cancer Res. 20(17):4689–4704. doi:10.1158/1078-0432.CCR-14-0315.
- Tian Y, Liu Y, Wang T, Zhou N, Kong J, Chen L, Snitow M, Morley M, Li D, Petrenko N, et al. 2015. A microRNA-Hippo pathway that promotes cardiomyocyte proliferation and cardiac regeneration in mice. Sci Transl Med. 7(279):279ra38.
- van Rooij E. 2016. Cardiac repair after myocardial infarction. N Engl J Med. 374(1):85–87. doi:10.1056/NEJMcibr1512011.
- Wang K, Liu C-Y, Zhou L-Y, Wang J-X, Wang M, Zhao B, Zhao W-K, Xu S-J, Fan L-H, Zhang X-J, et al. 2015. APF lncRNA regulates autophagy and myocardial infarction by targeting miR-188-3p. Nat Commun. 6:6779. doi:10.1038/ncomms7779.
- Wang X, Gao J, Zhou B, Xie J, Zhou G, Chen Y. 2019. Identification of prognostic markers for hepatocellular carcinoma based on miRNA expression profiles. Life Sci. 232:116596. doi:10.1016/j.lfs.2019.116596.
- Xin M, Olson EN, Bassel-Duby R. 2013. Mending broken hearts: cardiac development as a basis for adult heart regeneration and repair. Nat Rev Mol Cell Biol. 14(8):529–541. doi:10.1038/nrm3619.
- Xu YJ, Yu H, Liu GX. 2020. Hsa_circ_0031288/hsa-miR-139-3p/Bcl-6 regulatory feedback circuit influences the invasion and migration of cervical cancer HeLa cells. J Cell Biochem. 121(10):4251–4260. doi:10.1002/jcb.29650.
- Yang J, He W, Gu L, Long J, Zhu L, Zhang R, Zhao Z, Xu B, Nan A, Su L. 2022. CircUSP36 attenuates ischemic stroke injury through the miR-139-3p/SMAD3/Bcl2 signal axis. Clin Sci.
- Yang Y, Cheng H-W, Qiu Y, Dupee D, Noonan M, Lin Y-D, Fisch S, Unno K, Sereti K-I, Liao R. 2015. MicroRNA-34a plays a key role in cardiac repair and regeneration following myocardial infarction. Circ Res. 117(5):450–459. doi:10.1161/CIRCRESAHA.117.305962.
- Yuan X, Pan J, Wen L, Gong B, Li J, Gao H, Tan W, Liang S, Zhang H, Wang X. 2019. MiR-144-3p enhances cardiac fibrosis after myocardial infarction by targeting PTEN. Front Cell Dev Biol. 7:249. doi:10.3389/fcell.2019.00249.
- Zhang J, Wei X, Zhang W, Wang F, Li Q. 2020. MiR-326 targets MDK to regulate the progression of cardiac hypertrophy through blocking JAK/STAT and MAPK signaling pathways. Eur J Pharmacol. 872:172941. doi:10.1016/j.ejphar.2020.172941.
- Zhao K, Yang C, Zhang J, Sun W, Zhou B, Kong X, Shi J. 2021. METTL3 improves cardiomyocyte proliferation upon myocardial infarction via upregulating miR-17-3p in a DGCR8-dependent manner. Cell Death Discov. 7(1):291. doi:10.1038/s41420-021-00688-6.
- Zhu Y, Zhao Q, Jiang Y. 2022. Lycium barbarum polysaccharides attenuates high glucose-induced diabetic retinal angiogenesis by rescuing the expression of miR-15a-5p in RF/6A cells. J Ethnopharmacol. 283:114652. doi:10.1016/j.jep.2021.114652.
- Zou J, Fei Q, Xiao H, Wang H, Liu K, Liu M, Zhang H, Xiao X, Wang K, Wang N. 2019. VEGF-A promotes angiogenesis after acute myocardial infarction through increasing ROS production and enhancing ER stress-mediated autophagy. J Cell Physiol. 234(10):17690–17703. doi:10.1002/jcp.28395.