
 ?Mathematical formulae have been encoded as MathML and are displayed in this HTML version using MathJax in order to improve their display. Uncheck the box to turn MathJax off. This feature requires Javascript. Click on a formula to zoom.
Abstract
Field experiments were conducted to determine the effect of tillage practices and inorganic sources of different combinations of nitrogen, phosphorus, and potassium fertilizers on some physical properties of soil and the yield of oats. The main plots were tillage techniques of no-till (T1), tillage with a cultivator (T2), twice-disc harrow (T3), and moldboard plowing (T4). Split-plots were fertilizer treatments of F1 control without fertilizer, 70:45:50 kg ha−1 NPK (F2), 140:90:100 kg ha−1 NPK (F3), 210:135:150 kg ha−1 NPK (F4), and 280:180:200 kg ha−1 NPK (F5). Soil density, acidity, electrical conductivity, and soil organic carbon increased under T1, while saturated hydraulic conductivity decreased compared with other tillage practices. Soil bulk density and pH increased with increasing sampling depth, while electrical conductivity and soil organic carbon declined with depth. Results from this study indicated a reduction in saturated hydraulic conductivity with time. The highest grain yield was found in the T4 and T3. In contrast, the highest grain yield was observed under F4 and F5 fertilization treatments at location 1 and F5 and F4 treatments at location 2. There were significant differences in growth characteristics and yield components due to the influence of tillage practices and fertilization levels in both experiment locations.
Introduction
The primary outcome of crop production is yield. Yield is affected and limited by many factors. The determinants of productivity in field crops can be divided into a few basic groups: soil conditions, soil fertility, factors of agricultural techniques, and meteorological conditions (Karing et al. Citation1999; Ramadhan Citation2013). Some of these cases can be affected by agricultural technology. Soil tillage is an important part of farming activities, it affects the properties of the soil, the growth of crops, the revenue of the farm, and the environment. Tillage practices should avoid the degradation of soil properties and help create a sustainable environment without a reduction in crop yield.
Inadequate management practices might have an impact on soil degradation. Continuous moldboard plow (CMT) had the highest bulk density (1.49 g cm−3), the lowest soil organic content (3.68 g kg−1), and the lowest ability of soil moisture retention in an area of cultivated soil that has recently been reclaimed. Furthermore, no-till, followed by sub-soiling and no-till (NT) was linked to the highest soil moisture content (20.42%) and the largest soil organic matter (6.48 g kg−1) in the surface layer. Moreover, NT and subsoiling followed by moldboard afterwards subsoiling enhanced maize yield by 12.9% and 14.9%, respectively, over CMT, reaching 8512.6 kg ha−1 and 8740.9 kg ha−1 (Liua et al. Citation2021). In two different soil conditions in a semi-arid region of Morocco, the influence of the no-till approach on the physical attributes of the soil was explored. The shift from a conventional tillage technique to a no-till approach enhanced the soil's organic content and bulk density, which improved the tolerance of these regions to the impact of climate change (El Mekkaoui et al. Citation2023). After four cropping cycles, an investigation of the effects of medium-range tillage practices in gray terrace soil of Bangladesh revealed that the conservational tillage practices had the highest organic content buildup and the highest value of root mass density of wheat and rice. Deep tillage and conventional tillage resulted in lower bulk density values, whereas zero tillage resulted in greater values. Yet, after a period of four years, bulk density reduced as a result of tillage techniques, with zero tillage having the greatest reduction in density. The agricultural practice of deep tillage resulted in the greatest wheat grain output, with conventional tillage ranking second in terms of productivity. On the other hand, zero tillage yielded the lowest grain yield (Alam et al. Citation2014).
Conservative tillage methods are used specifically to conserve soil and soil water content and to create a sustainable environment. Although the application of conservative tillage varies from region to region, the main reason for its popularity is the effectiveness in controlling erosion, weeds, and the amount of yield it produces. Moreover, no-till has become more attractive to farmers because it reduces production costs relative to conventional tillage (DeVita et al. Citation2007). The no-till approach has been adopted worldwide as a strategy to reduce the negative effects of soil erosion caused by conventional tillage (Cavalieri et al. Citation2009). The successful adoption and implementation of no-till are highly dependent on the farmer's knowledge of the technology used in such a system, as well as the texture and condition of the soil and the prevailing climatic conditions. Experience in other countries has shown that conservation tillage practices can improve rainwater use by increasing infiltration. However, the tools used for conservation tillage in other countries are too heavy and too expensive for small farmers.
The main threats to soils have been identified by the European Environment Agency (Communities Citation2002). One of them is soil compaction, the intensity of which is estimated by the bulk density of the soil and the total porosity. Some studies (Salem et al. Citation2015; Jat et al. Citation2018) showed that conservation tillage practices increased the bulk density of soil at the soil surface compared to conventional tillage practices. Even though no-till or reduced tillage is one of the management strategies that can be used to get a benefit in terms of carbon sequestration and erosion control, reducing energy use (Nassir et al. Citation2016; Souza et al. Citation2018), and improving soil quality and crop productivity, the impacts of no-till and reduced tillage on crop performance in combination with fertilizers have not been sufficiently investigated, especially in salt-affected soils.
Since chemical fertilizers are efficient in augmenting soil fertility, they have become a crucial element of modern crop production techniques. There is no alternative to chemical fertilizers that is fully adequate (NFDC Citation1997). The response of crops to applied fertilizers is dependent on factors such as soil management methods, the type and fertility of the soil, as well as the timing, dosages, and administration techniques of the fertilizer. The evaluation of the viability of transitioning from chemical-based agricultural techniques to organic fertilizers relies on the crucial factor of maintaining crop productivity levels while minimizing adverse impacts on the farming community (Ghosh Citation2004).
Nitrogen is an essential component of crop productivity, because it has an impact on the rate of yield, and insufficient availability will lead to lower yield in grain crops (Shah et al. Citation2003). Adding optimum nitrogen rates to the crop may allow a higher yield. The use of nitrogen fertilizers, although often required to increase the grain yield, may also reduce the quality of the physical grain. Excessive nitrogen will lead to an increase in the vegetative mass of crops and an increase in plant height, which will result in delayed grain ripening and prolongation of the vegetation period (Wang et al. Citation2017), and crop lodging which can significantly reduce yield. Phosphorus is an essential nutrient. Phosphorus increases tillering and is involved in root development and protein synthesis (War and Shaktawat Citation2003). Early in crop development, an adequate supply of phosphorus is essential for the initiation of primitive leaves and flowers (Richards et al. Citation1985). Compared with nitrogen, relatively little information has been published on the effects of phosphorus and potassium nutrition on oats, although the importance of early-season phosphorus supply for yield formation in field crops is well documented. Potassium is a vital nutrient for plant growth. Agricultural data generated in the past often showed an erratic and inconsistent response to potassium application under different agroclimatic conditions. The role of potassium in water use and uptake of other nutrients is critical for enhancing crop resistance to drought, waterlogging, frost, and leaf disease, and maintaining straw and stem strength (Zhang et al. Citation2020).
The selection of appropriate tillage practices, the amount of chemical fertilizers added, and their role in determining the yield of oats are important areas that require further understanding. Keeping these facts in view, due to the lack of studies on the performance of targeted oats from different soil tillage practices, and despite the efforts that have been made in the field of fertilization, there is no unified recommendation for fertilizers in the agricultural sector. Considering the aforementioned facts and in order to get more evidence, the study was planned to test the hypothesis that selecting the appropriate tillage practice and the better combination of inorganic fertilizers would affect the system productivity of oats. The specific objectives of this study were to (1) assess the impact of various tillage techniques on oat productivity, NPK absorption, and soil health; (2) study the impact of various inorganic fertilizers combinations on the productivity of oat, and NPK absorption; and (3) assess the impact of tillage techniques and duration after each practice on saturated hydraulic conductivity and its relation with soil bulk density. The study was conducted in two different locations to identify the most appropriate tillage technique and fertilizer rate depending on the characteristics of the location determined by soil types.
Materials and methods
Study area
The field experiment was conducted on a private farm belonging to a local farmer, in two locations during the 2021–2022 agricultural season. The site of the first experiment is located in the Al-Qurnah area, 75 km northwest of Basrah 30°56′32.9"N 47°27′47.4"E, while the second site is located in the Shatt Al-Arab region, 18 km east of the center of Basrah province 30°34′14.1"N 47°48′43.4"E (Figure ). The physical properties and chemical state of the primary soil are summarized in Table . Meteorological data during the growing season are shown in Figure .
Figure 1. Geographical location and aerial map of the two study locations.
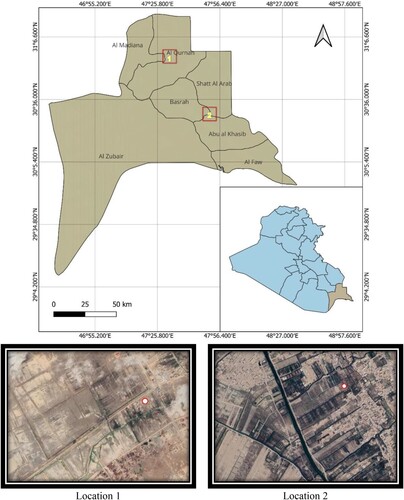
Figure 2. Average monthly precipitation, humidity and air temperature.
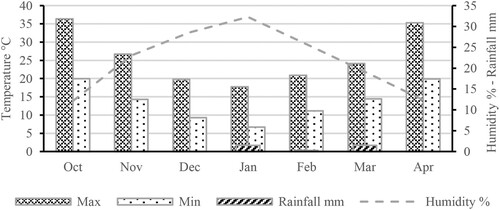
Table 1. Characteristics of the soil selected for the experimental locations.
Land preparation
The experimental plots were 4.5 m long and 2.4 m wide. The plots were separated with a buffer zone of 1.5 and 2 m between each plot and block, respectively, at both locations. Healthy and uniformly sized seeds of oats (var. Shifa) were planted at a seeding rate of 120 kg ha−1 on 16 November 2021, in the first and second locations. Seeds were sown in a row with a spacing of 15 cm between each row. Every routine experimental management practice was carried out uniformly at both locations during the study periods.
Experimental design and treatments description
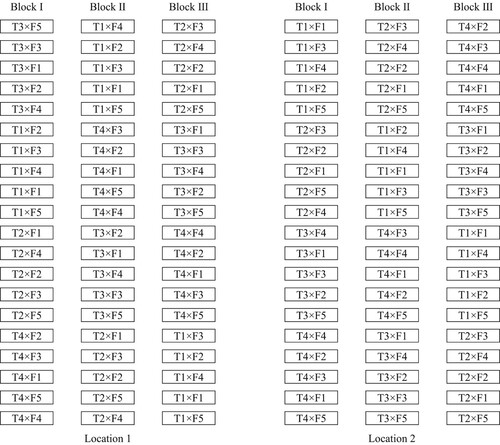
The experiment was performed as a split-plot in a randomized complete block design with three replicates in both testing locations. Experimental factors included methods of tillage (T1: no tilling, a narrow slot is opened to deposit the seeds and no other soil tillage is done, T2: tillage by tiller to 6–8 cm, T3: disc harrow was used twice to a depth of 15 cm, T4: plowing by moldboard to a depth of 24–26 cm from the soil surface) in the main plots, and different levels of combined application of NPK fertilizers (non-fertilizer (control) (F1), 70:45:50 kg ha−1 NPK (F2), 140:90:100 kg ha−1 NPK (F3), 210:135:150 kg ha−1 NPK (F4), 280:180:200 kg ha−1 NPK (F5)) in the subplots (Figure ). Nitrogen was given in the form of urea. Triple superphosphate and muriate of potash were used as sources for P2O5 and K2O. A full dose of phosphorus and potassium fertilizers were added at the time of sowing. Nitrogen application was split into three doses at the time of sowing, the beginning of tillering, and the beginning of stem elongation according to the Zadoks’ scale. Fertilizer application was at the same distribution dynamics at both experimental locations.
Figure 3. Field layout of the experiment with three replicates at both locations.
Plant sampling procedures
Oats samples were collected in the first week of April at both planting sites. The crop was cut at ground level. Threshing and cleaning of grain were carried out separately. The grain yield of oats was converted to yield per hectare after data were collected from a one-square-meter section of each plot.
Plant analyses
Grain and straw samples were analyzed separately at harvest. Grain and straw samples were ground separately and each sample was mixed well after grinding and used to determine the percentage of N, P and K. A mass of 0.2 g was taken from each sample after passing through a 1 mm diameter sieve. Then, the sample was digested with sulfuric acid and then by mixture of 4% perchloric acid (HClO4) + 96% sulfuric acid (H2SO4) with heating until the formation of clear solution (Cresser and Parsons Citation1979). The digestion product was transferred to a 50 ml volumetric flask to estimate the percentage of N, P and K. Total nitrogen was determined by Kjeldahl distillation. Phosphorus concentration was determined in digested samples using the spectrophotometer at a wavelength of 882 nm. Potassium content in samples was determined using a flame photometer.
Root analyses
Root mass density was measured during the GS70 stage according to the Zadoks’ growth stage at three random locations within each plot, then averaged for each plot. The samples were taken from the midpoint between rows with a diameter of 15 cm and a length of 22.5 cm. Mesh bags were then used to store the samples. After passing the soil through a sieve of 0.5 mm, the roots were washed thoroughly. The root's dry matter was measured after it was dried at 70 ± 5°C to a consistent weight. Then the mass density of the root was calculated using the following equation (Schuurman and Goedewaagen Citation1965): Root mass density = root mass/volume of the soil sample mg cm−3.
Soil sampling
A composite sample was collected randomly before experimenting from 0 to 30 cm depth (0–10, 10–20 and 20–30 cm) with three replications for determination of the initial soil properties. Additionally, in each treatment, five samples of undisturbed soil for each replicate were randomly collected at the crop harvest from soil depth ranges 0–10, 10–20, and 20–30 cm for determination of the studied soil properties. Core samples were taken using cylinders of 5 cm in diameter and 10 cm in height. Data were averaged across five fertilizer treatments. Samples were processed according to the procedures described in (Campbell Citation1994) for bulk density determination. The bulk density of the soil was calculated using the following equation, ρb = m/v, Where: ρb = bulk density of soil (g cm−3), m = dry soil sample mass (g), v = volume of sample (cm3).
Soil analyses
Soil EC was measured by a Jenway 4510 Conductivity/TDS meter in the saturated soil paste extract. A pH meter was used to determine the soil's pH (Jenway 3505 pH/mV/Temperature Meter) with a 1:2.5 soil-water ratio. Soil organic carbon (SOC) was measured by the wet oxidation method of Walkley and Black. Soil organic matter (SOM) for initial soil properties determination was measured by (Walkley and Black Citation1934) method. The content of available N was measured by the NaOH hydrolyzation diffusion method (Rayment and Lyons Citation2011). Soil available P was assayed by the sodium bicarbonate NaHCO3 method (Sparks et al. Citation2020). Available K was measured by using the ammonium acetate extraction method (Rayment and Lyons Citation2011). Sodium was extracted with ammonium acetate solution. Na in the extract was determined by flame photometry (Estefan et al. Citation2013). Ca was determined by the titration complex method. Mg was determined using the NH4OAC extraction method (Black Citation1965). Bicarbonate was determined in soil saturation extract by titration. Chloride was obtained in the saturation extract, and its concentration in the extract was determined by silver nitrate titration. Particle size distribution was done using the hydrometer method and the composition class was determined using the USDA textural triangle.
Saturated hydraulic conductivity measurements
Saturated hydraulic conductivity (Ks) m sec−1 was measured based on the constant hydraulic head method, by imposing a constant hydraulic head on the top of the cores. Tests were performed on three replicated undisturbed samples collected from the first week after planting to the seventh week from 0–10, 10–20 and 20–30 cm depths, then averaged for each tillage practice. Samples were slowly saturated with water from the bottom for about 12 h before the conductivity measurements to eliminate most of the air in the pores. Ks was calculated according to the following formula (Hillel Citation1998):
where Q is the volume of water flowing per unit of time L3 T−1, A is the cross-sectional area of the soil column L2, q is the flux L T−1, Ks is the saturated hydraulic conductivity L T−1, ΔH/D is the hydraulic gradient (dimensionless numbers), ΔH is the hydraulic head drop across the soil column L, D is the length of the column L.
Data analysis
All experimental data were analyzed using GenStat v16 (www.vsni.co.uk). The analysis of variance for agricultural characteristics and physicochemical soil characteristics was carried out using the ANOVA technique. When the F-test showed a significant difference, the means were compared using the least significant difference (LSD) tests. All comparisons were made at the 0.05 probability level. Production of maps was carried out using QGIS software.
Results
Crop results
Weight of a thousand grains
The weight of 1000 grains characterizes the maturity of the grain, its tissue density, and the amount of endosperm in a grain, which influences the grain weight (Zavalin et al. Citation2001). The results of the statistical analysis showed that the weight of the thousand grains was significantly affected by the tillage practices, the application of fertilizers, and the interaction between them for both planting locations. It is noted from Table that the weight of the thousand grains was significantly affected by the tillage practices, and the treatments T4 and T3 gave the highest average of 23.45 and 23.32 g in the first location, while the treatments T3 and T4 gave the highest average of 29.61 and 28.23 g in the second location, respectively, without a significant difference between the two treatments, while the lowest average for treatment T1 in the first location (19.91 g) and T1 and T2 (22.12 and 23.85 g), without a significant difference between them, in the second location.
Table 2. Effect of tillage practices, fertilizer combination levels, and interaction on the studied traits at both experimental locations.
The application of fertilizers positively and significantly affected the studied indicator, which led to an increase in the weight of 1000 grains (Table ). The fertilization treatments F4 and F5 recorded the highest average weight of one thousand grains of 24.49 and 24.02 g in the first location, while the treatments F4, F5 and F3 recorded the highest rates of 28.97, 28.16 and 26.37 g in the second location, without significant difference between them, compared to the F1 treatment, which recorded 19.34 g in the first location, and the F1 and F2 treatments (21.82 and 24.45 g, respectively) without a significant difference between them in the second location.
The results showed a significant effect of the interaction between tillage practices and fertilizer levels in the first location. The interaction treatments T4×F4 and T3×F5 gave the highest average weight of one thousand grains without significant difference between them, as they reached 27.70 and 26.95 g, respectively, while the interaction treatment T1×F1 gave the lowest weight of 16.22 g (Table ).
Number of grains in the panicle
It is noted from Table that the tillage practices, fertilizer levels, and the interaction between them have a significant effect on the number of grains in the panicle, as it is noted from the data of the first location that the T4 tillage treatment was significantly superior (50.73 grains panicle−1), which in turn did not differ statistically from the practice of T3 (48.73 grains panicle−1), while the treatment of T1 and T2 recorded the lowest value, which were 45.20 and 47.27 grains panicle−1, both treatments were on par with each other. In the second location, the number of grains increased gradually with the increase in the intensity of plowing, however, it did not reach a decisive level of significance.
The results of the statistical analysis indicate that there is an effect of fertilizer rates on the number of grains in the panicle. The results of Table show that F4 and F5 treatments showed superiority without significant difference between them (52.58 and 51.25 grains panicle−1, respectively, in the first location, and 47.50 and 47.33 grains panicle−1, respectively, in the second location), while F1 treatment recorded the lowest average of number of grains in the panicle in both locations as it was 42.25 and 37.00 grains panicle−1 in the first and second location, respectively.
The results of the statistical analysis also showed that there were significant differences among the interaction treatments between the tillage practices and the levels of fertilizer in the number of grains in the panicle in the first location. The interaction treatment T4×F4 gave the highest average number of grains in the panicle amounting to 56.67 grains panicle−1, which did not differ statistically from the interaction treatments of T4×F5 and T3×F5, while the interaction treatment T1×F1 gave the lowest mean of number of grains in the panicle of 38.67 grains panicle−1 without being statistically different from the interactions T1×F2 and T3×F1 and T4×F1. In the second location, the maximum number of grains in the panicle (50.67 grains panicle−1) was recorded in the interaction treatment T4×F4, followed by T3×F4, T2×F5, T3×F5 and T3×F3 without significant difference among them. The interaction treatment T1×F1 showed the minimum number of grains in the panicle 33.00 grains panicle−1, which was statistically at par with the T2×F1 interaction treatment (Table ).
Number of panicles m−2
The number of panicles m−2 was investigated under different tillage treatments at both experiment locations and the data are shown in Table . The results show a significant effect of the tillage practices in this trait, as the treatment T4 outperformed, recording 445.87 and 444.00 panicle m−2 respectively in the first and second locations, which in turn at both experiment locations, did not show a statistically significant difference from T3, meanwhile, the amount of panicles was 368.67 and 400.53 panicle m−2 in the first and second location, respectively, for treatment T1 without significant difference from treatment T2 in both locations.
Fertilizer treatments significantly affected the number of panicles m−2 in both planting locations. The data reported in Table demonstrates that the fertilizer treatments with the highest count of panicles in the first location were F4, F5, F3, and F2, which amounted to 434.83, 425.00, 408.58, and 406.58 panicles m−2 respectively without a significant difference between them, compared to the lowest number of panicle in the fertilizer treatment F1 which gave 337.08 panicles m−2. The F4 treatment (448.08 panicles m−2) was statistically superior to that of F5 and F3 in the second location, while the minimum number of panicles (358.75 panicles m−2) was observed in the F1 treatment.
Grain yield
The treatment averages for grain yield under tillage practices and fertilizer rates, and the interaction between them are presented in Table . The means due to the tillage practices were significant for the grain yield, the highest mean of the grain yield was 5830.62 kg ha−1 in the first location when applying the T4 tillage treatment, while the T1 tillage treatment gave the lowest mean of the grain yield amounting to 3411.51 kg ha−1. In the second location, the results of the statistical analysis showed the superiority of tillage treatments T4 and T3 by recording the highest average grain yield of 6043.70 and 5349.92 kg ha−1, respectively, while the lowest grain yield amounted to 3469.49 kg ha−1 for T1 treatment. The results indicated that the tillage treatment T2 did not exhibit a statistically significant difference when compared to the aforementioned treatment.
The fertilizer rate had a considerable impact on grain production, as seen in Table . The highest yield of oats was achieved in both study locations in F4 and F5 treatment (4963.44 and 4862.56 kg ha−1 respectively in the first location and 5491.69 and 5312.22 kg ha−1 respectively in the second location) without a significant difference in oats yield between the two treatments. The lowest yield of 3637.07 and 3839.95 kg ha−1 in the first and second locations, respectively, were recorded for the F1 fertilizer treatment, which in turn did not differ from the F2 tillage treatment in the second location (4387.67 kg ha−1).
Concerning the interaction between the effect of tillage practices and fertilizer treatments, treatment differences are statistically significant. The interaction treatment T4×F4 was superior in the first location by recording the highest rate of grain yield amounting to 7086.71 kg ha−1, while the grain yield reached 2493.28 kg ha−1 for the treatment of T1×F1. In the second location, the interaction treatment T4×F4 scored 7320.77 kg ha−1, in turn did not differ either from the treatments T4×F5, T4×F2, T3×F4 and T3×F3, compared to the lowest average grain yield, which amounted to 2381.63 kg ha−1 under The T1×F1 treatment, which in turn did not differ from the interaction treatments T2×F2, T1×F3 and T1×F4 (Table ).
Plant height
Regarding plant height, the results in Table indicate that there are statistically significant variations among the parameters of the tillage practices. The maximum plant height in the first location was 97.60 cm under the T4 treatment compared to 83.20 cm under the T1 treatment. In the second location, the plant height was 100.00 and 97.33 cm for T4 and T3 tillage treatments without a significant difference between them, compared to 86.33 cm under T1 tillage treatment.
The difference in fertilizer levels had a statistical effect on the plant height of the tested oats cultivar. Plant height increased with increasing fertilizer levels (Table ). The highest plant height was found in the first location under the fertilizer treatments F5, F4, and F3, which were 94.25, 93.33, and 91.92 cm respectively, which were on par with each other, compared to the lowest heights of 86.42 and 88.83 cm respectively for the two treatments of F1 and F2 that showed no statistically significant differences from one another. The fertilizer treatments F4 and F5 with a height of 98.83 and 97.42 cm in the second location were superior to the rest of the treatments without any significant difference between them, compared to the lowest plant height of 88.92 and 92.58 cm for the fertilizer treatments F1 and F2 respectively without significant difference between them.
Stem thickness
Stem thickness was affected by different tillage practices (Table ). Stem thickness varied significantly between tillage practices. The highest thickness of the stem was found to be 4.83 and 4.63 mm in the first location in the two tillage treatments T4 and T3 without significant difference between the two treatments, while the lowest thickness was 4.19 mm in the T1 treatment. In the second location, the highest thickness was found under T3 and T4 treatments (5.22 and 5.21 mm, respectively) without significant difference between the two treatments, compared to 4.20 and 4.27 mm under T1 and T2 treatments, respectively, without significant difference between the two treatments.
The thickness of the stem was also affected by different fertilizer treatments. The highest mean of 4.86 and 4.74 mm was found in the first location and 5.20 and 5.06 mm in the second location under treatments F4 and F5 respectively without significant difference between them. Whereas, the lowest mean of stem thickness was 3.79 and 4.10 mm in the first and second locations, respectively, under F1 treatment (Table ).
The stem thickness ranged from 3.28 to 5.59 mm in the first location and from 3.03 to 5.76 mm in the second location (Table ), where the highest average stem thicknesses of 5.59, 5.47 and 5.41 mm were found in the interaction treatments T4×F4, T2×F5 and T3×F4 respectively without significant difference between them, and the minimum thickness of 3.28 mm in the T1×F1 interaction treatment in the first location. In the second location, the maximum thickness of the stem (5.76 mm) was recorded in the interaction treatment T4×F5 followed by T4×F4, T4×F3, T3×F4, T3×F2 and T3×F5 without a significant difference between them. The T1×F1 interaction treatments showed a minimum stem thickness of 3.03 mm.
Biomass yield
At both locations, the findings from the ANOVA indicated that the above-ground biomass was affected by various techniques of tillage and it was 21,046.60 and 20,293.44 kg ha−1 respectively at the first location and 22,186.08 and 21,532.22 kg ha−1 respectively at the second location for T4 and T3 treatments without statistical difference from each other. Meanwhile, the above-ground biomass was 19,001.07 and 19,541.67 kg ha−1 in the first location and 20,034.98 and 20,759.00 kg ha−1 in the second location under T1 and T2 treatments, respectively, without significantly different from each other (Table ).
The above-ground biomass was also significantly different between the different fertilizer treatments in both experiment locations. In the first location, the highest biomass yield (21,352.44 and 21,185.69 kg ha−1) was found in F5 and F4 respectively without a statistical difference from one another, whereas a lower yield (16,944.87 kg ha−1) was observed in F1 (Table ). In the second location, treatments of F4 and F5 also showed the maximum above-ground biomass (22,209.91 and 22,000.14 kg ha−1, respectively) which was superior to the other different fertilizer treatments, while the lowest above-ground biomass yield was (19,397.49 kg ha−1) in F1.
The findings further indicated that the above-ground biomass exhibited significant differences due to the effect of the interaction between the tillage treatments and the different fertilizer treatments. The results of the comparison between the averages showed that the T4×F5 and T4×F4 interactions were superior to the rest of the interaction treatments by recording the maximum biomass above ground 23,214.75 and 22,629.74 kg ha−1, respectively, compared to the lowest biomass yield, which was 16,130.67 kg ha−1 under the T1×F1. Which in turn did not differ significantly from the interaction treatments T2×F1 and T4×F1. The results of the comparison between the averages in the second location also showed the superiority of the interaction treatments T4×F4 and T4×F5 by recording the maximum biomass amounted to 24,389.14 and 23,345.11 kg ha−1, respectively, without differing from each other significantly, compared to the lowest biomass amounted to 18,446.55 kg ha−1 under the T1×F1 treatment, without exhibiting significant differences from the interaction treatments T2×F1 and T4×F1, respectively (Table ).
Root dry weight
Root dry weight was significantly responsive to the application of different tillage practices for both experiment locations as shown in Table . In the first location, the maximum dry weight of the root (4.455 mg cm−3) was observed in T4, while the minimum (3.736 mg cm−3) was observed in T1, which was statistically on par with the treatment of T2 which recorded 3.913 g. In the second location, T3 and T4 recorded higher root weight compared to the rest of the tillage practices (4.899 and 4.765 mg cm−3, respectively), the two treatments had statistically similar performance, compared to 3.978 mg cm−3 which was recorded under T1.
The results related to root dry weight as presented in Table showed a significant effect of using fertilizer treatments. The maximum root dry weight was 4.448 and 4.296 mg cm−3 in the first location and 5.169 and 4.605 mg cm−3 in the second location under F4 and F5 treatments, respectively, which had statistically similar effects, versus 3.358 mg cm−3 in the first location and 3.987 mg cm−3 in the second location, recorded under F1 treatment.
There was a significant effect of the interaction between different tillage practices and levels of fertilizers used on root dry weight at harvest as shown in Table . The maximum dry weight of the roots was 5.303 and 4.920 mg cm−3 in the first location in the interaction treatments T4×F4 and T2×F5 respectively without significant difference between them, while the lowest dry weight of the roots was 2.803 mg cm−3 recorded under the interaction treatment T1×F1. In the second location, the results of the comparison between the averages showed that the interaction treatments T3×F4 and T2×F5 were significantly superior without a significant difference between them, with 6.097 and 5.443 mg cm−3, respectively, while the lowest dry weight of the roots was 3.177 and 3.357 mg cm��3 under the two interaction treatments T1×F1 and T1×F2 respectively, as they were statistically equivalent to one another.
Percentage of nitrogen in the shoot
With regard to the percentage of nitrogen in the shoot, there were statistically significant differences between the treatments of the different tillage practices in both experiment locations. The results in Table show the superiority of the T4 tillage treatment in the first location, with a maximum mean of 1.317% compared to the lowest mean (1.003 and 1.120%) that was found under the two tillage treatments T1 and T2, respectively, which, from a statistical standpoint, were similar. In the second location, the highest percentage of nitrogen was found in the shoot (1.383 and 1.341%) under T4 and T3 without significant differences between them, in comparison, the lowest nitrogen percentage was found under T1, which amounted to 1.073%.
The analysis of the results showed a beneficial effect of NPK fertilizer treatments on the nitrogen percentage in the oat shoots. The highest percentage of nitrogen was recorded in the first location in the F4 fertilizer treatment (1.222%), which in turn did not differ from the F5 and F3 treatments, compared to the lowest nitrogen percentage of 1.089% obtained under the F1 treatment, which in turn did not differ from the F2 and F3 fertilization treatments. The results of the second location also showed that there were statistically significant differences in the percentage of nitrogen in the shoots, as the highest percentage reached 1.347 and 1.276% for the fertilization treatments F5 and F4 respectively, which were statistically equal to each other, compared to the lowest percentage of nitrogen 1.179% under F1 which were statistically on par with F2 and F3.
Percentage of phosphorus in the shoot
Phosphorus percentage in the shoot was shown to be significantly influenced by tillage, fertilizer treatments, and their interactions, as revealed by the data analysis. The highest phosphorus percentage was observed when T4 and T3 treatments were used (0.439 and 0.433% in the first location respectively and 0.488 and 0.459% in the second location respectively), compared to 0.324 and 0.371% in the first and second location, respectively, under the T1 (Table ).
The results of Table also showed that there were statistically significant differences between the fertilizer treatments in both experiment locations. In the first location, there was a tendency to increase the percentage of phosphorus in the shoot after applying the fertilizer treatments compared to the control. The maximum average reached 0.492 and 0.475% respectively under F4 and F5 treatments, without obvious statistical difference between them, compared to the lowest mean of 0.309% obtained under F1 treatment. In the second location, the F5 and F4 treatments, which were statistically equal to each other, outperformed with a value of 0.462 and 0.448%, respectively, while the lowest was 0.400% under the F1 treatment.
The interaction treatments affected the percentage of phosphorus in the shoot (Table ). The highest percentage of phosphorus (0.597, 0.573 and 0.560%) was observed in the first location under the interaction treatments T4×F5, T4×F4 and T3×F4, respectively, without significant difference between them, while the percentage of phosphorus was 0.223, 0.227 and 0.250% for the interaction treatments T1×F1, T1×F2 and T1×F3, respectively, without significant difference between them. Regarding the results of the second location, the highest phosphorus percentage of 0.515% was found for the interaction treatment T4×F5, which was statistically equal with the treatment of T4×F3, T2×F5, T3×F2, T4×F4, T4×F2, T3×F3 and T3×F4, compared to the lowest percentage of phosphorus in the shoot of 0.300% under the T1×F1, which in turn did not differ from the T1×F3 interaction treatment.
Percentage of potassium in the shoot
Based on the results presented in Table , the percentage of potassium in the shoot was affected by the application of tillage practices and fertilizer levels, which showed statistically significant results. The highest percentage of potassium in the shoot in the first location (0.517 and 0.506%) was recorded in the T4 and T3 tillage treatments, which were statistically equal with each other, compared with the T1 tillage treatment which achieved 0.408%. As for the second location, there were statistically significant differences between the averages of the tillage practices, and the highest (0.545%) and the lowest (0.371%) percentages were recorded under the two tillage treatments T4 and T1, respectively.
It was noticed from the results of Table that the highest percentage of potassium in the shoot was 0.511 and 0.490% when applying the F5 and F4 fertilizer treatment in the first location, without statistically significant differences between them, while the lowest percentage of potassium (0.434%) was observed in the F1 treatment. It was also noticed from the results of data analysis in the second location that the F4 fertilizer treatment recorded the maximum potassium percentage of 0.528%, which was statistically equal to the F5 and F3 treatments, compared to 0.393 and 0.456% for the F1 and F2 treatments without a statistical difference between the two treatments.
As for the interaction between the treatments of the experiment, the maximum percentage of potassium in the shoot was observed under the T4×F5 treatment (0.624%), compared to the lowest percentages of 0.334, 0.364 and 0.379% under the interaction treatments T1×F1, T1×F2 and T2×F3, respectively, which were statistically on par with each other. As for the data of the second location, the highest percentage of potassium (0.657%) was observed under the interaction treatment T4×F4, which in turn did not differ statistically from the interaction treatments T4×F3, T3×F5, T4×F2 and T4×F5 respectively, while the lowest percentage (0.255%) was observed under the influence of the interaction treatment T1×F1, which was also on an equal footing with the T1×F5, T3×F3, T4×F1 and T1×F3 interaction treatments respectively (Table ).
Percentage of nitrogen in the grains
The results obtained for the percentage of nitrogen in grain showed a statistically significant effect as a result of the influence of tillage practices and fertilizer levels and the interaction between them. The effect of tillage practices on the nitrogen percentage of grains was significant. The maximum percentage was calculated in the first location (2.416%) under T4 treatment, while the lowest percentage was under T1 treatment (1.968%). In the second location, the highest percentage of nitrogen was observed in grain under T4 and T3 treatments (2.420 and 2.267%), respectively, without significant difference from each other, while the lowest nitrogen percentage was 1.954% under T1 tillage treatment, which was statistically equal with T2 and T3 (Table ).
The gradual increase in fertilizer levels led to a slight but statistically significant increase in nitrogen percentage in the grains (Table ). The highest mean percentage of nitrogen in the grains was achieved in the first location (2.310%) at F4, in turn, exhibited no significant differences from F5, F3 and F2, while the lowest percentage of nitrogen in the grains (2.015%) was for the F1 treatment, which in turn did not differ from the F2 and F3 treatments. In the second location, the increase in fertilizer levels led to an increase in the nitrogen percentage of the grains. The highest percentage was 2.300% for the F5 treatment without significant difference from F4, F3 and F2, compared to the lowest percentage of 1.981% for the F1 treatment, which was statistically equal with F2 and F3.
The nitrogen content of the grain changed statistically as a result of the interaction between various tillage techniques and fertilizer applications. The highest percentage was recorded in the interaction treatment T4×F5 (2.740%), which did not differ from T2×F4, T4×F4, T4×F2 and T3×F3, compared to the lowest nitrogen percentage in grains 1.705% for T1×F1 treatment, which did not differ statistically from T2×F5, T1×F3, T3×F2, T2×F1 and T1×F2. As for the results of the second location, the highest percentage (2.826%) was observed for the interaction treatment T4×F4, which was statistically equal with T3×F3, T4×F2, T2×F5 and T4×F5, while the lowest percentage of nitrogen was 1.551% under the treatment of T1×F1 without a statistical difference with T2×F1, T2×F4, T3×F2 and T1×F2 (Table ).
Percentage of phosphorus in the grains
The P percentage was significantly variable between different tillage practices in the first location (Table ). The maximum phosphorus percentage in the grains (0.485%) was found in T3 without being significantly different from T4 and T2, while T1 showed the lowest phosphorus percentage (0.374%) without being significantly different from T2. As for the second location, the percentage of phosphorus in the grain varied between different tillage practices, but it did not reach the level of significance.
The percentage of phosphorus in the grains in the first location was higher at the F5 and F4 fertilizers levels without a statistical difference between them (0.506 and 0.478, respectively) (Table ), while the lowest percentages (0.369 and 0.397%, respectively) were observed in the F1 and F2 fertilizer treatments without any significant difference between them. In the second location, the highest percentage of phosphorus was observed in the F4 and F5 treatments (0.673 and 0.656%), which were statistically equal to each other, compared to the lowest percentage of phosphorus of 0.504%, which was statistically equal to the F2 and F3 treatment.
The combination between tillage procedures and fertilizer amounts at the second location had a considerable impact on grain phosphorus, as seen in Table . The percentage of phosphorus in the grains on T4×F4 was significantly greater (0.767%) compared to the rest of the interactions, which was statistically equal to T4×F5, T3×F4, T1×F3, T1×F4, T2×F2, T1×F5, T3×F5, T3×F3, T4×F1, T3×F1, T4×F2, T2×F4, T2× F5 and T3×F2, compared to the lowest level of phosphorus in the grain (0.313%) in T1×F1, which did not differ statistically from T1×F2, T2×F3, T4×F3 and T2×F1.
Percentage of potassium in the grains
Different tillage techniques and fertilizer amounts have a significant impact on the amount of potassium in the grains. Tillage treatments had a significant effect on potassium percentage in grain. The percentage of potassium in grains on T3 and T4 was significantly higher (0.363 and 0.321%, respectively, without a statistical difference between them), compared with T1 and T2, in which the lowest percentages were observed (0.267 and 0.285%, respectively, without a significant difference between them), while the comparison of potassium percentages in grains at the second location indicated a non-significant difference between the treatments (Table ).
Potassium percentage in grains was significantly affected by fertilizer levels at both experiment locations (Table ). The level of F5, which was statistically equal to F4 (0.356 and 0.341%, respectively) was superior to the rest of the levels, while the lowest potassium percentage (0.251%) was observed in the grains under F1 treatment. In the second location, the maximum potassium percentages (0.318, 0.312 and 0.306%, respectively) were observed under the F4, F5 and F3 treatments, which were statistically equal to each other, compared to the lowest potassium percentages in the grains (0.292, 0.298 and 0.306%, respectively) in the F1, F2 and F3 treatments without any statistical difference between them.
In the same context, potassium percentage in grains was significantly affected by the interaction between tillage practices and fertilizer levels. A higher percentage of potassium in grains was achieved in T3×F4 interaction (0.465%) in the first location, which was statistically equal to T1×F5, T4×F5 and T3×F3, compared with T1×F1 in which the lowest potassium percentage was observed (0.150%) without statistical difference with T1×F2, T2×F3 and T4×F1. As for the data of the second location, it showed the superiority of the interaction treatment T4×F5 with the maximum percentage of potassium in the grain (0.352%), which was statistically equal with the interaction treatments T3×F4, T2×F2, T3×F5, T4×F4, T2×F1, T1×F3 and T4×F3, compared to the lowest percentage of potassium in the grain (0.273%) achieved in the interaction treatment T1×F1, which in turn did not differ statistically from T2×F3, T1×F5, T1×F2, T4×F1, T3×F2, T2×F4, T3×F1, T2×F5, T4×F2 and T3×F3 (Table ).
Soil characteristics results
Soil bulk density
Table shows the mean values of the bulk density of soil at different depths after the tillage process for the four tillage practices under study in both experiment locations. Soil bulk density at the first location was significantly higher across the observed depth in T1, T2 and T3 tillage treatments which were on par with each other (1.458, 1.452 and 1.433 g cm−3 respectively) while the lower value was observed in T4 and T3 tillage practices (1.411 and 1.433 g cm−3) which, when compared statistically, showed no difference. Plowed plots at the second location were significantly different in bulk density, which amounted to 1.408 g cm−3 for T1 treatment, followed by T2 with an average density of 1.382 g cm−3 without a statistical difference between the two treatments, while the lowest values (1.355 and 1.367 g cm−3 respectively) were recorded under T4 and T3 without statistical difference between the two treatments.
Table 3. Bulk density, pH, EC and SOC at the two locations for the investigated tillage practices and depths.
The soil at both experiment locations showed a general trend of increasing density values with increasing depth Table . The highest values of 1.493 and 1.411 g cm−3 were observed in the first and second locations, respectively, across the depth range of 20–30 cm, which was on par with the depth of 10–20 cm at the second location, while the lowest values were across the 0–10 cm depth range in the first and second location (1.392 and 1.332 g cm−3, respectively).
The results showed a significant effect of the interaction between different tillage practices and soil depths on the bulk density of soil at both locations. The results shown in Table indicate that the maximum density values in the first location were 1.505, 1.501, 1.497, 1.468, 1.466 and 1.454 g cm−3 under T2 × 20–30, T3 × 20–30, T1 × 20–30, T4 × 20–30, T2 × 10–20, and T1 × 0–10, respectively, against the lowest values of 1.355, 1.374, 1.386 and 1.392 g cm−3 for the interactions T3 × 0–10, T4 × 0–0, T2 × 0–10 and T4 × 10–20 respectively. As for the second location, the results of the comparison between the averages showed that the maximum values of the bulk density were under the interactions T1 × 20-30, T2 × 20-30, T3 × 20-30, T2 × 10-20, and T1 × 0-10 without a significant difference between them recorded 1.438, 1.424, 1.420, 1.401 and 1.395 g cm−3, respectively, while the lowest density was 1.303, 1.311, and 1.321 g cm−3 under the interactions T3 × 0-10, T4 × 0-10, and T2 × 0-10 respectively which were statistically on par with each other.
Soil pH
The data presented showed that soil pH at both locations measured at 0–30 cm depth was affected significantly by tillage practices, sampling depth and the tillage × depth interaction (Table ). The acidity increased at the first location under T1 (7.290) as compared to other tillage practices. The lower acidity was recorded under T3 and T4 (7.791 and 7.721 respectively) without significant difference between them. At the second location, higher acidity of 7.137 was recorded under T1, while it was 7.402 for T4 tillage practice.
The analysis of variance at the first location showed that soil pH in the upper 0–10 cm was markedly lower than that measured at other sampling depths (7.410); while higher value was recorded at 20–30 cm (7.742). The same trend was recorded at the second location except there were no differences between 10–20 and 20–30 depths.
Similarly, the acidity at the first location increased under T1 in the top 0–10 cm of soil (7.157) as compared to T4 at the 20–30 cm depth (7.914) which was on par with T3 × 10–20, T2 × 20–30, T3 × 20–30, and T4 × 10–20. At the second location, higher acidity was recorded for T1 × 20–30, T1 × 0–10, T3 × 0–10, T4 × 0–10, and T2 × 10–20 of 7.068, 7.080, 7.108, 7.116, and 7.146 without significant differences among interactions, while lower acidity was found under T4 × 10–20, T4 × 20–30, and T2 × 20–30 which were on par with each other (7.557, 7.535, and 7.477 respectively).
Soil EC
Data obtained for the EC analyzed at both locations are presented in Table . Analysis of the results showed that the effect of tillage practices was significant, with higher EC values recorded under T1 at the both locations (11.838 and 9.296 dS m−1 at the first and second locations respectively), while the lowest values were under T3 (9.841 dS m−1) at the first location and T4, T3, and T2 (7.569, 8.289, and 8.384 dS m−1 respectively) without significant differences among them at the second location.
The maximum values of EC were recorded in the top 0-10 cm layer of 11.923 and 8.845 dS m−1 at the first and second location respectively which doesn't differ significantly from 10 to 20 cm sampling depth at the second location. At the deeper layer, EC decreased recording a lower value at the first location through 10 to 20 cm layer of 9.613 dS m−1, while it was lower at the second location through 20–30 and 10–20 cm depth, which were on par with each other (7.853 and 8.455 dS m−1 respectively).
The present findings also showed higher EC values for T1 × 0–10 and T2 × 0–10 (13.425 and 13.040 dS m−1 respectively) compared with 8.968 and 9.041 dS m−1 for T3 × 10–20 and T4 × 10–20 respectively. At the second location maximum EC value of 12.277 dS m−1 was recorded under T1 × 0–10, while it was lower for T4 × 10–20.
Soil organic carbon
Changes in SOC within different tillage practices and sampling depths are shown in Table . According to the obtained SOC values at the two experimental locations, there were no statistically significant differences found between tillage practices on SOC values at both investigated locations. However, averaged over soil tillage practices, the data show that SOC is significantly affected by sampling depth. The results showed an increase in SOC in the upper 0–10 cm of soil at both locations (7.347 and 8.630 g kg−1 at the first and second location respectively), meanwhile 20–30 cm depth layer resulted in the lowest values of SOC (5.420 and 7.118 g kg−1 at the first and second location respectively) that didn’t differ from 10 to 20 cm layer at the second location.
Furthermore, over the two locations, SOC varied with increasing tillage intensity and sampling depth. At the first location, tillage practices of T1, T2 and T3 at the 0–10 cm soil layer recorded the highest values of SOC (8.711, 7.698 and 7.215 g kg−1 respectively) which were on par with each other, while SOC values declined under the previous tillage practices at the 20–30 cm layer. At the second location, differences in SOC values among tillage practices and sampling depths were significant, as T1 and T2 treatments at 0–10 cm layer recorded higher SOC content of 10.532 and 8.967 g kg−1 without statistical distinctions between them, whereas SOC values decreased under T4 × 0–10, T1 × 20–30 and T3 × 20–30 interaction treatments.
Saturated hydraulic conductivity
The saturated hydraulic conductivity is the property of soil to allow movement of water through it. It depends on the continuity of pore size and arrangement. Hydraulic conductivity is highly variable and dependent on field characteristics and management practices. Increasing the rate at which soil absorbs water results in more water available to meet crop needs and less water lost through runoff. The results of saturated hydraulic conductivity under different tillage practices after weeks of tillage are shown in Figure .
Figure 4. Saturated hydraulic conductivity (×10−6 m sec−1) of soil under different tillage practices and weeks after tillage at the two experimental locations. *Significant at p ≤ 0.05, **Significant at p ≤ 0.01, ns: not significant. The bars represent the standard deviations.
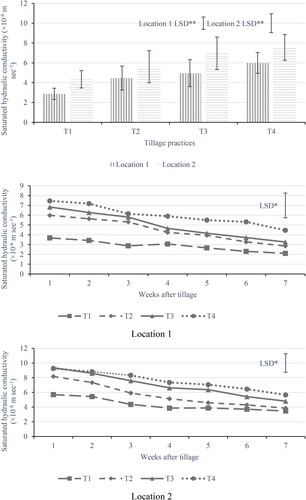
The results show a significant effect of the tillage practices in this trait, as the treatment T4 and T3 excelled recording 6.00 × 10⁻⁶ and 4.96 × 10⁻⁶ m sec−1 in the first location, which did not differ statistically from each other, while the saturated hydraulic conductivity was 2.87 × 10⁻⁶ m sec−1 for the treatments T1. In the second location, the maximum value of the saturated hydraulic conductivity was 7.56 × 10⁻⁶ m sec−1 for the T4 tillage practice, which did not differ statistically from the T3 tillage (6.96 × 10⁻⁶ m sec−1), while the lowest value was 4.34 × 10⁻⁶ and 5.61 × 10⁻⁶ m sec−1 for the two tillage practices T1 and T2 respectively which were on par with each other. The higher water conductivity under T4 and T3 tillage practices may be due to a larger pore distribution and lower bulk density.
The results of the statistical analysis showed that the saturated hydraulic conductivity was significantly affected by the period after the cultivation process. It is noted from Figure that the values of saturated hydraulic conductivity in the first location decreased by 6.06, 16.05, 25.42, 32.09, 39.01 and 47.07% for the second, third, fourth, fifth, sixth and seventh week, respectively, compared with the first week, with the maximum values of the averages reaching 5.99 × 10⁻⁶, 5.63 × 10⁻⁶, 5.03 × 10⁻⁶ and 4.47 × 10⁻⁶ m sec−1 for the durations of week1, week2, week3 and week4 respectively without significant difference between them, while the lowest values were 3.17 × 10⁻⁶, 3.65 × 10⁻⁶, 4.07 × 10⁻⁶ and 4.47 × 10⁻⁶ m sec−1 at week7, week6, week5 and week4, respectively. In the second location, the values of saturated hydraulic conductivity decreased over time by 7.06, 19.40, 29.25, 32.61, 38.84 and 45.24% for the periods of week2, week3, week4, week5, week6, and week7, respectively compared to the period of week1. The maximum saturated hydraulic conductivity (8.12 × 10⁻⁶, 7.54 × 10⁻⁶, 6.54 × 10⁻⁶, and 5.74 × 10⁻⁶ m sec−1) was observed at the durations of week1, week2, week3 and week4 respectively which were on par with each other, versus the lowest values of 4.44 × 10⁻⁶, 4.96 × 10⁻⁶, 5.47 × 10⁻⁶, 5.74 × 10⁻⁶ and 6.54 × 10⁻⁶ m sec−1 at the durations of week7 and week6 and week5, week4 and week3 respectively without significant difference between them.
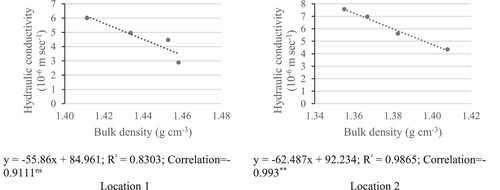
Relationship between saturated hydraulic conductivity and bulk density
The relationship between saturated hydraulic conductivities and bulk densities across tillage practices at the two locations is shown in Figure . The scatter diagram shows a negative non-significant correlation coefficient of −0.9111 at the first location, and a negative significant correlation coefficient of −0.993** at the second location between hydraulic conductivity and bulk density. The square of Pearson product-moment (R2) between the hydraulic conductivity and bulk density was 83.02% at the first location, and was significant of 98.64% at the second location. This suggests that a useful relationship exists between the two parameters that imply that 83.02% and 98.64% at the first and second location respectively of the variation of hydraulic conductivity can be explained by the changes in bulk density of soils.
Figure 5. Relationship between saturated hydraulic conductivity and bulk density at the two experimental locations. ** Correlation is significant at the 0.01 level, * Correlation is significant at the 0.05 level. ns: not significant.
Discussion
Effect of tillage practices on crop performance
Plant growth in high-density soils is significantly reduced. Growth-reducing mechanisms are related to changes in soil strength, water infiltration and retention, and soil aeration. A single root can only penetrate the pores of the soil with a diameter greater than the diameter of the root. Therefore, disrupting the soil appropriately may create a greater opportunity to form pores of larger sizes that allow the growth and extension of the roots. In addition, the loosening of the soil led to a decrease in its bulk density (Table ). Root elongation and permeability in soils with a high bulk density are often limited to cracks rather than occurring within the soil matrix (Patterson Citation1976), reducing the contact area, the amount of nutrients and water absorbed.
Loosening of the hard layer with high bulk density values, as the bulk density of the tillage practices decreased compared to the T1 tillage practice (Table ), facilitated the growth of roots (Table ) and increased their depth and increased access to water and nutrients (Lai Citation1989), and increased their branches and their ability to absorb larger quantities of water and essential nutrients. Reducing soil bulk density, which hinders the growth and development of roots, and improving their growth environment may have led to an increase in the absorption of water and available nutrients necessary for the growth and storage of carbohydrates in the roots, thus improving the efficiency of nutrients use. It was reported that maximum bread wheat root dry weight (6.1 and 6.9 g plant−1) was observed under conventional tillage, while root dry weight plant−1 was significantly decreased under reduced tillage (5.4 and 5.6 g) and no-tillage practice (5.0 and 5.1 g) during the first and second season, respectively (Leghari et al. Citation2015).
Improving the yield can be accomplished by directing the dry matter that is produced throughout the growth season into the sinks. The increase in the grain yield may be due to the increase in its components, i.e. the number of panicles per unit area, the number of grains per panicle, and the weight of the kernel through the effect of different tillage practices compared to T1 treatment, due to the improvement of soil properties (Table ) that limit the growth and development of roots and increase water ability on movement through the soil profile. A previous study showed that the average yield in the 5-year observation was 2110 kg ha−1 for the no-till technique and 4220 kg ha−1 for the conventional tillage technique in loamy campisole (Mašek and Novak Citation2018).
The tillage practices led to an increase in the biological yield compared to the T1 treatment due to loosening the soil and reducing the bulk density (Table ), facilitating the movement of roots, increasing their branching, and reaching greater depths, which increases water absorption, as well as an increase in the movement of nutrients with the movement of water and the increase in the absorption of nutrients from the tilled depth of the soil, thus increasing the production of dry matter. Previous results showed that conventional tillage recorded a higher dry yield (7870 kg ha−1) over zero (7020 kg ha−1) and minimal tillage (6400 kg ha−1) in sandy loam texture (Kumar and Karmakar Citation2015).
Effects of fertilizer application on crop performance
Regardless of tillage practices, fertilizer application improved oat performance. The experimental site soils lack important nutrients required to sustain or improve crop growth as indicated by the initial soil analysis data of both locations (Table ). Hence, N, P, and K fertilizer applications can improve crop yields. Response to NPK application varied across locations, we observed that the fields have positive responses. The availability of phosphorus in the root zone during the different stages of growth may stimulate the growth of roots and increase root branches, consequently increasing the absorption of nutrients (including nitrogen added to the soil and its role in promoting growth and increasing the leaf area), and increase the supply of the plant with nutrients in quantities appropriate for its growth, which provides the photosynthesis process with the basic elements and then increasing its efficiency and increasing its outputs, which are transmitted to the grain. Phosphorus is important in the process of energy transfer and conversion, as both adenosine diphosphate and triphosphate (ADP, ATP) work on the energy circulation within the plant, and the energy obtained from photosynthesis and metabolic processes of carbohydrates is stored in phosphate compounds to use them in the subsequent growth and reproduction processes (Tisdale et al. Citation1993), and this was reflected in an increase in the number of spikelets initiates from which the grains originate, reducing the abortion of the florets by reducing the state of competition among them for the food produced, and thus increasing the number of grains in the spike.
Phosphorus application may increase the efficiency of the photosynthesis process (Ceasar et al. Citation2014), increasing its products and providing the nutrients necessary for the emergence of the largest number of productive tillers and their continuation until the end of the season and giving them tillers bearing panicle (Ijaz et al. Citation2017). In addition, the potassium role in the action of the enzymes inside the plant directly or indirectly and its function in stimulation of vital activities inside the plant and the outputs of photosynthesis (Cakmak Citation2005) increase the nutrients prepared for the tillers initiators to form a greater number of tillers bearing panicle. Potassium also speeds up the process of moving manufactured materials to storage sites (IPNI Citation1998), besides its important role in the hormonal balance in the plant by controlling growth regulators and increasing the flowering rate (Wakhloo Citation1975). In addition, potassium has a role in improving root growth and deepening in the soil and increasing its efficiency in absorbing nutrients (Prajapati and Modi Citation2012). Also, nitrogen promotes the growth of vegetative organs, and leads to the early differentiation of spikelets (Zhang et al. Citation2019). It increases the amount of assimilated material transported to organs (reproductive structures) such as panicles (Sun et al. Citation2019). Thus, panicles have a better ability to obtain nutrients.
The increase in the size of the root system (Table ) may have contributed to increasing the utilization of nitrogen added to the soil, which contributes to increasing the accumulated dry matter, especially in the stage of filling the grains. At the fruiting stage, the plant’s needs for potassium rise, which leads to delaying the senescence and ageing of the leaves by delaying the formation of abscisic acid in the leaves and grains, which leads to a prolongation of the period of filling the grains (Haeder Citation1980). The transfer of phosphorus to the grains depends on the amount of the element available after flowering and the capacity of the sinks represented by the panicles, which differ by genotype and environment (Pampana et al. Citation2007) and appropriate seedbed preparation processes. The importance of phosphorus in increasing the surface area of the roots and increasing the uptake accordingly (Song et al. Citation2010), as well as the role of potassium in the uptake and use of other nutrients by plants, including nitrogen (Xu et al. Citation2020) may have led to an increase in the percentage of nitrogen, phosphorus and potassium in the shoot and grains. The role of nitrogen, phosphorus and potassium in increasing the components of the grain yield led to an increase in the grain yield, and their role in providing the nutrients required to increase plant height and stem thickness was reflected in the increase in straw yield, and by increasing grain yield and straw yield, the biomass yield increased (Table ). Maximum yield of oats was (3802 kg ha−1) under N120: P80: K80 + 30 t ha−1 dung + 5 t ha−1 lime compared to the control treatment (1119 kg ha−1) on pseudogley soil as reported by (Rajičić et al. Citation2020).
The effect of tillage practices and sampling depth on soil properties
In general, tillage practices, as well as sampling depth had significant effects on the soil properties of both locations. Tillage affects the bulk density (Table ) of the soil by loosening the soil, removing its compaction, and increasing the pores among the soil particles, especially when carried out under suitable conditions. Bulk density increased with increasing depth for all tillage treatments as soil compacted gradually and over time in addition to particles resettlement. The subsurface layers are more compact, contain less organic matter, have less aggregation, in addition to less root penetration compared to the surface layers, and therefore have less pore space.
When compared to conventional tillage soil, organic matter accumulates in the upper few centimeters of no-tillage soil (Rhoton Citation2000), causing electrolyte concentrations to rise and soil pH to fall (Rahman et al. Citation2008). Furthermore, the addition of fertilizers, which persists at the top 5 cm of the soil profile as a result of the lack of moisture and increased compaction in the T1 treatment (Table ), contributed to the acidity of the soil. Soil acidification produced by mineral fertilizer application would have a considerable impact on the pH of the soil. The decrease found in the top 10 cm of soil may be explained by the decomposition of the residues, in particular at T1 treatment, which releases H+ ions. While H+ ions will diffuse downward through the soil profile, the slow rate of infiltration under NT treatment (Martínez et al. Citation2008) increases the possibility of the released H+ ions remaining at the soil surface.
The increased EC in the soil under T1 (Table ) may be attributed to the increased biological activity. Nitrification, as a biological process, accelerates the transformation of soil organic matter and the release of H+ ions. These ions compete for colloidal exchange sites with non-acidic ions, promoting the release of non-acidic ions into the soil solution. These ions can combine to produce salts, causing a rise in EC (Gallego Citation2001). Moreover, high EC values associated with the surface soil could be the result of crop residues and fertilizer application (Sharma et al. Citation2005). Soil salinity typically rises with the use of fertilizers, which may increase the ability of other solutes to dissolve, hence increasing soil salinity (Alijani et al. Citation2012). In addition, salt deposition from the higher layers may have contributed to the rise in soil EC values with depth (Table ).
Changes in SOC were caused by the absence or decrease of tillage activities (Table ), which reduced soil disturbance and organic matter breakdown, leading to more crop residue and organic matter accumulation. Under T1 crop residues are deposited on the soil surface where a slower decomposition occurs because of drier conditions and reduced mineral nutrient availability. By contrast, at deeper depths, tillage mixes organic residues with soil. At silty clay loam soil, no-till and double disk management increased SOC by 1.2 times at the 0-10 cm depth compared with chisel and plow tillage (Kibet et al. Citation2016).
The increase in the saturated hydraulic conductivity under the tillage practices could be due to loosening of the hard layer with high bulk density values, as the bulk density of the tillage practices decreased compared to the T1 tillage practice (Figure ). The decrease in saturated hydraulic conductivity in general after weeks of planting may be due to soil re-settlement and the effects of compaction. A decrease in soil conductivity by 13.413, 10.847, 12.101, and 9.777% for the plough-harrow, plough-plough tillage, manual tillage, and no-tillage respectively was observed in the eighth week after plowing compared with first week at a loamy sand soil (Osunbitan et al. Citation2005). A negative correlation coefficient between hydraulic conductivity and bulk density indicates that there is a relationship between saturated hydraulic conductivities and bulk densities. As the bulk density increases, hydraulic conductivity decreases. The correlation coefficient between the hydraulic conductivity and bulk density suggests that a useful relationship exists between the two parameters, and that the variation of hydraulic conductivity can be explained by the changes in bulk density of soils (Figure ).
Conclusions
Different tillage practices and fertilizer levels significantly affected the characteristics of vegetative growth, yield and its components in oats. The T4 and T3 tillage treatments produced the highest grain yield, biomass yield and root dry weight, while the T1 and T2 tillage treatments gave the lowest average. A properly managed fertility program is essential for maximum crop yields. By comparing fertilizer levels, it was found that oats grown under F4 and F5 fertilizer levels had the highest yield as well as yield components and vegetative growth traits compared to other fertilizer levels. The findings show that following fertilization guidelines is critical since an inadequate dosage affects productivity while increasing fertilization does not boost output, moreover increases pollution. The density, acidity, EC, and organic carbon of soil at the two experimental locations were greater for T1 tillage treatment than what was recorded under other tillage practices, while the results of saturated hydraulic conductivity were in contrast. The bulk density and pH of the soil increased with increasing depth, reaching the highest value at 20–30 cm, while a gradual decrease in EC and organic carbon was observed with increasing depth. The saturated hydraulic conductivity of the soil was significantly affected by the measurement time. Saturated hydraulic conductivity decreased weeks after cultivation. The choice of a tillage system should be driven by local soil and weather conditions. In general, and based on our experiment results, farmers are encouraged to utilize tillage practices that minimize yield loss by enhancing soil properties. In addition to the application of appropriate fertilization rates for oat production in lands where natural conditions coincide with the experimental conditions. Long-term studies will be necessary to measure the lasting effects of tillage methods and fertilization levels on soil properties and oat yield.
Author contributions
Conceptualization, methodology, validation, formal analysis, investigation, data curation, writing-original draft preparation, writing-review and editing, visualization, supervision, project administration, and funding were performed by the author. The author has read and agreed to the published version of the manuscript.
Acknowledgements
Gratitude is extended to the University of Basrah, College of Agriculture for providing the laboratories needed to perform this study.
Disclosure statement
No potential conflict of interest was reported by the author(s).
Data availability statement
The data supporting the findings of this research is accessible on Figshare, and can be accessed at https://doi.org/10.6084/m9.figshare.24,099,360.
Additional information
Funding
References
- Alam K, Islam MM, Salahin N, Hasanuzzaman M, Alam M, Islam MM, Salahin N, Hasanuzzaman M. 2014. Effect of tillage practices on soil properties and crop productivity in wheat-mungbean-rice cropping system under subtropical climatic conditions. Scientific World J. 2014:1–15.
- Alijani K, Bahrani MJ, Kazemeini SA. 2012. Short-term responses of soil and wheat yield to tillage, corn residue management and nitrogen fertilization. Soil Tillage Res. 124:78–82. doi:10.1016/j.still.2012.05.005.
- Black CA. 1965. Method of soil analysis part 2. Chem Microbiol Prop. 9:1387–1388.
- Cakmak I. 2005. The role of potassium in alleviating detrimental effects of abiotic stresses in plants. J Plant Nutr Soil Sci. 168(4):521–530. doi:10.1002/jpln.200420485.
- Campbell DJ. 1994. Determination and use of soil bulk density in relation to soil compaction. In: BD Soane, C van Ouwerkerk, editors. Developments in agricultural engineering. New York, USA: Elsevier; Vol. 11, p. 113–139.
- Cavalieri KMV, da Silva AP, Tormena CA, Leão TP, Dexter AR, Håkansson I. 2009. Long-term effects of no-tillage on dynamic soil physical properties in a Rhodic Ferrasol in Paraná, Brazil. Soil Tillage Res. 103(1):158–164. doi:10.1016/j.still.2008.10.014.
- Ceasar SA, Hodge A, Baker A, Baldwin SA. 2014. Phosphate concentration and arbuscular mycorrhizal colonisation influence the growth, yield and expression of twelve PHT1 family phosphate transporters in foxtail millet (Setaria italica). PLoS One. 9(9):e108459. doi:10.1371/journal.pone.0108459.
- Communities, C. of the E. 2002. Communication from the Commission to the Council and the European Parliament: towards a strategy to protect and conserve the marine environment. Commission of the European Communities.
- Cresser MS, Parsons JW. 1979. Sulphuric—Perchloric acid digestion of plant material for the determination of nitrogen, phosphorus, potassium, calcium and magnesium. Anal Chim Acta. 109(2):431–436. doi:10.1016/S0003-2670(01)84273-2.
- DeVita P, Di Paolo E, Fecondo G, Di Fonzo N, Pisante M. 2007. No-tillage and conventional tillage effects on durum wheat yield, grain quality and soil moisture content in southern Italy. Soil Tillage Res. 92(1–2):69–78. doi:10.1016/j.still.2006.01.012.
- El Mekkaoui A, Moussadek R, Mrabet R, Douaik A, El Haddadi R, Bouhlal O, Elomari M, Ganoudi M, Zouahri A, Chakiri S. 2023. Effects of tillage systems on the physical properties of soils in a semi-arid region of Morocco. Agriculture. 13(3):683. doi:10.3390/agriculture13030683.
- Estefan G, Sommer R, Ryan J. 2013. Methods of soil, plant, and water analysis. Man West Asia North Afr Reg. 3:65–119.
- Gallego JCGG. 2001. Efectos residuales y acumulativos producidos por la aplicación de Compost de Residuos Urbanos y Lodos de Depuradoras sobre Agrosistemas Mediterráneos degradados. Fuencarral-El Pardo, Madrid, Spain: Universidad Autónoma de Madrid.
- Ghosh N. 2004. Reducing dependence on chemical fertilizers and its financial implications for farmers in India. Ecol Econ. 49(2):149–162. doi:10.1016/j.ecolecon.2004.03.016.
- Haeder HE. 1980. Effect of potassium nutrition on sink intensity and duration. In Physiological Aspects of Crop Productivity. Proceedings of the 15 th Colloquium of the International Potash Institute. International Potash Institute. p. 185–194.
- Hillel D. 1998. Environmental soil physics: fundamentals, applications, and environmental considerations. Waltham: Elsevier.
- Ijaz W, Ahmed M, Asim M, Aslam M. 2017. Models to study phosphorous dynamics under changing climate. In: Mukhtar Ahmed, Claudio O. Stockle, editors. Quantification of climate variability, adaptation and mitigation for agricultural sustainability. Pullman, USA: Springer; p. 371–386.
- IPNI. 1998. A Publication of the International Plant Nutrition Institute.
- Jat HS, Datta A, Sharma PC, Kumar V, Yadav AK, Choudhary M, Choudhary V, Gathala MK, Sharma DK, Jat ML. 2018. Assessing soil properties and nutrient availability under conservation agriculture practices in a reclaimed sodic soil in cereal-based systems of North-West India. Arch Agron Soil Sci. 64(4):531–545. doi:10.1080/03650340.2017.1359415.
- Karing P, Kallis A, Tooming H. 1999. Adaptation principles of agriculture to climate change. Clim Res. 12(2–3):175–183. doi:10.3354/cr012175.
- Kibet LC, Blanco-Canqui H, Jasa P. 2016. Long-term tillage impacts on soil organic matter components and related properties on a Typic Argiudoll. Soil Tillage Res. 155:78–84. doi:10.1016/j.still.2015.05.006.
- Kumar B, Karmakar S. 2015. Effect of tillage and nutrient management on fodder yield, economics and energetics of oat (Avena sativa L.). Forage Res. 41:19–22.
- Lai R. 1989. Conservation tillage for sustainable agriculture: tropics versus temperate environments. Adv Agron. 42:85–197. doi:10.1016/S0065-2113(08)60524-6.
- Leghari N, Mirjat MS, Mughal AQ, Rajpar I, Magsi H. 2015. Effect of different tillage methods on the growth, development, yield and yield components of bread wheat. Int J Agron Agric Res. 6:36–46.
- Liua Z, Cao S, Sun Z, Wang H, Qu S, Lei N, He J, Dong Q. 2021. Tillage effects on soil properties and crop yield after land reclamation. Sci Rep. 11(1):1–12. doi:10.1038/s41598-020-79139-8.
- Martínez E, Fuentes J-P, Silva P, Valle S, Acevedo E. 2008. Soil physical properties and wheat root growth as affected by no-tillage and conventional tillage systems in a Mediterranean environment of Chile. Soil Tillage Res. 99(2):232–244. doi:10.1016/j.still.2008.02.001.
- Mašek J, Novak P. 2018. Influence of soil tillage on oats yield in Central Bohemia Region. Agron Res. 16(3):838–845. doi:10.15159/ar.18.110.
- Nassir AJ, Meshaal AA, Ramadan MN. 2016. Effect of soil moisture content on pulverization energy of moldboard plow in silty loam soil. Basrah J Agric Sci. 29(2):206–221. doi:10.33762/bagrs.2016.120235.
- NFDC. 1997. Fertilizer recommendation in Pakistan. Islamabad: Planning and development division NFDC, Government of Pakistan. p. 7.
- Osunbitan JA, Oyedele DJ, Adekalu KO. 2005. Tillage effects on bulk density, hydraulic conductivity and strength of a loamy sand soil in southwestern Nigeria. Soil Tillage Res. 82(1):57–64. doi:10.1016/j.still.2004.05.007.
- Pampana S, Mariotti M, Ercoli L, Masoni A. 2007. Remobilization of dry matter, nitrogen and phosphorus in durum wheat as affected by genotype and environment. Italian J Agron. 2(3):303–314. doi:10.4081/ija.2007.303.
- Patterson JC. 1976. Soil compaction and its effects upon urban vegetation [Landscape trees]. USDA Forest Service General Technical Report NE (USA).
- Prajapati K, Modi HA. 2012. The importance of potassium in plant growth–a review. Indian J Plant Sci. 1(02–03):177–186.
- Rahman MH, Okubo A, Sugiyama S, Mayland HF. 2008. Physical, chemical and microbiological properties of an Andisol as related to land use and tillage practice. Soil Tillage Res. 101(1–2):10–19. doi:10.1016/j.still.2008.05.006.
- Rajičić V, Popović V, Terzić D, Grčak D, Dugalić M, Mihailović A, Grčak M, Ugrenović V. 2020. Impact of lime and NPK fertilizers on yield and quality of oats on pseudogley soil and their valorisation. Not Bot Horti Agrobot Cluj-Napoca. 48(4):2134–2152. doi:10.15835/nbha48412106.
- Ramadhan MN. 2013. Tillage systems and seeding rates effect on yield components, seed yield and biological yield of barley cultivars. J Basrah Res (Sci). 39(1):33–46.
- Rayment GE, Lyons DJ. 2011. Soil chemical methods: Australasia (Vol. 3). Australia: CSIRO publishing.
- Rhoton FE. 2000. Influence of time on soil response to no-till practices. Soil Sci Soc Am J. 64(2):700–709. doi:10.2136/sssaj2000.642700x.
- Richards JF, Graham PH, Eichorn BM. 1985. Effect of super phosphate and nitrogen on yield of wheat. New Zealand J Crop Hort. 11:103–108.
- Salem HM, Valero C, Muñoz MÁ, Rodríguez MG, Silva LL. 2015. Short-term effects of four tillage practices on soil physical properties, soil water potential, and maize yield. Geoderma. 237-238:60–70. doi:10.1016/j.geoderma.2014.08.014.
- Schuurman JJ, Goedewaagen MAJ. 1965. Methods for the examination of root systems and roots. Netherlands: Centre for Agricultural Publications and Documentation Wageningen.
- Shah Z, Shah SH, Peoples MB, Schwenke GD, Herridge DF. 2003. Crop residue and fertiliser N effects on nitrogen fixation and yields of legume–cereal rotations and soil organic fertility. Field Crops Res. 83(1):1–11. doi:10.1016/S0378-4290(03)00005-4.
- Sharma KL, Mandal UK, Srinivas K, Vittal KPR, Mandal B, Grace JK, Ramesh V. 2005. Long-term soil management effects on crop yields and soil quality in a dryland Alfisol. Soil Tillage Res. 83(2):246–259. doi:10.1016/j.still.2004.08.002.
- Song C-J, Ma K-M, Qu L-Y, Liu Y, Xu X-L, Fu B-J, Zhong J-F. 2010. Interactive effects of water, nitrogen and phosphorus on the growth, biomass partitioning and water-use efficiency of Bauhinia faberi seedlings. J Arid Environ. 74(9):1003–1012. doi:10.1016/j.jaridenv.2010.02.003.
- Souza LHC, Matos E, da S, Magalhães CA, de S, de la Torre ER, Lamas FM, Lal R. 2018. Soil carbon and nitrogen stocks and physical properties under no-till and conventional tillage cotton-based systems in the Brazilian Cerrado. Land Degrad Dev. 29(10):3405–3412. doi:10.1002/ldr.3105.
- Sparks DL, Page AL, Helmke PA, Loeppert RH. 2020. Methods of soil analysis, part 3: chemical methods (Vol. 14). Madison, USA: John Wiley & Sons.
- Sun Z, Wu S, Zhang Y, Meng F, Zhu B, Chen Q. 2019. Effects of nitrogen fertilization on pot-grown wheat photosynthate partitioning within intensively farmed soil determined by 13C pulse-labeling. J Plant Nutr Soil Sci. 182(6):896–907. doi:10.1002/jpln.201800603.
- Tisdale SL, Nelson WL, Beton JD, Havlin JL. 1993. Soil fertility and fertilizers. 5th ed. Upper Saddle River, NY: Prentice Hall.
- Wakhloo JL. 1975. Studies on the growth, flowering, and production of female sterile flowers as affected by different levels of foliar potassium in Solanum sisymbrifolium lam: II. Interaction between foliar potassium and applied gibberellic acid and 6-furfurylaminopurine. J Exp Bot. 26(3):433–440. doi:10.1093/jxb/26.3.433.
- Walkley A, Black IA. 1934. An examination of the Degtjareff method for determining soil organic matter, and a proposed modification of the chromic acid titration method. Soil Sci. 37(1):29–38. doi:10.1097/00010694-193401000-00003.
- Wang Y, Lu J, Ren T, Hussain S, Guo C, Wang S, Cong R, Li X. 2017. Effects of nitrogen and tiller type on grain yield and physiological responses in rice. AoB Plants. 9(2):1–14. doi:10.1093/aobpla/plx012.
- War S, Shaktawat MS. 2003. Influence of phosphorus sources, levels and solubilizers on yield, quality and nutrient uptake of soybean (Glycine max)—wheat (Triticum aestivum) cropping system in southern Rajasthan. Indian J Agric Sci. 73(1):3–7.
- Xu X, Du X, Wang F, Sha J, Chen Q, Tian G, Zhu Z, Ge S, Jiang Y. 2020. Effects of potassium levels on plant growth, accumulation and distribution of carbon, and nitrate metabolism in apple dwarf rootstock seedlings. Front Plant Sci. 11:1–13. doi:10.3389/fpls.2020.00904.
- Zavalin AA, Vinogradova LV, Dukhanina TM, Vaulin AV, Chistotin MV, Sologub DB, Gabibov M, Lekomtsev PV, Pasynkov AV. 2001. Geographical regularities of effect of inoculation with associative diazotrophs on the productivity of cereals. Plant Microb Interact: Posit Interact Relat Crop Prod Util. 63:123–127.
- Zhang B, Thornburg TE, Liu J, Xue H, Fontana JE, Wang G, Li Q, Davis KE, Zhang Z, Liu M. 2020. Potassium deficiency significantly affected plant growth and development as well as microRNA-mediated mechanism in wheat (Triticum aestivum L.). Front Plant Sci. 11:1219. doi:10.3389/fpls.2020.01219.
- Zhang W, Wang J, Huang Z, Mi L, Xu K, Wu J, Fan Y, Ma S, Jiang D. 2019. Effects of low temperature at booting stage on sucrose metabolism and endogenous hormone contents in winter wheat spikelet. Front Plant Sci. 10:498. doi:10.3389/fpls.2019.00498.