
Abstract
Large amounts of use of mineral fertilizers (MF) have brought about environmental pollution and soil problems, like soil degradation and acidification. The partial substitution of MF with organic fertilizer is considered eco-friendly and more efficient in improving soil fertility. In our study, the effects of MF alone and the combination of MF and organic fertilizers (MOF) on soil phosphorus (P) availability in infertile soil with P deficiency were studied with the initial soil without any addition as the control. The addition of MF and MOF increased the soil labile P (resin-P and NaHCO3-Pi) by 101.8% and 320.1%, respectively, compared to the control after 180 days of treatment. Resin-P was the predominant P fraction in MOF, accounting for 28.0% of the total P. The proportions of residual-P in MOF were 5.6% and 8.3% lower than those in MF and control, respectively. The P activation coefficient in MOF was the highest (15.0%), and was the main contributor to soil P fractions based on redundancy analysis. Our results suggest that the combined application of organic and mineral fertilizers is more efficient in improving soil P availability than mineral fertilizer alone. We highlight the joint application was beneficial to improve soil P activation coefficient.
Introduction
Phosphorus (P) is one of the three primary essential macronutrients in soil that is required in large amounts by plants, along with nitrogen (N) and potassium (K) (Soltangheisi et al. Citation2019). Available P (AP) insufficiency is common in nature, and has been observed in more than 90% of calcareous soils worldwide (Soltangheisi et al. Citation2019). Lowland tropical forests, such as the majority of Amazonia, are also characterized by soil P limitation (Lee et al. Citation2004; Wright et al. Citation2018). In China, it has been estimated that nearly 70% of the cultivated land is low-P soil (Yang et al. Citation2012). Phosphorus is a growth-limiting factor for plants and plays a vital role on the establishment of rhizospheric microorganisms in soil.
Soil P is mainly divided into organic P (Po) and inorganic P (Pi), which exist in various forms on the mineral surface and in the solid–liquid phase of the soil and constantly transform. The uptake of P by plants is related to the P supply ability of soil and the P desorption characteristics, which are determined by total P (TP), AP, and P forms. The activities of soil microorganisms, contents of other mineral elements, such as iron and aluminum, pH value, and organic matter also affect P absorption through solubilization, retention, and precipitation (Johnston et al. Citation2014; Sun et al. Citation2022a). Soil pH directly or indirectly affects P uptake. Desulfurized gypsum at application rates of 7.5, 15.0, 22.5, and 30.0 t ha−1 significantly reduced the pH value of saline-alkali soil, and the decrease was positively correlated with the applied amount (Zhao et al. Citation2020). The increase in Pi fractions was accompanied by a decline in soil pH when superphosphate was added (Osztoics et al. Citation2005; Huang et al. Citation2023). Among all the factors, the P form is the most direct and important (Turner et al. Citation2007; Helfenstein et al. Citation2018; Fu et al. Citation2020; Wan et al. Citation2020). Phosphorus can be fractionated into resin-P, NaHCO3-Pi, NaHCO3-Po, NaOH-Pi, NaOH-Po, HCl-P, and residual-P based on sequential fractionation. Labile P (resin-P and NaHCO3-P) can dissolve within seconds to meet the short-term P needs of plants (Hedley et al. Citation1982; Tiessen and Moir Citation1993). Moderately labile P (NaOH-P) takes weeks or months to convert into labile P, whereas stable P (HCl-P and residual-P) cannot be directly absorbed and utilized by plants (Negassa and Leinweber Citation2009; Gao et al. Citation2022).
The TP pool is typically substantial in various ecosystems due to long-term fertilization. However, bioavailable P that can be directly assimilated by the plants is not sufficient. The low efficiency of plant P uptake has become a serious problem associated with fertilizer application (Takahashi and Anwar Citation2007; Waldrip et al. Citation2011). Plants only utilize Pi, but not all Pi forms can be absorbed immediately. Although Po is not directly bioavailable, it can be hydrolyzed to Pi (Darch et al. Citation2014). Thus, it is important to determine which P fractions are reactive or readily available to plants.
Oliveira Filho et al. (Citation2020) reported that long-term (>40 years) application of swine manure increased the labile Pi content. Pig manure application improved the transformation of non-labile P into labile P after 29 years of fertilization (Wang et al. Citation2022). Compared with mineral fertilizers (MF), manure improves soil P status slower due to the presence of a large proportion of Po (Barlow et al. Citation2007; Chatzistathis et al. Citation2021). Superphosphate with high water solubility can quickly increase soil P concentrations (McDowell and Catto Citation2005; Robertson and Nash Citation2008). Notably, the effects of MF may disappear within several weeks or months, and long-term application leads to soil compaction and acidification, even soil and water pollution by leaching (Robertson and Nash Citation2008; Han et al. Citation2015; Wu et al. Citation2019; Kokulan et al. Citation2022; Song et al. Citation2022). Partially replacing MFs with organic fertilizers can effectively alleviate the above problems and improve P availability in the soil (Meena et al. Citation2018; Song et al. Citation2022). The co-application of organic and inorganic amendments is more beneficial for enhancing soil fertility and maintaining sustainability than single organic or inorganic fertilizers (Xin et al. Citation2016; Chen et al. Citation2021a).
Cow manure combined with NPK MF significantly improved the total and available contents of N, P, K, soil organic carbon, and rice yield compared with MF alone in 38 consecutive years of fertilization treatment (Gao et al. Citation2023). Combination of organic amendments (soybean litter and beans) with NPK MF were better in P availability, P use efficiency, and plant growth than single MF in the saline-alkaline soil, and organic fertilizer was emphasized to play a key role in improving soil quality (Chen et al. Citation2021b). Combination of 40% chicken manure with 60% NPK MF was more effective in maintaining the P input-output balance and increasing plant yields than manure alone in alkaline soil (Chen et al. Citation2021a). Crushed garden waste (leaves, branches, and grass clippings) is a valuable organic amendment that can increase soil aeration, organic matter, mineral nutrients, microbial biomass, and soil enzyme activities (Tits et al. Citation2014; Feng et al. Citation2021; Li et al. Citation2021; Citation2023). The AP concentration increased over time in garden waste-amended soils (Verma and Marschner Citation2013). Garden waste takes a longer time to decompose and exert fertility effects than manure. The decomposition and release of mineral nutrients in garden waste include three phases: fast initial release, intermediate stabilization, and final increase (Reyes-Martín et al. Citation2022). The diverse microorganisms present in manure help decompose organic matter in garden waste. Thus, the combined use of garden waste and manure is expected to generate synergistic effects and provide a sustainable supply of nutrients.
In the present study, we used three types of MFs (desulfurized gypsum, sulfur, and superphosphate) and a combination of MF and organic fertilizers (MOF) to improve infertile soil with P deficiency. The purposes of this study are to demonstrate (1) the combination of mineral fertilizers with organic fertilizers can improve soil nutrient availability, especially P more effectively, and (2) organic fertilizers play an important role in the improvement of soil P activation, labile P, and P transformation. We hypothesized that (1) P deficiency in the initial soil is mainly due to low AP and high stable P; (2) the application of garden waste and cattle manure produces more resin-P and NaHCO3-Pi fractions; and (3) the addition of organic fertilizers promotes the soil mineralization process.
Materials and methods
Study area and experimental design
The experiment was conducted in the botanical garden of the Shanghai Institute of Technology, Shanghai, China (121°30′42″E, 30°50′42″N). The annual mean temperature is 16.1°C, and the annual rainfall is 1191.5 mm. The soil used in the present study was collected from the Ecological Corridors at Haiwan Town, Fengxian District, Shanghai (121°50′49″E, 30°80′78″N) before the soil was improved. The soil was characterized by a high pH value (8.3), stickiness, and nutrient deficiency, especially P. The TP and AP concentrations were 0.90 g kg−1 and 10.83 mg kg−1. The organ carbon, total N, and total K concentrations were 31.70, 2.93, and 17.19 g kg−1. The gas-water ratio and water-holding capacity were 7.91% and 47.5 mm.
Soil samples were collected from each pot in August 2022, then air-dried, crushed, and passed through a 2 mm sieve. Five kilograms of soil mixed with MF and MOF was placed into 2-gallon plastic pots on 1 September 2022, which was recorded as the 0th day. The control soil was the initial soil without MF, garden waste, or cattle manure. The MF treatment included 6 g desulfurization gypsum, 6 g superphosphate, and 0.24 g sulfur. The treatment of MOF referred to adding 500 g of garden waste (1/3 in volume) and 132 g of cattle manure to MF. There were 20 replicates for each treatment and the control group. The physicochemical properties, nutrients, and P fractions of the soil were analyzed at 0, 90th, and 180th day of treatment.
Soil nutrient analysis
Soil pH was determined using 1:5 soil: deionized water with a glass electrode meter (Bante 210) and the electrical conductivity (EC) was measured using a conductivity meter (Hanna JI98331) (He et al. Citation2012). The soil was digested in concentrated H2SO4 and H2O2 using an infrared digestion block (SKD-20S2, Shanghai Peiou Co., Ltd., China), and the TP concentration of the extract was determined using the molybdate ascorbic acid method at 700 nm wavelength by a UV spectrophotometer (UV4800, Unocal, China). Available P was extracted using 50 mL of 0.5 M NaHCO3 and measured by the molybdenum-blue colorimetric method using a UV spectrophotometer (UV4800, Unocal, China) at a wavelength of 700 nm wavelength (Olsen Citation1954). Available N (AN) was measured using the alkali N-proliferation method, and available K (AK) was measured using a flame photometer (FP640, China) (Lu Citation1999). The phosphorus activation coefficient (PAC) was the ratio of AP to TP (Wu et al. Citation2017).
Soil phosphorus fractionation
The phosphorus fractions of resin-P, NaHCO3-Pi, NaHCO3-Po, NaOH-Pi, NaOH-Po, HCl-P, and residual-P were sequentially extracted according to the methods described by Hedley et al. (Citation1982) and Tiessen and Moir (Citation1993). A 0.5 g soil sample was placed in a 50 ml centrifuge tube and extracted sequentially with 0.5 M NaHCO3, 0.1 M NaOH, and 1 M HCl. The extract was shaken at 180 excursions per minute for 16 h and then centrifuged at 4000 rpm for 5 min. The Pi concentration of the extract was determined using the same method as that for TP. The difference between TP and Pi is termed Po. After sequential extraction, the P in the soil residue was digested with H2SO4 and H2O2 at 350°C for 3 h and then measured by the molybdenum-blue colorimetric method. Soil P fractions are classified into three categories: labile P (resin-P, NaHCO3-Pi, and NaHCO3-Po), moderately labile P (NaOH-Pi and NaOH-Po), and stable P (HCl-P and residual-P) (Gao et al. Citation2022).
Statistical analysis
A two-way ANOVA was used to analyze the effects of MF/MOF and treatment time on all parameters. The differences in all parameters between the MF, MOF, and control groups were determined using one-way ANOVA. The least significant difference (LSD) was used to compare the means between treatments at a level of 0.05. All statistical analyses were conducted using SPSS 22.0, and the data are presented as the mean ± standard error obtained from four replicates. The correlation plot, including soil properties and soil-P fractions, was carried out by redundancy analysis (CANOCO 5) and Pearson analysis (Origin 2022).
Results
Soil chemical properties
The pH value was significantly affected by MF and MOF and changed with treatment time (Table ). The pH value decreased by 2.1% when MF was originally added on the 0th day, and then decreased by 2.9% and 4.1% on the 90th and 180th days of treatment, respectively, compared with the control (Figure (a)). Similarly, MOF treatment decreased pH by 1.9%, 6.8%, and 8.7%, respectively (p < 0.05) (Figure (a)).
Figure 1. The soil pH value (a) and electrical conductivity (EC) (b) under the mineral fertilizers (MF) and combination of MF and organic fertilizers (MOF) on the 0, 90th, and 180th day of treatment (Mean ± SE, n = 4). Different lowercase letters indicated significant differences between treatments during the same treatment time and different uppercase letters indicated significant differences between treatment time at the level of 0.05.
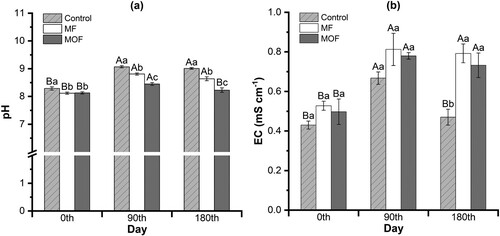
Table 1. Statistical results of the treatments of mineral fertilizers (MF) and combination of MF and organic fertilizers (MOF) and treatment time (0, 90, and 180 days) on the pH, electrical conductivity (EC), available nitrogen (AN), available phosphorus (AP), available potassium (AK), phosphorus activation coefficient (PAC) of soil by two-way ANOVA.
The EC was significantly affected by MF, MOF, and treatment time (Table ). No significant difference in EC was observed between the control, MF, and MOF on the 0 and 90th day of treatment, while it was increased by 68.1% and 53.3% by the MF and MOF treatments on the 180th day of treatment (Figure (b)). After 90 days of treatment, the EC under the MF and MOF treatments increased by 54.5% compared with that on the 0th day, and no significant difference was observed between the 90th and 180th days (p > 0.05).
Soil available nutrients
The AN concentration was significantly affected by MOF treatment but not by MF treatment (Table ). It increased with treatment time under the MOF treatment, with 35.3% and 93.7% increases on the 90th and 180th days, respectively, compared with the initial 0th day (p < 0.05) (Figure a). After 180 days of treatment, the AN concentration under the MOF treatment was 60.5% and 35.4% higher than that under the control and MF treatments, respectively, but no significant difference was observed between the MF and control treatments over the experimental period.
Figure 2. The concentrations of available nitrogen (AN) (a), available phosphorus (AP) (b), available potassium (AK) (c), and total phosphorus (TP) (d) under the mineral fertilizers (MF) and combination of MF and organic fertilizers (MOF) (Mean ± SE, n = 4). Different lowercase letters indicated significant differences between treatments during the same treatment time and different uppercase letters indicated significant differences between treatment time at the level of 0.05.
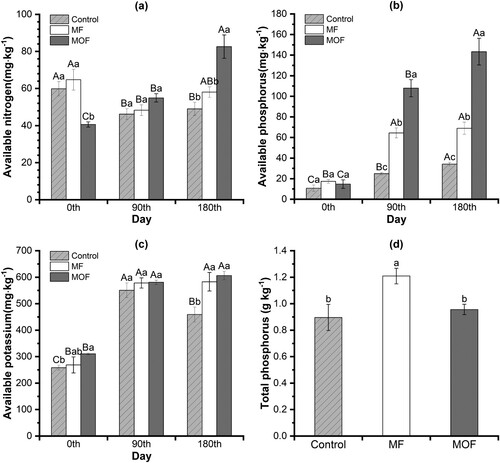
The concentrations of AP and AK were significantly affected by MF and MOF treatments and treatment time (Table ). No significant difference in AP concentration was observed between the control, MF, and MOF treatments on the 0th day (Figure (c)). The MF treatment increased the AP concentration by 1.6 times and 1.0 times compared with the control on days 90th and 180th day. Similarly, MOF treatment increased it by 3.3 and 3.2 times. The AP concentration significantly increased with the treatment time, with the highest enhancement observed in the MOF treatment. The MF and MOF treatments increased the AP concentration by 2.7 and 6.3 times during the first 90 days of treatment. The MOF treatment continued to significantly increase the AP concentration by 32.9% during the second 90 days of treatment, while no significant change was observed under the MF treatment during the period (p > 0.05). The TP concentrations in the MF treatment were 34.4% and 26.4% higher than those in the control and MOF treatments, respectively (Figure (d)).
After 180 days of treatment, the MF and MOF treatments increased the AK concentration by 27.0% and 32.1%, respectively, compared to the control, and no significant difference was found between the MF and MOF treatments (Figure (b)). A marked increase in AK concentration under MF and MOF occurred during the first 90 days of treatment, with no significant fluctuation.
Phosphorus activation coefficient
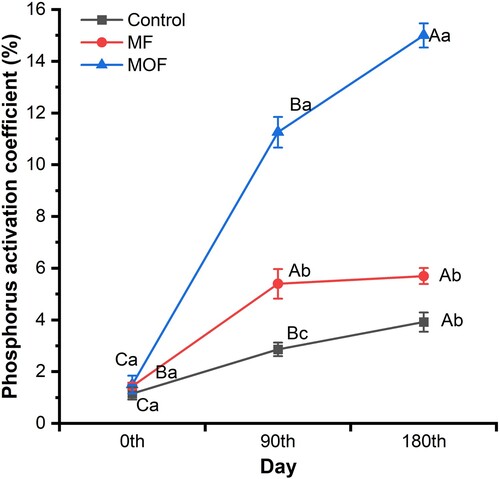
PAC was significantly affected by MF, MOF, and treatment time (Table ). There was a significant difference in PAC between the MF, MOF, and control after 90 days of treatment, while no difference on the original day (Figure ). The PAC under the MF treatment was 88.6% and 45.5% higher than that of the control on the 90th and 180th day of treatment. The PAC under the MOF treatment was 293.3% and 283.3% higher than that of the control on days 90th and 180th day of the treatment, respectively. The MOF treatment increased the PAC by 6.5 and 9.0 times after 90 and 180 days compared with the initial value on the 0th day. The PAC in the MOF treatment was 15.0% on the180th day of treatment, the highest among all treatments.
Figure 3. The phosphorus activation coefficient (PAC) under the mineral fertilizers (MF) and combination of MF and organic fertilizers (MOF) on the 0, 90th, and 180th day of treatment (Mean ± SE, n = 4). Different lowercase letters indicated significant differences between treatments during the same treatment time and different uppercase letters indicated significant differences between treatment time at the level of 0.05.
P fractions
The concentrations of P fractions
The resin-P, NaHCO3-Pi, and NaOH-P fractions were significantly affected by MF and MOF treatments (Table ). The residual-P fraction was significantly influenced by MOF but not by MF. All P fractions under the MOF treatment changed with treatment time, whereas only NaHCO3-P, NaOH-Po, and residual-P fractions under the MF treatment showed a significant dynamic change (Table ).
Table 2. Statistical results of the treatments of mineral fertilizers (MF) and combination of MF and organic fertilizers (MOF) and treatment time (0 day, 90 days, 180 days) on the P fractions, labile P, moderately labile P, and stable P of soil by two-way ANOVA.
On the 0th day when the treatment started, the MF and MOF addition increased the resin-P fraction by 148.7%, whereas the residual-P fraction under the MOF treatment decreased by 33.5% (Table ). After 90 days of treatment, the resin-P and NaHCO3-Pi fractions under the MF treatment were 128.3% and 57.6% higher, respectively, than that of the control. Similarly, they were 361.2% and 124.8% higher, respectively, under the MOF. In addition, the residual-P fraction under MOF treatment was 18.3% lower than that of the control (p < 0.05). Compared to the control, the responses of all P fractions to MF treatment on the 180th day were similar to those on the 90th day. The NaHCO3-Po fraction under the MOF treatment was lower than that under the control during the second 90 days of treatment, while the NaOH-P, HCl-P, and residual-P fractions showed no difference (p < 0.05).
Table 3. The concentrations of soil-P fractions under the mineral fertilizers (MF) and combination of MF and organic fertilizers (MOF) treatments on the 0, 90th, and 180th day of treatment (Mean ± SE, n = 4) (mg kg−1).
The MF and MOF treatments increased the resin-P fraction by 30.3% and 162.1% after 90 days of treatment and 51.6% and 183.1% after 180 days of treatment, respectively, compared with that on the 0th day (Table ). The NaHCO3-Pi fraction under MOF treatment increased by 34.6% after 90 days of treatment and then increased by 115.9% after 180 days. The MF treatment increased the NaHCO3-Po fraction by 150.1% after 90 days of treatment and then continued to increase it by 278.9% (p = 0.55) compared to that on the 0th day. The NaHCO3-Po fraction under MOF treatment doubled during the first 90 days of treatment and then remained stable. The NaOH-Po fraction increased with treatment time, with higher enhancement during the first 90 days (2.2 times for MF and 5.9 times for MOF treatment). In contrast, the HCl-P and residual-P fractions decreased with treatment time.
The proportions of P fractions and P activity levels
The proportions of the P fractions decreased in the order of residual-P > HCl-P > NaHCO3-P > resin-P > NaOH-P for the control and MF treatment on the 0th day and it followed by HCl-P > residual-P > resin-P > NaHCO3-P > NaOH-P for the MOF treatment (Figure (a)). After 90 days of treatment, the MF and MOF treatments increased the proportions of resin-P, NaHCO3-Po, and NaOH-Po, while decreasing the proportion of residual-P (Figure (b)). The resin-P proportion under the MF and MOF treatments was 7.9% and 19.7% higher, respectively, than that of the control on the 90th day of treatment (p < 0.05). After 180 days of treatment, the resin-P proportion under MOF treatment was 28.0%, which was significantly higher than that of the other P fractions (Figure (c)).
Figure 4. The proportion of soil-P fractions on the 0 (a), 90th (b), and 180th (c) day of treatment and the concentrations of labile P (d), moderately labile P (e), and stable P (f), under the mineral fertilizers (MF) and combination of MF and organic fertilizers (MOF) treatments (Mean ± SE, n = 4). Different lowercase letters (d, e, f) indicated significant differences between treatments during the same treatment time and different uppercase letters indicated significant differences between treatment time at the level of 0.05.
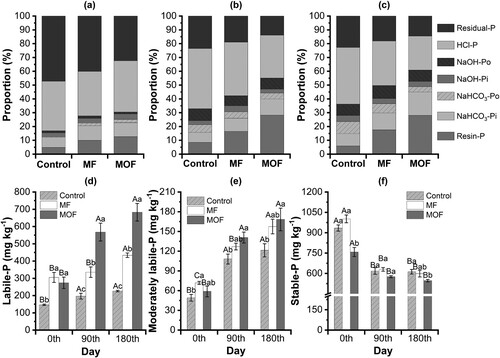
Labile P, moderately labile P, and stable P were significantly affected by the MF and MOF treatments and treatment time, except for stable P under the MF (Table ). The labile P under the MF and MOF treatments was higher than that under the control and increased with treatment time, with a higher increase under the MOF (p < 0.05) (Figure d, e, f). The MF and MOF treatments increased the labile P by 70.9% and 189.3% on the 90th day of treatment, and 91.7% and 201.8% on the 180th day compared with the control. The moderately labile P under the MOF was 30.1% and 38.7% higher than that of the control after 90 and 180 days of treatment, respectively. Contrary to labile P, the stable P under the MOF treatment was 6.8% and 10.7% lower than that under the control on the 90th and 180th day, respectively. There were no significant differences in moderately labile P and stable P between the MF treatment and the control.
Correlation analysis
PAC was positively correlated with soil nutrients and P fractions, with a higher correlation with EC, AP and AK. There was a positive correlation between NaHCO3-Pi and NaOH-Pi as well as between NaHCO3-Po and NaOH-Po (Figure a).
Figure 5. Pearson correlation analysis between the soil properties, nutrients, and soil-P fractions cross the whole experimental period (a), and the redundancy analysis (RDA) between the P fractions and soil chemical properties and nutrients (b). Blue represents a negative correlation and red represents a positive correlation. The ball size represents the correlation coefficient. Significance was shown only if p value was < 0.05. *p < 0.05, **p < 0.01. EC, electrical conductivity; AN, available nitrogen; AP, available phosphorus; AK, available potassium; TP, total phosphorus; PAC, phosphorus activation coefficient.
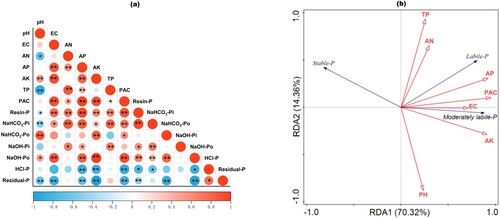
Redundancy analysis showed that the first principal axis explained 70.32% of the soil P fractions and the second principal axis explained 14.36% of the soil P fractions (Figure (b)). Soil-available nutrients were positively correlated with labile P and moderately labile P but negatively correlated with stable P.
Discussion
The addition of MF and MOF improved AN, AP, and AK in soil, and the organic components of garden waste and cattle manure had more marked and longer effects on AP (Figure ). A single MF is not sufficient to maintain long-term soil fertility and nutrient requirements of plants (Steiner et al. Citation2007). Previous studies also showed that the application of manure or garden waste increased the AP content, accompanied by the enhancement of soil microbial activity and soil respiration, which further stimulated the decomposition and release of nutrients (Liu et al. Citation2017; Song et al. Citation2017; Li et al. Citation2023). The increased availability of P caused by manure addition is primarily attributed to microbial Po mineralization. During the process of organic matter degradation, soil pH decreased due to organic acid (including dicarboxylic acids, aromatic acids, fatty acids, citric acid and lactic acid) release, thereby enhance the dilution of Ca phosphates in alkaline soil (Devau et al. Citation2009; Sun et al. Citation2022a). Both MF and MOF treatments decreased soil pH values with greater decline under the MOF. Similar results were reported by Niederberger et al. (Citation2019) and Mao et al. (Citation2023) that the lower pH value was related to the increase of AP and labile P when treated with manure and MF.
As fast cycling P, labile Pi is readily dissolved in the soil solution and therefore is easily accessible P for plants (Yang et al. Citation2012; Li et al. Citation2019; Niederberger et al. Citation2019). The proportion of labile P under the MF and MOF treatments increased with treatment time compared to the control, with a higher increase under the MOF. A study based on six years of application of organic or mineral fertilizers showed that labile P extracted by resin significantly increased (Rigo et al. Citation2019). The application of animal waste and mineral fertilizer led to soil P accumulation, with more labile fractions under pig slurry treatment (Marchezan et al. Citation2024). Animal manure contains nutrients, primarily N and P, and organic substances that are beneficial to plants. Manure-sourced microbes drive soil P transformation (Church et al. Citation2018; Park et al. Citation2022; Sun et al. Citation2022a). The bioavailable P in manure directly increased the soil AP content (Zhang et al. Citation2023). Verma et al. (Citation2016) reported that garden waste compost increased NaHCO3-Pi, microbial P, NaOH-Pi, HCl-P, and residual-P, indicating that garden waste increased soil P availability while also resulted in the formation of less labile P pools. Thus, organic amendment could serve as plant P sources in the longer term. Garden waste can increase soil aeration and structural stability (Li et al. Citation2020; Citation2023), which may be advantageous for AP activation. The higher PAC (15.0%) under the MOF treatment indicated that adding garden waste and manure to MF improved the availability of soil P better than MF alone.
The transformation from stable P to available P is difficult when PAC is less than 2.0% (Wang et al. Citation2014; Wu et al. Citation2017). Both MF and MOF significantly increased PAC with more marked improvement under the MOF. Consistent with the results reported by Hayatu et al. (Citation2023), the PAC significantly increased under mineral fertilizers (less than two times) and mineral fertilizer plus manure (greater than two times) treatments according to a 30-years tracking experiment. The higher PAC with manure addition was related to an increase in humic acids. Since there was no significant difference in TP between control and MOF, and the stable P always occupied the highest proportion in the control soil across the entire experimental period, the main reason for P deficiency in the initial soil was that the activated AP was insufficient, consistent with hypothesis 1. Sun et al. (Citation2022b) also demonstrated that soils or plants exhibiting P deficiency symptoms are not due to a lack of TP but to lower P utilization efficiency because some mineral elements like iron, aluminum, and calcium act with P and form compounds with low solubility.
The greater increase in the resin-P fraction and decrease in the residual-P fraction under MOF treatment might be related to three aspects. One reason attributed to the decline in pH, which helped transform the residual-P fraction into the resin-P fraction. Ye et al. (Citation2015) found that pH decrease stimulated the mobilization of stable P into labile P. In addition, manure enriched most of bacterial taxa involved in P transformation. The organic matter contained in manure also indirectly affected microbial P transformation capacity (Zhang et al. Citation2023). The addition of garden waste may enhance cycling between soil P pools via mineralization, immobilization, and adsorption (Li et al. Citation2023). Last but not least, garden waste and manure provided sufficient AP sources and other nutrients, like AN and AK (Figure (a)). The synergistic effect between garden waste and manure, between garden waste and mineral fertilizers facilitated the decomposition of organic matter and nutrient release (Gong et al. Citation2019; Li et al. Citation2023), which could increase labile Pi and moderately labile Pi (Shao et al. Citation2023). The increase in the NaHCO3-Pi fraction was closely related to the organic matter provided by the manure (De Schrijver et al. Citation2012). Consistent with hypothesis 2, MOF treatment significantly increased the labile-P fraction, which is a transiently available P for plant growth.
During P mineralization process, the orthophosphate content in soil increased, while Po decreased. Consistent with hypothesis 3, MOF treatment significantly increased the NaHCO3-Pi fraction, which is a transiently available P fraction for plant growth (Bowman and Cole Citation1978; Tiessen and Moir Citation1993). The NaHCO3-Po under the MOF was significantly lower than MF and the control because the microbes in manure mobilizing insoluble P-complexes into a soluble form by mineralizing organic P (Amadou et al. Citation2021). Chen et al. (Citation2020c) reported that manure application enhanced soil microbial organic P mineralization by increasing the abundance of microbial taxa involved in organic P mineralization. In addition, organic matter provided by the manure changed soil P absorption and desorption, leading to the changes of P dynamics in soil (von Wandruszka Citation2006).
Moderately labile P requires weeks to months of transformation to be available for plant uptake, and its content depends on the mineralization rate and dynamic balance between labile and stable P (Qin et al. Citation2020). The content of moderately labile P under the MF and MOF treatments was higher than that of the control, and no significant difference in the moderately labile P was observed between the MF and MOF, indicating that MF efficiently increased the moderately labile P, and the addition of garden waste and manure maintained the dynamic balance between P fractions. Ahmed et al. (Citation2019) found that inorganic fertilizers increased the moderately labile P fractions of NaOH-Pi and NaOH-Po by 163.5% and 183.8%, respectively, under a double rice cropping system. Stable P of HCl-P takes a very long time (years-millennia) to transform, much slower than the other P fractions (Helfenstein et al. Citation2018). In our study, the MF and MOF treatments did not significantly affect the stable P content.
Conclusions
The application of mineral fertilizers (MF) and the combination of MF and organic fertilizers (MOF) increased the phosphorus activation coefficient, phosphorus (P) fractions of resin-P, NaHCO3-P, and NaOH-P, and available nutrients of N, P, and K, while reducing soil pH value. The addition of garden waste and manure produced more efficient effects on the soil AP than MF alone based on the higher contents of resin-P and NaHCO3-Pi fractions, and promoted the soil mineralization process due to lower contents of NaHCO3-Po fraction than the control and MF. All the findings from the study indicates that the combination of MF and organic fertilizers is a more efficient and longer way to improve soil P availability and mitigate soil P deficiency.
Author contributions
Conceptualization and design: Yuxin Luo and Jing Liang. Analysis and interpretation of the data: Yuxin Luo. Drafting of the paper: Yuxin Luo and Jing Liang. Funding acquisition: Chunliang Zhou. Investigation: Jing Liang. Methodology: Jing Liang. Validation: Yuxin Luo. Supervision: Chunliang Zhou. Writing, review and editing: Yuxin Luo, Jing Liang and Chunliang Zhou. All authors approved the final manuscript before submitting it for publication and agreed to be accountable for the all aspects of the work.
Acknowledgements
We are very grateful to Ms. Juan Shen for the lab experiment instruction.
Disclosure statement
No potential conflict of interest was reported by the author(s).
Data availability statement
The data are publicly available in figshare.com at https://doi.org/10.6084/m9.figshare.25422088.
Additional information
Funding
References
- Ahmed W, Liu K, Qaswar M, Huang J, Huang Q, Xu Y, Ali S, Mehmood S, Asghar RMA, Mahmood S, Zhang H. 2019. Long-term mineral fertilization improved the grain yield and phosphorus use efficiency by changing soil P fractions in Ferralic Cambisol. Agronomy. 9(12):784. doi:10.3390/agronomy9120784.
- Amadou I, Houben D, Faucon MP. 2021. Unravelling the role of rhizosphere microbiome and root traits in organic phosphorus mobilization for sustainable phosphorus fertilization. A review. Agronomy. 11(11):2267. doi:10.3390/agronomy11112267.
- Barlow K, Nash D, Hannah M, Robertson F. 2007. The effect of fertiliser and grazing on nitrogen export in surface runoff from rain-fed and irrigated pastures in south-eastern Australia. Nutr Cycling Agroecosyst. 77(1):69–82. doi:10.1007/s10705-006-9046-6.
- Bowman RA, Cole CV. 1978. Transformations of organic phosphorus substrates in soils as evaluated by NaHCO3 extraction. Soil Sci. 125(1):49–54. doi:10.1097/00010694-197801000-00008.
- Chatzistathis T, Kavvadias V, Sotiropoulos T, Papadakis IE. 2021. Organic fertilization and tree orchards. Agriculture. 11:692. doi:10.3390/agriculture11080692.
- Chen M, Zhang S, Liu L, Wu L, Ding X. 2021. Combined organic amendments and mineral fertilizer application increase rice yield by improving soil structure, P availability and root growth in saline-alkaline soil. Soil Tillage Res. 212:105060. doi:10.1016/j.still.2021.105060.
- Chen Y, Sun R, Sun T, Chen P, Yu Z, Ding L, Jiang Y, Wang X, Dai C, Sun B. 2020. Evidence for involvement of keystone fungal taxa in organic phosphorus mineralization in subtropical soil and the impact of labile carbon. Soil Biol Biochem. 148:107900. doi:10.1016/j.soilbio.2020.107900.
- Church CD, Hristov AN, Kleinman PJA, Fishel SK, Reiner MR, Bryant RB. 2018. Versatility of the manure phosphorus extraction (maphex) system in removing phosphorus, odor, microbes, and alkalinity from dairy manures: a four-farm case study. Appl Eng Agric. 34(3):567–572. doi:10.13031/aea.12632.
- Darch T, Blackwell MSA, Hawkins JMB, Haygarth PM, Chadwick D. 2014. A meta-analysis of organic and inorganic phosphorus in organic fertilizers, soils, and water: implications for water quality. Crit Rev Environ Sci Technol. 44(19):2172–2202. doi:10.1080/10643389.2013.790752.
- De Schrijver A, Vesterdal L, Hansen K, De Frenne P, Augusto L, Achat DL, Staelens J, Baeten L, Keersmaeker LD, Neve SD, Verheyen K. 2012. Four decades of post-agricultural forest development have caused major redistributions of soil phosphorus fractions. Oecologia. 169:221–234. doi:10.1007/s00442-011-2185-8.
- Devau N, Le Cadre E, Hinsinger P, Jaillard B, Gérard F. 2009. Soil pH controls the environmental availability of phosphorus: experimental and mechanistic modelling approaches. Appl Geochem. 24(11):2163–2174. doi:10.1016/j.apgeochem.2009.09.020.
- Feng H, Sekaran U, Wang T, Kumar S. 2021. On-farm assessment of cover cropping effects on soil C and N pools, enzyme activities, and microbial community structure. J Agric Sci. 159(3–4):216–226. doi:10.1017/S002185962100040X.
- Fu D, Wu X, Duan C, Chadwick DR, Jones DL. 2020. Response of soil phosphorus fractions and fluxes to different vegetation restoration types in a subtropical mountain ecosystem. Catena. 193:104663. doi:10.1016/j.catena.2020.104663.
- Gao P, Zhang T, Lei XY, Cui XW, Lu YX, Fan PF, Long SP, Huang J, Gao JS, Zhang ZH, Zhang HM. 2023. Improvement of soil fertility and rice yield after long-term application of cow manure combined with inorganic fertilizers. J Integr Agric. 22(7):2221–2232. doi:10.1016/j.jia.2023.02.037.
- Gao Y, Tariq A, Zeng F, Graciano C, Zhang Z, Sardans J, Peñuelas J. 2022. Allocation of foliar-P fractions of Alhagi sparsifolia and its relationship with soil-P fractions and soil properties in a hyperarid desert ecosystem. Geoderma. 407:115546. doi:10.1016/j.geoderma.2021.115546.
- Gong X, Li S, Carson MA, Chang SX, Wu Q, Wang L, An Z, Sun X. 2019. Spent mushroom substrate and cattle manure amendments enhance the transformation of garden waste into vermicomposts using the earthworm Eisenia fetida. J Environ Manag. 248:109263. doi:10.1016/j.jenvman.2019.109263.
- Han J, Shi J, Zeng L, Xu J, Wu L. 2015. Effects of nitrogen fertilization on the acidity and salinity of greenhouse soils. Environ Sci Pollut Res. 22:2976–2986. doi:10.1007/s11356-014-3542-z.
- Hayatu NG, Liu Y, Zhang S, Huang J, Han T, Khan MN, Daba NA, Noma SS, Lv Z, Hou H, et al. 2023. Long-Term organic manure substitution increases yield and phosphorus use efficiency in a double-rice system by altering soil phosphorus uptake and apparent balance. Agronomy. 13:1440. doi:10.3390/agronomy13061440.
- He Y, DeSutter T, Prunty L, Hopkins D, Jia X, Wysocki DA. 2012. Evaluation of 1:5 soil to water extract electrical conductivity methods. Geoderma. 185-186:12–17. doi:10.1016/j.geoderma.2012.03.022.
- Hedley MJ, Stewart JWB, Chauhan BS. 1982. Changes in inorganic and organic soil phosphorus fractions induced by cultivation practices and by laboratory incubations. Soil Sci Soc Am J. 46(5):970–976. doi:10.2136/sssaj1982.03615995004600050017x.
- Helfenstein J, Tamburini F, von Sperber C, Massey MS, Pistoccho C, Chadwick OA, Vitousek PM, Kretzschmar R, Frossard E. 2018. Combining spectroscopic and isotopic techniques gives a dynamic view of phosphorus cycling in soil. Nat Commun. 9(1):3226. doi:10.1038/s41467-018-05731-2.
- Huang Z, Wu Q, Chen Z, Wu G, Li J, Zhou W, Pan X, Zhang X, Chen D. 2023. Varying phosphate fertilizers exerted different effects on inorganic phosphorus transformation, tobacco growth, and phosphorus use efficiency in purple soil. J Soil Sci Plant Nutr. 23:3991–4003. doi:10.1007/s42729-023-01317-0.
- Johnston AE, Poulton PR, Fixen PE, Curtin D. 2014. Advances in Agronomy. Adv Agron. 123:177. doi:10.1016/B978-0-12-420225-2.00005-4.
- Kokulan V, Akinremi OO, Moulin AP. 2022. The seasonality of nitrate and phosphorus leaching from manure and chemical fertilizer added to a Chernozemic soil in Canada. J Environ Qual. 51:1259–1269. doi:10.1002/jeq2.20399.
- Lee CH, Park CY, Park D, Jeon K, Kim WT. 2004. Long-term effects of fertilization on the forms and availability of soil phosphorus in rice paddy. Chemosphere. 56(3):299–304. doi:10.1016/j.chemosphere.2004.02.027.
- Li FR, Liu LL, Liu JL, Yang K. 2019. Abiotic and biotic controls on dynamics of labile phosphorus fractions in calcareous soils under agricultural cultivation. Sci Total Environ. 681:163–174. doi:10.1016/j.scitotenv.2019.05.091.
- Li J, Zhang H, Zheng L. 2023. Influence of organic amendments based on garden waste for microbial community growth in coastal saline soil. Sustainability. 15(6):5038. doi:10.3390/su15065038.
- Li Y, Sun B, Deng T, Lian P, Chen J, Peng X. 2021. Safety and efficiency of sewage sludge and garden waste compost as a soil amendment based on the field application in woodland. Ecotoxicol Environ Saf. 222:112497. doi:10.1016/j.ecoenv.2021.112497.
- Li Z, Zhang X, Xu J, Cao K, Wang J, Xu C, Cao W. 2020. Green manure incorporation with reductions in chemical fertilizer inputs improves rice yield and soil organic matter accumulation. J Soils Sediments. 20:2784–2793. doi:10.1007/s11368-020-02622-2.
- Liu Z, Rong Q, Zhou W, Liang G. 2017. Effects of inorganic and organic amendment on soil chemical properties, enzyme activities, microbial community and soil quality in yellow clayey soil. PLoS One. 12(3):e0172767. doi:10.1371/journal.pone.0172767.
- Lu RK. 1999. Analysis of soil agrochemistry. Beijing: Chinese Agricultural Science and Technology Press.
- Mao Y, Hu W, Li Y, Li Y, Lei B, Zheng Y. 2023. Long-term cattle manure addition enhances soil-available phosphorus fractions in subtropical open-field rotated vegetable systems. Front Plant Sci. 14:1138207. doi:10.3389/fpls.2023.1138207.
- Marchezan C, Abdala DB, Boitt G, Ferreira PAA, Ceretta1 CA, da Silva ICB, Tiecher T, Gatiboni LC, Thoma AL, Palermo NM, et al. 2024. Consecutive applications of mineral fertilizer or animal wastes and effects on soil phosphorus after thirteen years of no-tillage. J Soil Sci Plant Nutr. doi:10.1007/s42729-024-01683-3.
- McDowell RW, Catto W. 2005. Alternative fertilisers and management to decrease incidental phosphorus loss. Environ Chem Lett. 2(4):169–174. doi:10.1007/s10311-005-0099-6.
- Meena MD, Narjary B, Sheoran P, Jat HS, Joshi PK, Chinchmalatpure AR, Yadav G, Yadav RK, Meena MK. 2018. Changes of phosphorus fractions in saline soil amended with municipal solid waste compost and mineral fertilizers in a mustard-pearl millet cropping system. Catena. 160:32–40. doi:10.1016/j.catena.2017.09.002.
- Negassa W, Leinweber P. 2009. How does the Hedley sequential phosphorus fractionation reflect impacts of land use and management on soil phosphorus: a review. J Plant Nutr Soil Sci. 172(3):305–325. doi:10.1002/jpln.200800223.
- Niederberger J, Kohler M, Bauhus J. 2019. Distribution of phosphorus fractions with different plant availability in German forest soils and their relationship with common soil properties and foliar P contents. Soil 5(2):189–204. doi:10.5194/soil-5-189-2019.
- Oliveira Filho JS, Ferrari AC, Pereira MG, Pinto LASR, Zonta E, Matos TA. 2020. Phosphorus accumulation in soil after successive applications of swine manure: a long-term study in Brazil. Environmental Earth Sciences. 79:62. doi:10.1007/s12665-019-8805-z.
- Olsen SR. 1954. Estimation of available phosphorus in soils by extraction with sodium bicarbonate. Vol. 939. Washington, DC, USA: United States Department of Agriculture.
- Osztoics E, Csathó P, Németh T, Baczó Gy, Magyar M, Radimszky L, Osztoics A. 2005. Influence of phosphate fertilizer sources and soil properties on trace element concentrations of red clover. Commun Soil Sci Plant Anal 36(4–6):557–570. doi:10.1081/CSS-200043284.
- Park Y, Solhtalab M, Thongsomboon W, Aristilde L. 2022. Strategies of organic phosphorus recycling by soil bacteria: acquisition, metabolism, and regulation. Environ Microbiol Rep. 14:3–24. doi:10.1111/1758-2229.13040.
- Qin X, Guo S, Zhai L, Pan J, Khoshnevisan B, Wu S, Wang H, Yang B, Liu H. 2020. How long-term excessive manure application affects soil phosphorous species and risk of phosphorous loss in fluvo-aquic soil. Environ Pollut. 266:115304. doi:10.1016/j.envpol.2020.115304.
- Reyes-Martín MP, Ortiz-Bernad I, Lallena AM, San-Emeterio LM, Martínez-Cartas ML, Ondoño EF. 2022. Reuse of pruning waste from subtropical fruit trees and urban gardens as a source of nutrients: changes in the physical, chemical, and biological properties of the soil. Applied Sciences. 12(1):193. doi:10.3390/app12010193.
- Rigo AZ, Corrêa JC, Mafra AL, Hentz P, Grohskopf MA, Gatiboni LC, Bedendo G. 2019. Phosphorus fractions in soil with organic and mineral fertilization in a crop-livestock integration system. Rev Bras Cienc Solo. 43:e0180130. doi:10.1590/18069657rbcs20180130.
- Robertson FA, Nash DM. 2008. Phosphorus and nitrogen in soil, plants, and overland flow from sheep-grazed pastures fertilized with different rates of superphosphate. Agric Ecosyst Environ 126(3–4):195–208. doi:10.1016/j.agee.2008.01.023.
- Shao L, Peng Y, Liu H, Zhao R, Jiang L, Li Y, Han P, Jiang Y, Wei C, Han X, Huang J. 2023. Applied phosphorus is maintained in labile and moderately occluded fractions in a typical meadow steppe with the addition of multiple nutrients. J Environ Manag. 345:118807. doi:10.1016/j.jenvman.2023.118807.
- Soltangheisi A, de Moraes MT, Cherubin MR, Alvarez DO, de Souza LF, Bieluczyk W, Navroski D, Teles B, Pavinato AP, Martinelli PS, et al. 2019. Forest conversion to pasture affects soil phosphorus dynamics and nutritional status in Brazilian Amazon. Soil and Tillage Research. 194:104330. doi:10.1016/j.still.2019.104330.
- Song K, Xue Y, Zheng X, Lv W, Qiao H, Qin Q, Yang J. 2017. Effects of the continuous use of organic manure and chemical fertilizer on soil inorganic phosphorus fractions in calcareous soil. Sci Rep. 7(1):1164. doi:10.1038/s41598-017-01232-2.
- Song W, Shu A, Liu J, Shi W, Li M, Zhang W, Li Z, Liu G, Yuan F, Zhang S, et al. 2022. Effects of long-term fertilization with different substitution ratios of organic fertilizer on paddy soil. Pedosphere. 32(4):637–648. doi:10.1016/S1002-0160(21)60047-4.
- Steiner C, Teixeira WG, Lehmann J, Nehls T, de Macêdo JLV, Blum WE, Zech W. 2007. Long term effects of manure, charcoal and mineral fertilization on crop production and fertility on a highly weathered Central Amazonian upland soil. Plant Soil. 291:275–290. doi:10.1007/s11104-007-9193-9.
- Sun R, Niu J, Luo B, Wang X, Li W, Zhang W, Wang F, Zhang C, Ye X. 2022a. Substitution of manure for mineral P fertilizers increases P availability by enhancing microbial potential for organic P mineralization in greenhouse soil. Front Bioeng Biotechnol. 10:1078626. doi:10.3389/fbioe.2022.1078626.
- Sun R, Zhang W, Liu Y, Yun W, Luo B, Chai R, Zhang C, Xiang X, Su X. 2022b. Changes in phosphorus mobilization and community assembly of bacterial and fungal communities in rice rhizosphere under phosphate deficiency. Front Microbiol. 13:953340. doi:10.3389/fmicb.2022.953340.
- Takahashi S, Anwar MR. 2007. Wheat grain yield, phosphorus uptake and soil phosphorus fraction after 23 years of annual fertilizer application to an Andosol. Field Crops Res. 101:160–171. doi:10.1016/j.fcr.2006.11.003.
- Tiessen H, Moir J. 1993. Characterization of available P by sequential extraction. In: Carter MR, editor. Soil sampling and methods of analysis. Boca Raton: Lewis Publishers; p. 187–201.
- Tits M, Elsen A, Bries J, Vandendriessche H. 2014. Short-term and long-term effects of vegetable, fruit and garden waste compost applications in an arable crop rotation in Flanders. Plant Soil. 376:43–59. doi:10.1007/s11104-012-1318-0.
- Turner BL, Condron LM, Richardson SJ, Peltzer DA, VJ A. 2007. Soil organic phosphorus transformations during pedogenesis. Ecosystems. 10:1166–1181. doi:10.1007/s10021-007-9086-z.
- Verma SL, Marschner P. 2013. Compost effects on microbial biomass and soil P pools as affected by particle size and soil properties. J Soil Sci Plant Nut 13(2):313–328. doi:10.4067/S0718-95162013005000026.
- Verma SL, Setia R, Marschner P. 2016. The size of p pools in soils is affected by soil properties and compost addition. Commun Soil Sci Plant Anal 47(10):1317–1328. doi:10.1080/00103624.2016.1166379.
- von Wandruszka R. 2006. Phosphorus retention in calcareous soils and the effect of organic matter on its mobility. Geochem Trans. 7:6. doi:10.1186/1467-4866-7-6.
- Waldrip HM, He Z, Erich MS. 2011. Effects of poultry manure amendment on phosphorus uptake by ryegrass, soil phosphorus fractions and phosphatase activity. Biol Fertil Soils. 47:407–418. doi:10.1007/s00374-011-0546-4.
- Wan W, Li X, Han S, Wang L, Luo X, Chen W, Huang Q. 2020. Soil aggregate fractionation and phosphorus fraction driven by long-term fertilization regimes affect the abundance and composition of P-cycling-related bacteria. Soil and Tillage Research. 196:104475. doi:10.1016/j.still.2019.104475.
- Wang JJ, Bai JH, Zhao QQ, Lu QQ, Jia J, Wen X. 2014. Profile characteristics of carbon, nitrogen and phosphorus in soils of Phragmites australis marshes in Halahai wetlands. Wetland Science. 12:690–696. doi:10.13248/j.cnki.wetlandsci.2014.06.002.
- Wang Q, Qin Z, Zhang W, Chen Y, Zhu P, Peng C, Wang L, Zhang S, Colinet G. 2022. Effect of long-term fertilization on phosphorus fractions in different soil layers and their quantitative relationships with soil properties. Journal of Integrative Agriculture 21(9):2720–2733. doi:10.1016/j.jia.2022.07.018.
- Wright SJ, Turner BL, Yavitt JB, Harms KE, Kaspari M, Tanner EVJ, Bujan J, Griffin EA, Mayor JR, Pasquini SC, et al. 2018. Plant responses to fertilization experiments in lowland, species rich, tropical forests. Ecology. 99(5):1129–1138. doi:10.1002/ecy.2193.
- Wu L, Wei C, Zhang S, Wang Y, Kuzyakov Y, Ding X. 2019. MgO-modified biochar increases phosphate retention and rice yields in saline-alkaline soil. J Cleaner Prod. 235:901–909. doi:10.1016/j.jclepro.2019.07.043.
- Wu Q, Zhang S, Zhu P, Huang S, Wang B, Zhao L, Xu M. 2017. Characterizing differences in the phosphorus activation coefficient of three typical cropland soils and the influencing factors under long-term fertilization. PLoS One. 12(5):e0176437. doi:10.1371/journal.pone.0176437.
- Xin X, Zhang J, Zhu A, Zhang C. 2016. Effects of long-term (23 years) mineral fertilizer and compost application on physical properties of fluvo-aquic soil in the North China Plain. Soil and Tillage Research. 156:166–172. doi:10.1016/j.still.2015.10.012.
- Yang JC, Wang ZG, Zhou J, Jiang HM, Zhang JF, Pan P, Han Z, Lu C, Li LL, Ge CL. 2012. Inorganic phosphorus fractionation and its translocation dynamics in a low-P soil. J Environ Radioact. 112:64–69. doi:10.1016/j.jenvrad.2012.03.011.
- Ye D, Li T, Yu H, Chen G, Zheng XZZ, Li J. 2015. P accumulation of polygonum hydropiper, soil P fractions and phosphatase activity as affected by swine manure. Appl Soil Ecol. 86:10–18. doi:10.1016/j.apsoil.2014.10.002.
- Zhang L, Niu J, Lu X, Zhao Z, Li K, Wang F, Zhang C, Sun R. 2023. Dosage effects of organic manure on bacterial community assemblage and phosphorus transformation profiles in greenhouse soil. Front Microbiol. 14:1188167. doi:10.3389/fmicb.2023.1188167.
- Zhao YG, Li Y, Wang SJ, Wang J, Xu LZ. 2020. Combined application of a straw layer and flue gas desulphurization gypsum to reduce soil salinity and alkalinity. Pedosphere. 30(2):226–235. doi:10.1016/S1002-0160(17)60480-6.