
Abstract
Introduction
To examine the reliability, sensitivity, and specificity of fluorescent oxidation products (FlOPs; markers of global oxidative damage) for measuring global oxidative stress.
Methods
To improve FlOP measurement reliability, we mixed plasma samples with the extractant at eight ratios and measured FlOPs with a fluorescent microplate reader (excitation/emission wavelengths 320/420 nm denoted FlOP_320; 360/420 nm [FlOP_360]; and 400/475 nm [FlOP_400]). In a human study, we examined the reliability of an improved FlOP measurement. In an animal study, we examined the sensitivity and specificity of FlOPs for measuring D-galactose induced global oxidative stress.
Results
At a 1:20 (plasma/extractant) mixture ratio, the overall inter-/intra-assay coefficients of variation (CV) for FlOP measurements among healthy and coronary heart disease participants were <3.6%/<2.7% and <4.4%/<2.0%, respectively. On day 30 of the animal experiment, the Pearson correlations (r) of FlOP_320 and FlOP_360 with D-galactose dose were 0.816 and 0.801, respectively, which were 3-12 times higher than those of malondialdehyde (0.183), 8-hydroxyguanosine (0.157), pentosidine (0.254), and nitrotyrosine (0.068) for measuring D-galactose-induced oxidative damage. FlOP_360 (r = 0.225, P = 0.045), but not FlOP_320 and FlOP_400, were significantly correlated with c-reactive protein, a marker of inflammation.
Conclusions
FlOP_320 are reliable, sensitive and specific markers for measuring global oxidative stress.
Key policy highlights
Fluorescent oxidation products (FlOPs) are a reliable marker of oxidative stress
FlOPs at 320/420 nm are more sensitive than traditional markers
FlOP at 320/420 nm did not reflect inflammation as quantified by c-reactive protein
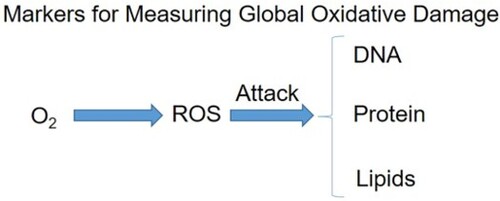
GRAPHICAL ABSTRACT
Introduction
Oxidative stress is defined as excessive reactive oxygen species (ROS) that cannot be reduced by endogenous antioxidants (Andrianjafimasy et al. Citation2017; Yang et al. Citation2015). Oxidation causes oxidative damage to proteins, lipids, and DNA (Fortner et al. Citation2013; Yang et al. Citation2015). Oxidative damage induced by environmental exposures is involved in the development of many chronic diseases such as cardiovascular diseases, chronic obstructive pulmonary disease, chronic kidney disease, neurodegenerative diseases, and cancer (Liguori et al. Citation2018; Zhou et al. Citation2023).
To date, reliable measurement of oxidative stress in vivo is still warranted. Measurement of ROS in large epidemiological studies is generally not feasible because of their short half-lives. In addition, it has been suggested that the assay of malondialdehyde (MDA) in plasma or serum is not reliable owing to its formidable challenge from both analytical and biological perspectives (Tsikas Citation2017). Using enzyme-linked immunosorbent assay (Elisa), Alajbeg et al. found that the coefficient of variation (CV) for MDA measurements is 16.6% (Alajbeg et al. Citation2017). The assay of other oxidative stress biomarkers (i.e. 8-hydroxy-desoxyguanosine [8-OHdG], S-glutathionylation, myeloperoxidase, oxidized low-density lipoprotein [OxLDL] and F2-isoprostane) was also reported to be unreliable to some extent (CV: 1-16.6%) (Wu et al. Citation2004; Bukowski et al. Citation2015; Alajbeg et al. Citation2017; Chu and Stokol Citation2021; Khongwichit et al. Citation2023).
There are many traditional biomarkers of oxidative stress, such as MDA, 8-OHdG, pentosidine (PTD), and nitrotyrosine (NT) (Kageyama et al. Citation2007; Khoubnasabjafari et al. Citation2016; Lan et al. Citation2020; Murad et al. Citation2021). MDA is commonly used to quantify lipid peroxidation (Khoubnasabjafari et al. Citation2016). 8-OHdG mainly reflects oxidative damage to the DNA (Lan et al. Citation2020). PTD is an indicator of oxidative damage to sugars (Kageyama et al. Citation2007). NT is a marker of oxidative protein damage (Murad et al. Citation2021). These biomarkers are not sensitive for measuring global oxidative stress because they only measure a portion in vivo oxidative damage.
Plasma fluorescent oxidation products (FlOPs) are formed from the interaction of oxidation products with proteins, phospholipids, and nucleic acids, producing chromophores with characteristic fluorescence spectra; they reflect global oxidative damage (Frankel Citation1980). Currently, plasma samples were extracted with ethanol: ether (3:1, v/v). After centrifugation, the supernatants were used to measure FlOPs using a regular fluorescent spectrophotometer; the CV for FlOP measurements is <13% after adjusting for batch-to-batch variations (Yang et al. Citation2014). We may improve FlOP measurement CV using a fluorescent microplate reader because the microplate has smaller batch-to-batch and well-to-well variations than cuvettes in a regular fluorescent spectrophotometer. Furthermore, the use of a fluorescent microplate reader has the advantages of small sample volume requirement, high throughput of samples, and ease of detection (Kedar et al. Citation2017). In addition, it has been noted that assay of FlOPs is 10–100 times more sensitive than the colorimetric thiobarbituric acid (TBA) reactant assay of lipid peroxidation (Dillard and Tappel Citation1971). However, the sensitivity of FlOPs in measuring oxidative stress in vivo remains unclear. Furthermore, since oxidation usually coexists with inflammation (Kong et al. Citation2014), there is still a need to determine whether FlOPs are specific markers of oxidation rather than inflammation. Many laboratory factors (e.g. blood sample hemolysis, transportation, storage, and freeze-thaw) can influence FlOP measurements, but they have yet to be determined.
Therefore, after updating the FlOP measurement method, we examined the reliability, sensitivity, and specificity of FlOPs for measuring global oxidative stress. We also determined whether laboratory factors (e.g. blood sample hemolysis, transportation, storage, and freeze-thaw procedures) influenced the FlOP assay.
Materials and methods
This study was conducted in both humans and animals. In a human study, we examined the reliability of an improved FlOP measurement. We also determined whether blood sample hemolysis, transportation, storage, and freeze-thaw procedures influenced the FlOP assay. In an animal study, we examined the sensitivity and specificity of FlOPs for measuring D-galactose induced global oxidative stress. The Institutional Review Board (IRB) of the School of Public Health, Jilin University, approved the animal and human research (Project #: 2021-12-06).
Human study
Participants
To examine FlOP measurement reliability, we collected blood samples from eight healthy female volunteers. To determine the influential factors (e.g. blood sample hemolysis, transportation, storage, and freeze-thaw procedures) for FlOP measurements, we collected blood samples from another set of four males and four females; each male was individually matched with a female by age (± 2 years). All 16 participants were free of oxidative stress-related diseases (e.g. hypertension, diabetes, cardiovascular diseases, chronic kidney diseases, asthma, neurodegenerative diseases, and cancers) and had no history of smoking and alcohol intake. To determine whether oxidative stress related disease impacted FlOP measurement reliability and influential factors, we additionally recruited eight participants (4 males and 4 females) with recently diagnosed coronary heart disease (CHD) at the Second Hospital of Jilin University; the time between CHD diagnosis and blood draw was within 2 days. We collected blood samples from CHD patients before any treatments. All the participants provided written informed consent.
Characteristics of participants
Data on age, sex, and diabetes history were collected face-to-face with a structured questionnaire. Body weight and height were directly measured; body mass index (BMI) was body weight (kg) divided by body height squared (m2).
Blood collection and processing
Except for CHD patients, all subjects fasted (except for water) for more than 8 h before the blood was drawn. Nurses collected fresh venous blood samples in eight 4 ml lithium heparin-treated tubes (Catalog no: 367884, BD, New Jersey). After centrifugation at 4°C and 3000 rpm for 10 min, plasma samples were divided into aliquots.
FlOP measurement
We mixed plasma samples from healthy and CHD participants with ethanol: ether (3:1, v/v) at eight ratios (1:5, 1:10, 1:15, 1:20, 1:25, 1:30, 1:50, and 1:100; v/v). These mixed samples were centrifuged at 3000 rpm for 10 min at 4°C to obtain supernatants. The supernatants were measured using a 96-well microplate (Product number: 3925, Corning®, New York, USA) and a fluorescent microplate reader (Cytation 3 Cell Imaging Multi-Mode reader from BioTek, Vermont, USA) at three excitation/emission wavelengths (excitation/emission wavelengths 320/420 nm, denoted FlOP_320; 360/420 nm [FlOP_360]; and 400/475 nm [FlOP_400]). According to a previous publication (Frankel Citation1980), FlOP_320 are the oxidation products (e.g. lipid hydroperoxides, aldehydes and ketones) reacted with DNA when metals are presented. FlOP_360 are generated from oxidized phospholipids or from lipid oxidation products reacting with proteins, DNA and carbohydrates in the presence of phospholipids. FlOP_400 are interacted oxidation products between MDA, proteins and phospholipids.
FlOP measurement reliability test
Reliability test was assessed by inter- and intra- assay variations. Inter-assay variations (also referred to as batch-to-batch variations) were assessed on two different days from repeated experiments using different microplates. Intra-assay variations were determined on the same day, using the same microplate. Each assay was repeated three times for healthy volunteers and two times for CHD patients using the same microplate. The inter- and intra-assay variations were assessed using CV, which were the means of the FlOP measurements divided by their standard deviations (SDs).
Effects of laboratory factors on FlOP measurements
Whole blood samples were used to determine whether different levels of hemolysis influenced the FlOP measurements. According to the Mehmet’s method (Gidske et al. Citation2018), we used 1 ml syringes to obtain slight and severe hemolysis of blood samples. The samples with slight and severe hemolysis underwent suction and drainage twice and eight times, respectively. After centrifuging the blood samples under the same conditions, we measured FlOPs using the aforementioned pretested methods (plasma: extractant = 1:20 (v/v)), which had the lowest inter- and intra-assay CV.
Whole blood samples were also used to determine whether transportation time influenced the FlOP measurements. One tube of whole blood sample was divided into aliquots; these aliquots were placed on ice for either 4, 8, 12, 24, 36, 48, and 72 h. The corresponding FlOPs were then measured.
Plasma samples stored at −80°C were used to determine whether long-term storage influenced FlOP measurements. We quantified the FlOP measurements of these plasma samples after storage for 7, 14, 30, 60, 90, 180, and 360 days.
Plasma samples stored at −80°C were used to determine whether freeze-thaw procedures influenced FlOP measurements. The freeze-thaw process was repeated 1, 5, 10, and 15 times for each plasma sample prior to the FlOP measurement.
We repeated the above experiments in CHD patients. The long-term stability of the FlOP measurements was tested for 90 days for CHD patients.
Animal study
Animals
Eight-week-old male Wistar albino rats, weighing 220-260 g, were purchased from the Beijing Huafukang Biotechnology Co. Under specific pathogen-free conditions, all rats ate, drank, and defecated freely. Experiments were conducted after one week of domestication and observation. At the beginning of the experiment, 30 rats were randomly divided into 3 groups (10 rats per group). Based on a previous study (Arifin and Aahiruddin Citation2017), we estimated that the maximum number of rats per group required for this research were 7. No exclusions of animals were made. No blinding of researchers was necessary as there were no subjective measurements in this research. We generated randomization sequence using the ‘RAND’ function in Excel. All rats were weighed every seven days from the beginning of the experiment.
D-galactose intervention
According to previous studies (Wei et al. Citation2005; Du et al. Citation2019), two groups of rats were injected intraperitoneally with D-galactose at 250 mg/kg/day (denoted as D-galactose_ 250 mg/kg/day) and 500 mg/kg/day (denoted as D-galactose_ 500 mg/kg/day) for 30 days; rats in the control group were injected with an equal volume of 0.9% saline in the same way. D-galactose can produce excessive aldehydes and hydrogen peroxide, and then release ROS to produce oxidative stress; injecting rats with D-galactose is an accepted and simple way to induce global oxidative stress in vivo (Wei et al. Citation2005). The final injected doses were based on the most recently measured body weights. All rats were injected at a frequency of five consecutive days and rested two days per week.
Plasma and serum collection and storage
Blood was collected from all rats with severed tails in the mornings of 0, 15, and 30 days. We used sterile cotton balls to treat the bleeding tail, and sterile gauze to dress the wound tail. We chose severing the tails because we needed sufficient blood for measuring oxidative stress biomarkers. The traditional way of blood collection through the tail vein is not useful in this regard. This was approved by the IRB in our institution. We intraperitoneally injected urethane to induce anesthesia prior to the blood collection. Anesthesia and cervical dislocation were used to execute the rats after the final blood collection. We placed the collected blood into heparin anticoagulant and no-anticoagulant tubes and centrifuged them at 3000 rpm for 10 min at 4°C. After centrifugation, plasma and serum samples were divided into aliquots. The specimens were stored in a refrigerator at 4°C until assay. The duration between blood collection and assay was < 4 h.
Assay of FlOPs, MDA, 8-OHdG, PTD, NT, and c-reactive protein (CRP)
We measured FlOPs using the same method as above. Serum MDA, 8-OHdG, PTD, NT, and CRP levels were measured using commercial Elisa kits (item no. MM-0385R1, MM-0224R1, MM-0269R1, MM-0811R1, MM-0081R1, Meimian, Jiangsu Meimian Industrial Co., Ltd, Jiangsu, China). All measurements were performed strictly in accordance with the manufacturer’s instructions. The inter-assay CV for MDA, 8-OHdG, PTD, NT, and CRP measurements were 12%; their intra-assay CV were 10%.
Statistical analysis
Human study
All statistical analyses were performed using the SPSS software (version 24.0; SPSS, Chicago, IL, USA). We descriptively analyzed the characteristics for healthy volunteers and coronary heart disease patients. We used the One-Way Repeated Measures ANOVA test to compare the inter- and intra-assay CV of FlOP measurements among the eight plasma/extractant mixture ratios. When significant differences were identified between ratios, two-by-two comparisons were tested using the Paired-Samples T Test. Similar methods were used to test whether hemolysis, transportation, storage, and rounds of freeze-thaw procedures influenced the FlOP assay. A two-sided P <0.05 was considered statistically significant.
Animal study
We used independent analysis of variance and t-test to assess the levels of all oxidative stress markers (FlOPs, MDA, 8-OHdG, PTD, and NT) at the same time (0, 15, and 30 days) between groups (control group, D-galactose250 mg/kg/day, and D-galactose 500 mg/kg/day). We used the repeated measures ANOVA and paired t-test to assess the levels of all oxidative stress markers (FlOPs, MDA, 8-OHdG, PTD, and NT) at the same D-galactose intervention dose at different times. Repeated measures ANOVA was also used to assess the effect of group, time, and the interaction effect of group and time on the levels of oxidative stress markers. Linear and non-linear trends of FlOPs and traditional oxidative stress biomarkers over time were tested in the regression models, in which the dependent variable was FlOPs and the independent variables were time and time × time. We also analyzed the Pearson correlation of FlOPs with the dose of D-galactose on days 15 and 30. These analyses were used to determine the sensitivity of FlOPs for measuring D-galactose-induced oxidative stress. In addition, we tested the Pearson correlation between CRP and FlOPs to determine whether FlOPs reflect inflammation. We adjusted for the ID and time of the rats in the analysis. Fourth, we analyzed the Pearson correlation between FlOPs and traditional oxidative stress markers (MDA, 8-OHdG, PTD, and NT).
Results
Human study
The Supplemental Table 1 shows the characteristics for healthy volunteers and coronary heart disease patients. The ages of the two groups of healthy volunteers ranged from 45 to 60 years (reliability test) and from 19 to 23 years (laboratory factor test). The ages of the eight participants with CHD ranged from 46 to 70 years.
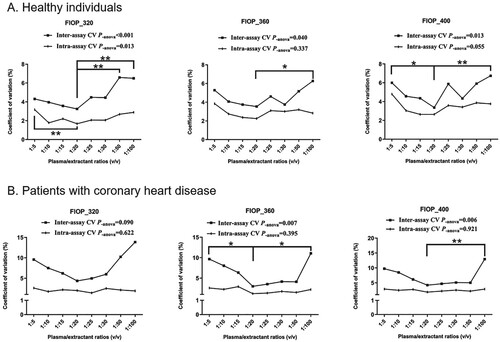
The average inter- and intra-assay CV for the FlOP measurements of eight healthy volunteers under eight plasma/extractant ratios (v/v) are shown in Figure . The inter-assay CV for FlOP measurements were higher and varied more than the intra-assay CV for different excitation/emission wavelengths (Figure A). The inter- and intra-assay CV for FlOPs decreased with plasma/extractant ratios before 1:20 (v/v) and increased after 1:20 (v/v) in healthy individuals. At a 1:20 mixture ratio, the CV of FlOPs were the lowest. The average inter-assay CV for FlOP_320, FlOP_360, and FlOP_400 were 3.25%, 3.54%, and 3.36%, respectively. The average intra-assay CV of FlOP_320, FlOP_360, and FlOP_400 was 1.68%, 2.25%, and 2.64%, respectively. Similar results were obtained when plasma samples from participants with CHD were tested (Figure B). At a 1:20 mixture ratio, the mean inter-/intra-assay CV for FlOP_320, FlOP_360, and FlOP_400 were 4.35%/1.99%, 2.99%/0.95%, and 4.20%/1.86%, respectively.
Figure 1. FlOP measurement CV at eight plasma/extraction ratios. Abbreviations: FlOPs = fluorescent oxidation products, CV = coefficient of variation. Dots represent the means of eight subjects at each plasma/extractant ratio. *Indicates statistical significance at alpha = 0.05. ** Indicates statistically significant at alpha = 0.01.
Among both healthy and CHD participants, FlOP levels significantly increased with slight or severe hemolysis. Overall, these changes did not differ by sex (all P interactions by sex > 0.05), although FlOP_400 showed significant differences between sexes under severe hemolysis in CHD patients (Supplemental Figure 1).
While the blood samples were placed on ice, FlOP_320, FlOP_360, and FlOP_400 were stable for the initial 24, 72, and 36 h for healthy individuals and 72, 12, and 12 h for CHD patients, respectively (Supplemental Figure 2). Males and females showed identical results (all P interactions by sex > 0.05).
FlOPs measured using both healthy and CHD participants’ blood samples stored at −80°C displayed no significant changes for 360 and 90 days, respectively (Supplemental Figure 3). Although we found significant differences in the FlOPs between the sexes at a few time points, there was no significant difference between the sexes overall (P interaction by sex > 0.05).
FlOP measurements remained stable for a maximum of 10 and 5 rounds of freeze-thaw procedures for healthy and CHD participants, respectively (Supplemental Figure 4). Again, no significant differences were observed between males and females (all P interaction by sex > 0.05).
Animal study
The differences in body weight between the groups on days 0, 15, and 30 were not statistically significant (Supplemental Figure 5). The levels of FlOPs, MDA, 8-OHdG, PTD, and NT for measuring D-galactose-induced oxidative stress at 0, 15, and 30 days are shown in Figure . FlOP_320 and FlOP_360 levels showed significant differences between the groups at 30 days; a similar pattern of results was observed at 15 days. The differences in MDA, 8-OHdG, PTD, NT, and FlOP_400 levels between groups were not statistically significant on days 15 and 30. On day 30, FlOP_320 and FlOP_360 appeared to be more sensitive than traditional markers for measuring oxidative damage. During the 30 days of the animal experiment, the Pearson correlations (r) of FlOP_320 and FlOP_360 with D-galactose dose were 0.816 and 0.801, respectively, which were 3–12 times higher than those of malondialdehyde (r = 0.183), 8-hydroxyguanosine (r = 0.157), pentosidine (r = 0.254), and nitrotyrosine (r = 0.068) for measuring D-galactose-induced oxidative damage (Table ). Again, a higher sensitivity of FlOP_320 and FlOP_360 than traditional oxidative stress biomarkers was noted for 15 days.
Figure 2. Levels of FlOPs and traditional oxidative stress markers during 30 days. Abbreviations: FlOPs, fluorescent oxidation products; MDA, = malondialdehyde, 8-OHdG = 8-hydroxyguanosine; PTD, pentosidine; NT, nitrotyrosine. Error bars represent means ± standard deviations. *Indicates statistical significance at alpha = 0.05. ** Indicates statistically significant at alpha = 0.01. *** Indicates statistically significant at alpha = 0.001.
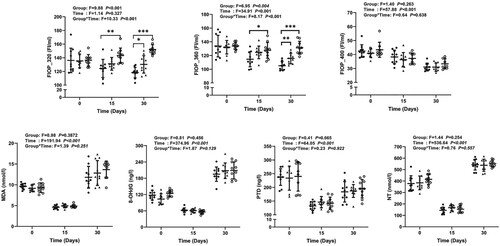
Table 1. The Pearson correlation between oxidative stress biomarkers and D-galactose dose.
Overall, we found that the levels of MDA, 8-OHdG, PTD and NT showed a ‘U’ shape trend with time, in which there was a decreased trend between 0 and 15 days, and an increased trend from 15 days onwards (all P_nonlinear < 0.05); their trends were comparable between D-galactose intervention groups (Figure 2 and Supplemental Table 2). Overall, the levels of FlOP_360 and FlOP_400 in the rats decreased over time. The trends between FlOP_400 and time were identical between the D-galactose intervention groups. After stratifying by intervention group, the negative relationship between FlOP_360 and time was only significant for the control and D-galactose_ 250 mg/kg/day groups, but not for the D-galactose_ 500 mg/kg/day group. FlOP_320 levels increased over time in the D-galactose_ 500 mg/kg/day group and decreased with time in the control group, but did not significantly change with time in the D-galactose_ 250 mg/kg/day group.
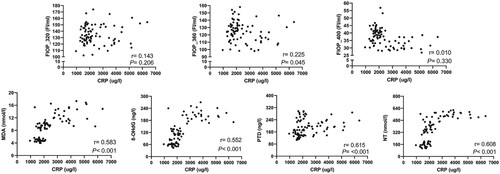
The Pearson correlations of FlOPs, MDA, 8-OHdG, PTD, and NT with CRP are shown in Figure . After adjusting for the rats’ ID and time, there was no significant correlation of FlOP_320 and FlOP_400 with CRP. However, FlOP_360, MDA, 8-OHdG, PTD, and NT were positively correlated with CRP levels (all P < 0.05; Figure ).
Figure 3. The Pearson correlation of FlOPs, MDA, 8-OHdG, PTD and NT with CRP Abbreviations: FlOPs, fluorescent oxidation products; MDA, = malondialdehyde, 8-OHdG = 8-hydroxyguanosine; PTD, pentosidine; NT, nitrotyrosine. R and P were adjusted for rats’ ID and experiment time.
The Pearson correlation between FlOPs and traditional markers of oxidative stress is shown in Supplemental Table 3. Overall, FlOPs were not positively associated with MDA, 8-OHdG, PTD and NT (all P > 0.05).
Discussion
In this study, we were able to substantially improve the reliability of FlOP measurement by optimizing the plasma/extraction ratio and using a fluorescent microplate reader. At a 1:20 (plasma/extractant) mixture ratio, the overall inter-/intra-assay CV for FlOP measurements among healthy and CHD participants were <3.6%/<2.7% and <4.4%/<2.0%, respectively. FlOP_320 and FlOP_360 were 3–12 times more sensitive than traditional oxidative stress biomarkers (MDA, 8-OHdG, PTD, and NT) for measuring D-galactose-induced oxidative damage. FlOP_320 and FlOP_400 did not reflect inflammation as quantified by CRP. A short-term transportation of blood samples on ice, up to one-year storage of plasma samples at −80°C, and ≤5 rounds of plasma freeze-thaw procedures did not substantially influence the FlOP measurements. These findings will be useful for extending the use of FlOPs in future epidemiological studies and clinical settings.
This research found a much lower CV for FlOP measurement than that reported in a previous study (<13%) (Yang et al. Citation2014). Consistent with our initial hypothesis, these improvements were mainly due to the use of a fluorescence microplate reader. The optimal plasma/extractant ratio also contributed to the improved reliability of the FlOP assay. Furthermore, the FlOP measurement CVs were lower than the measurement CVs for traditional oxidative stress biomarkers; the inter-assay/intra-assay CV for MDA, 8-OHdG, PTD and NT measurements were 12%/10% in our study. In other studies, the CV of MDA, 8-OHdG, S-glutathionylation, myeloperoxidase, oxidized LDL and F2-isoprostane were 15.8%–16.6%, 10.7-15.9%, 5.5-14.5%, 1-6%, 13.9% and 10.2%, respectively (Wu et al. Citation2004; Bukowski et al. Citation2015; Alajbeg et al. Citation2017; Chu and Stokol Citation2021; Khongwichit et al. Citation2023). Lastly, the CVs did not change linearly with the change in dilution ratios, which aligns with the findings from other studies (Vittorini et al. Citation2007; Trachsel et al. Citation2014) in which the immunoassay measurements of plasma atrial/A-type natriuretic peptide in horses and cardiac natriuretic hormones in humans did not have the lowest CV at low or high concentrations.
It has been noted that FlOPs are 10–100 times more sensitive than the commonly used colorimetric TBA assay of lipid peroxidation (Dillard and Tappel Citation1971). Our study showed that FlOP_320 and FlOP_360 were 3–12 times more sensitive than MDA, 8-OHdG, PTD, and NT. This is likely because previous research conducted experiments in rat liver mitochondria, microsomes, and heart sarcosomes, and our research was conducted in rat blood samples. In addition, α-tocopherol and d-galactose have been used to reduce and induce oxidative stress, respectively. In addition, the previous study only compared the sensitivity of the FlOP assay (excitation/emission wavelengths: 360/430 nm) with that of the colorimetric TBA assay of lipid peroxidation. Our study examined the sensitivity of FlOPs (excitation/emission wavelengths 320/420 nm, denoted FlOP_320, 360/420 nm [FlOP_360], and 400/475 nm [FlOP_400]), MDA, 8-OHdG, PTD, and NT for measuring D-galactose-induced oxidative stress. In our study, multiple wavelengths of FlOP measurements were used, and oxidation markers of DNA, sugars, and proteins, as well as markers of lipid peroxidation, were considered.
Oxidative stress is closely related to inflammatory processes, and oxidative processes usually coexist with inflammatory processes (Kong et al. Citation2014). CRP, a well-characterized and reliable biomarker of inflammation (Ridker et al. Citation2004), was not statistically associated with FlOP_320 and FlOP_400 in this study. Similar results were reported in other studies (Jensen et al. Citation2013; Kong et al. Citation2014; Lakkur et al. Citation2014; Hart et al. Citation2016). Although FlOP_360 was correlated with CRP, its correlation with CRP was lower than that of MDA, 8-OHdG, PTD, and NT.
There were varied relationships between FlOPs and oxidative stress biomarkers with time; the relationship of FlOP_320 and FlOP_360 with time was also inconsistent across intervention groups. Regardless of the significance level, the levels of FlOP_320, FlOP_360, and traditional oxidative stress biomarkers, including MDA, 8-OHdG, and NT, were higher on day 30 days than on 0 d. This is consistent with the fact that D-galactose can induce global oxidative stress and aging (Wei et al. Citation2005; Cabello-Verrugio et al. Citation2016). compared with 0 d, temporarily lower levels of MDA, 8-OHdG, PTD, and NT on day 15 were likely due to the dynamic responses of increased antioxidant defense (Cao and Prior Citation2000; Prior et al. Citation2007). Such dynamic responses can also explain the decreased levels of FlOPs over time in controlled rats. The aging rats in the control group during the experimental period can also induce oxidative stress, but such oxidative stress elevation can be well controlled by increased antioxidants (Cabello-Verrugio et al. Citation2016).
FlOPs were not associated with any traditional oxidative stress biomarkers. The underlying reasons for this remain unclear. However, FlOPs may reflect later formation of oxidative damage products (Ivica and Wilhelm Citation2014). Traditional markers of oxidative stress tend to occur earlier during oxidative damage. This may be the major reason for the high stability of FlOPs.
In this research, we only chose MDA, 8-OHdG, PTD, and NT for comparison. Although these markers systematically reflect oxidative damage to lipids, DNA, sugars and protein, respectively, a comparison research of FlOPs’ sensitivity and specificity with other oxidative stress biomarkers (i.e. F2-isoprostanes and oxidized low-density lipoprotein [OxLDL]) may be warranted. Nevertheless, it should be noted that there is still heterogeneous literature about clinical significance of various oxidative stress biomarkers (Frijhoff et al. Citation2015).
It is not surprising that blood sample hemolysis influences FlOP measurements because there is leakage of hemoglobin and other intracellular components into plasma samples (Lippi et al. Citation2006). The measurement of other plasma biomarkers, such as plasma potassium, lactate dehydrogenase, and aspartate aminotransferase, does not allow for the use of hemolyzed blood samples (Rousseau et al. Citation2016).
Compared to the FlOP results in healthy individuals, the short-term stability of FlOP_360 when fresh blood samples were placed on ice was more likely to be affected by CHD conditions. The FlOP_360 under different numbers of blood sample freeze-thaw procedures was also influenced by CHD. The underlying reasons for these findings remain unclear. However, participants with CHD have higher levels of ROS, which have a short half-life (Marrocco et al. Citation2017). Higher ROS levels in participants with CHD may be more easily affected by factors such as blood sample storage and freeze–thaw procedures (Casper Citation1983; Madanská et al. Citation2004).
In our study, the FlOPs remained stable between 8 and 36 h when blood samples were placed on ice. This figure is generally comparable to the stability results of MDA and F2-isoprostane (which remained stable before 24 h) (Wu et al. Citation2004).
When the plasma samples were stored at −80°C, FlOPs remained stable for 360 days. In participants with CHD, plasma FlOPs remained stable for 90 days at −80°C. This has strengthened the use of FlOPs in large epidemiological studies.
Some strengths and limitations of this study should be acknowledged when interpreting our results. Using joint human and animal evidence, we systematically examined the reliability, sensitivity, and specificity of FlOPs in measuring global oxidative stress. We also determined the laboratory factors associated with the FlOP measurement. Our study is limited by the small sample size of the human study. This may have reduced the reliability of our reliability and laboratory factor results. In CHD participants, we only examined the long-term stability of FlOPs at −80°C for 90 days. Whether FlOPs are stable after 90 d remains unclear. However, based on the available 90 days results, FlOPs had comparable stability between healthy individuals and those with CHD. The animal study was conducted for only 30 d. Whether the same results can be obtained over a longer period requires future research.
This study has several clinical implications at both the individual and population levels. At the individual level, reliable, sensitive, and specific FlOP measurement is useful for assessing endogenous oxidative stress levels. Once a high oxidative stress level is reliably defined, effective antioxidants (i.e. vitamin C, carotene, and lutein) can be prescribed to decrease oxidative stress levels and reduce the risk of oxidative stress-related conditions. FlOPs are also suitable to determine oxidative stress at the population level, because they are stable for up to 36 h of blood sample transportation, for at least 90 days at-80°C freezers, and within five blood sample freeze–thaw procedures. Studies have shown the value of FlOPs in assessing risk of cardiovascular disease, worsening of asthma control and poorer bone health (Wu et al. Citation2007; Akiki et al. Citation2019; Shen et al. Citation2022).
Currently, there is no commercial kit for measuring FlOPs. In our lab, we can measure 12 samples per plate. We need 50-60μl plasma samples for each FlOP measurement. The costs for all laboratory materials for FlOP measurement at laboratory setting are estimated at 10 US dollars per sample. FlOP measurement costs are comparable with traditional oxidative stress biomarkers (i.e. MDA and 8-OHdG) measured by Elisa. However, FlOP measurement requires more plasma samples and plates than Elisa-based oxidative stress biomarker measurements (20 μl plasma sample per measurement; 42 samples per plate).
Conclusions
FlOP_320 is a reliable, sensitive, and specific marker for measuring global oxidative stress in vivo. The laboratory factors that influenced FlOP measurements included blood sample hemolysis, over 8-hour transportation of blood samples on ice, ≥180 days of storage at −20 °C, and ≥5 rounds of plasma freeze–thaw procedures. Further prospective studies are warranted to confirm whether FlOP_320 can be used to assess the risk of oxidative stress-related chronic conditions.
Abbreviations
8-OHdG = 8-hydroxyguanosine, CHD = coronary heart disease; CRP, C-reactive protein; CV, coefficient of variation; ELISA, enzyme-linked immunosorbent assay; FlOPs, fluorescent oxidation products; MDA, malondialdehyde; NT, nitrotyrosine; PTD, pentosidine; ROS, reactive oxygen species.SD = standard deviation, TBA = thiobarbituric acid.
Supplemental Materials-2024-7.docx
Download MS Word (581.9 KB)Disclosure statement
No potential conflict of interest was reported by the author(s).
Author contributions statement
Conception, design, and analysis: Bing Liang and Shuman Yang.
Experiment and data collection: Bing Liang, Juan Zhang, Xue Shen and Xiaohua Zhang conducted the animal experiment; Bing Liang, Linghua Yang, Xinyan Shi, Xueru Ge, Huan He and Tong Liu and Shuman Yang collected the human data.
Interpretation of the data: Bing Liang, Juan Zhang, Xue Shen, Xiaohua Zhang, Ann M Vuong, Linghua Yang, Xinyan Shi, Xueru Ge, Huan He and Tong Liu and Shuman Yang.
The drafting the paper: Shuman Yang.
Revising it critically for intellectual content: Bing Liang, Juan Zhang, Xue Shen, Xiaohua Zhang, Ann M Vuong, Linghua Yang, Xinyan Shi, Xueru Ge, Huan He and Tong Liu and Shuman Yang.
The final approval of the version to be published: Bing Liang, Juan Zhang, Xue Shen, Xiaohua Zhang, Ann M Vuong, Linghua Yang, Xinyan Shi, Xueru Ge, Huan He and Tong Liu and Shuman Yang.
Agree to be accountable for all aspects of the work: Bing Liang, Juan Zhang, Xue Shen, Xiaohua Zhang, Ann M Vuong, Linghua Yang, Xinyan Shi, Xueru Ge, Huan He and Tong Liu and Shuman Yang.
Ethic statement
The Institutional Review Board of the School of Public Health, Jilin University approved this research (Project # 2021-12-06).
Data availability statement
Research data are available at https://doi.org/10.6084/m9.figshare.24783036
.Additional information
Funding
References
- Akiki Z, Andrianjafimasy M, Zerimech F, Le Moual N, Siroux V, Dumas O, et al. 2019 Sep 6. High level of fluorescent oxidation products and worsening of asthma control over time. Respir Res. 20(1):203. doi:10.1186/s12931-019-1173-0.
- Alajbeg IZ, Lapic I, Rogic D, Vuletic L, Andabak Rogulj A, Illes D, et al. 2017. Within-subject reliability and between-subject variability of oxidative stress markers in Saliva of healthy subjects: A Longitudinal pilot study. Dis Markers. 2017:2697464. doi:10.1155/2017/2697464.
- Andrianjafimasy M, Zerimech F, Akiki Z, Huyvaert H, Le Moual N, Siroux V, et al. 2017 Dec. Oxidative stress biomarkers and asthma characteristics in adults of the EGEA study. Eur Respir J. 50(6):1701193. doi:10.1183/13993003.01193-2017.
- Arifin WN, Aahiruddin WN. 2017. Sample size calculation in animal studies using resource equation approach. Malays J Med Sci. 24(5):101–105. doi:10.21315/mjms2017.24.5.11.
- Bukowski MR, Bucklin C, Picklo MJ. 2015 Jan 15. Quantitation of protein S-glutathionylation by liquid chromatography-tandem mass spectrometry: correction for contaminating glutathione and glutathione disulfide. Anal Biochem. 469:54–64. doi:10.1016/j.ab.2014.10.002.
- Cabello-Verrugio C, Simon F, Trollet C, Santibaez JF. 2016. Oxidative stress in disease and aging: mechanisms and therapies 2016. Oxid Med Cell Longev. 2017(2016):4310469. doi:10.1155/2017/4310469.
- Cao G, Prior RL. 2000. Postprandial increases in serum antioxidant capacity in older women. J Appl Physiol. 89(3):877–883.
- Casper I. 1983 Jul. [Stability of 10 percent hydrogen peroxide solution]. Pharmazie. 38(7):493–494.
- Chu SAA, Stokol T. 2021 Mar. Assay variability and storage stability of the myeloperoxidase index of the ADVIA 2120i hematology analyzer in canine and equine whole blood samples. Vet Clin Path. 50(1):28–36. doi:10.1111/vcp.12981.
- Dillard CJ, Tappel AL. 1971. Fluorescent products of lipid peroxidation of mitochondria and microsomes. Lipids. 6(10):715–721. doi:10.1007/bf02531296.
- Du HM, Wang YJ, Liu X, Wang SL, Wu SM, Yuan Z, et al. 2019 Jun. Defective central immune tolerance induced by high-dose D-galactose resembles aging. Biochemistry-Moscow. 84(6):617–626. doi:10.1134/s000629791906004x.
- Fortner RT, Tworoger SS, Wu T, Eliassen AH. 2013 Sep. Plasma florescent oxidation products and breast cancer risk: repeated measures in the Nurses’ Health Study. Breast Cancer Res Treat. 141(2):307–316. doi:10.1007/s10549-013-2673-0.
- Frankel EN. 1980. Lipid oxidation. Prog Lipid Res. 19(1-2):1–22. doi:10.1016/0163-7827(80)90006-5.
- Frijhoff J, Winyard PG, Zarkovic N, Davies SS, Stocker R, Cheng D, et al. 2015 Nov 10. Clinical relevance of biomarkers of oxidative stress. Antioxid Redox Sign. 23(14):1144–1170. doi:10.1089/ars.2015.6317.
- Gidske G, Sølvik U, Sandberg S, Kristensen GBB. 2018 Aug 28. Hemolysis interference studies: freeze method should be used in the preparation of hemolyzed samples. Clin Chem Lab Med. 56(9):e220–e2e2. doi:10.1515/cclm-2018-0193.
- Hart JE, Morse L, Tun CG, Brown R, Garshick E. 2016. Cross-sectional associations of pulmonary function with systemic inflammation and oxidative stress in individuals with chronic spinal cord injury. J Spinal Cord Med. 39(3):344–352. doi:10.1179/2045772315Y.0000000045.
- Ivica J, Wilhelm J. 2014. Lipophilic fluorescent products of free radicals. Biomed Pap Med Faculty Univ Palacký, Olomouc, Czechoslovakia. 158(3):365–372. doi:10.5507/bp.2012.112.
- Jensen MK, Wang Y, Rimm EB, Townsend MK, Willett W, Wu T. 2013 Oct 8. Fluorescent oxidation products and risk of coronary heart disease: a prospective study in women. J Am Heart Assoc. 2(5):e000195. doi:10.1161/jaha.113.000195.
- Kageyama Y, Takahashi M, Nagafusa T, Torikai E, Nagano A. 2007. Methotrexate reduces the levels of pentosidine and 8-hydroxy-deoxy guanosine in patients with rheumatoid arthritis. Mod Rheumatol. 17(5):398–402. doi:10.1007/s10165-007-0607-6.
- Kedar P, Desai A, Warang P, Colah R. 2017 May. A microplate reader-based method to quantify NADH-cytochrome b5 reductase activity for diagnosis of recessive congenital methaemoglobinemia. Hematology. 22(4):252–257. doi:10.1080/10245332.2016.1252873.
- Khongwichit S, Swangphon P, Nanakorn N, Nualla-ong A, Choowongkomon K, Lieberzeit PA, et al. 2023 Mar 1. A simple aptamer/gold nanoparticle aggregation-based colorimetric assay for oxidized low-density lipoprotein determination. Talanta. 254. doi:10.1016/j.talanta.2022.124199.
- Khoubnasabjafari M, Ansarin K, Jouyban A. 2016. Reliability of malondialdehyde measurements as a marker of oxidative stress in pediatrics. Pediatr Neonatol. 57(5):450. doi:10.1016/j.pedneo.2015.10.015.
- Kong SYJ, Bostick RM, Flanders WD, McClellan WM, Thyagarajan B, Gross MD, et al. 2014. Oxidative balance score, colorectal adenoma, and markers of oxidative stress and inflammation. Cancer Epidemiol Biomarkers Prev. 23(3):545–554. doi:10.1158/1055-9965.EPI-13-0619.
- Lakkur S, Bostick RM, Roblin D, Ndirangu M, Okosun I, Annor F, et al. 2014. Oxidative balance score and oxidative stress biomarkers in a study of Whites, African Americans, and African immigrants. Biomarkers. 19(6):471–480. doi:10.3109/1354750X.2014.937361.
- Lan J, Feng B, Wu X, Yang L, Liu J, Shi G, et al. 2020 Feb. Aptamer-modified silver nanoclusters for fluorescence detection of intracellular 8-hydroxydeoxyguanosine. Acs Appl Nano Mater. 3(2):1332–1338. doi:10.1021/acsanm.9b02179.
- Liguori I, Russo G, Curcio F, Bulli G, Aran L, Della-Morte D, et al. 2018. Oxidative stress, aging, and diseases. Clin Interv Aging. 13:757–772. doi:10.2147/CIA.S158513.
- Lippi G, Salvagno GL, Montagnana M, Brocco G, Guidi GC. 2006. Influence of hemolysis on routine clinical chemistry testing. Clin Chem Lab Med. 44(3):311–316. doi:10.1515/cclm.2006.054.
- Madanská J, Vitková Z, Capková Z. 2004 Sep. [Examination of the stability of hydrogen peroxide solutions]. Ceska Slov Farm. 53(5):261–263.
- Marrocco I, Altieri F, Peluso I. 2017. Measurement and clinical significance of biomarkers of oxidative stress in humans. Oxid Med Cell Longev. 2017:6501046. doi:10.1155/2017/6501046.
- Murad H, Tayeb H, Mosli M, Rafeeq M, Basheikh M. 2021. Blood levels of glutamine and nitrotyrosine in patients with chronic viral hepatitis. Int J Gen Med. 14:8753–8762. doi:10.2147/ijgm.S337909.
- Prior RL, Gu L, Wu X, Jacob RA, Sotoudeh G. 2007. Plasma antioxidant capacity changes following a meal as a measure of the ability of a food to alter in vivo antioxidant status. J Am Coll Nutr. 26(2):170–181.
- Ridker PM, Brown NJ, Vaughan DE, Harrison DG, Mehta JL. 2004. Established and emerging plasma biomarkers in the prediction of first atherothrombotic events. Circulation (New York. NY). 109(25):V-6-V-19. doi:10.1161/01.CIR.0000133444.17867.56.
- Rousseau N, Pige R, Cohen R, Pecquet M. 2016 Jun 1. What is the acceptable hemolysis index for the measurements of plasma potassium, LDH and AST? Ann Biol Clin (Paris). 74(3):323–328. doi:10.1684/abc.2016.1134.
- Shen X, Peng CG, Zhao Y, Zhong LL, Cai HQ, Kan B, et al. 2022 Apr-Jun. Plasma Fluorescent Oxidation Products and Bone Mineral Density Among Male Veterans: A Cross-Sectional Study. J Clin Densitom. 25(2):141–149. doi:10.1016/j.jocd.2021.09.003.
- Trachsel DS, Schwarzwald CC, Grenacher B, Weishaupt MA. 2014 Feb. Analytic validation and comparison of three commercial immunoassays for measurement of plasma atrial/A-type natriuretic peptide concentration in horses. Res Vet Sci. 96(1):180–186. doi:10.1016/j.rvsc.2013.10.011.
- Tsikas D. 2017 May 1. Assessment of lipid peroxidation by measuring malondialdehyde (MDA) and relatives in biological samples: Analytical and biological challenges. Anal Biochem. 524:13–30. doi:10.1016/j.ab.2016.10.021.
- Vittorini S, Prontera C, Zucchelli GC, Clerico A. 2007. Cardiac natriuretic hormones: methodological aspects. Immuno-Analyse & Biologie Spécialisée. 22(4):236–246. doi:10.1016/j.immbio.2007.06.003.
- Wei H, Li L, Song Q, Ai H, Chu J, Li W. 2005. Behavioural study of the d-galactose induced aging model in C57BL/6J mice. Behav Brain Res. 157(2):245–251. doi:10.1016/j.bbr.2004.07.003.
- Wu T, Rifai N, Roberts LJ, Willett WC, Rimm EB. 2004 Aug. Stability of measurements of biomarkers of oxidative stress in blood over 36 hours. Cancer Epidemiol Biomarkers Prev. 13(8):1399–1402.
- Wu T, Rifai N, Willett WC, Rimm EB. 2007 Sep 1. Plasma fluorescent oxidation products: independent predictors of coronary heart disease in men. Am J Epidemiol. 166(5):544–551. doi:10.1093/aje/kwm120.
- Yang S, Feskanich D, Willett WC, Eliassen AH, Wu T. 2014 Dec. Association between global biomarkers of oxidative stress and hip fracture in postmenopausal women: a prospective study. J Bone Miner Res. 29(12):2577–2583. doi:10.1002/jbmr.2302.
- Yang S, Giovannucci E, Bracken B, Ho SM, Wu T. 2015 Aug 14. Association between plasma fluorescent oxidation products and erectile dysfunction: a prospective study. BMC Urol. 15:85. doi:10.1186/s12894-015-0083-9.
- Zhou XL, Gao S, Yue MJ, Zhu SY, Liu Q, Zhao XE. 2023 Mar. Recent advances in analytical methods of oxidative stress biomarkers induced by environmental pollutant exposure. Trac-Trend Anal Chem. 160. doi:10.1016/J.Trac.2023.116978.