 ?Mathematical formulae have been encoded as MathML and are displayed in this HTML version using MathJax in order to improve their display. Uncheck the box to turn MathJax off. This feature requires Javascript. Click on a formula to zoom.
Abstract
Historically, the introductory course in statistics at the Norwegian University of Life Sciences (NMBU), has taken a traditional, lecture-based form. A previous study at the NMBU concluded that the course structure appeared to disfavor certain cognitive or personality types, extraverts in particular. Therefore, in 2016, as an experiment, the course was restructured into a student active learning course following a flipped classroom approach. At the same time, students were encouraged to do an online screening test for cognitive preferences, personality, work interest, and preferred learning style. The main outcome in the present study was exam scores. Despite the new course structure, we still found significant differences in exam scores between students with a contextual preference, compared with a digital preference, and those with a feeling-based rather than a thinking-based personality characteristic. However, in contrast to the previous study, no significant difference in exam scores was found between the extraverts and the introverts, also after adjusting for other covariates. In the present article, we outline these results and other findings that indicate that additional adaptations should be made in the course, in order to reach an even wider group of the heterogeneous student mass, helping individuals to better reach their learning potential.
1 Introduction
There is a consensus on the mindset that we acquire knowledge differently, and the concept of personalized learning has experienced a resurgence (FitzGerald et al. Citation2018; Dockterman Citation2018). However, the pedagogical question still remains unanswered: How should we facilitate courses so that students with different preferences, background, and abilities get the most out of their potential? This has been of pedagogical interest for decades. The American educational psychologist and statistician Cronbach (Citation1957) commented in the following way:
We are not on the right track when we conceive of adjustment or adjustive capacity in the abstract. It is always a capacity to respond to a particular treatment. The organism which adapts well under one condition would not survive under another. If for each environment there is a best organism, for every organism there is a best environment. The job of applied psychology is to improve decisions about people. The greatest social benefit will come from applied psychology if we can find for each individual the treatment to which he can most easily adapt. This calls for the joint application of experimental and correlational methods. (Cronbach Citation1957, p. 679)
Higher education has experienced a significant increase in student numbers; this phenomenon is often referred to as massification (Scott Citation1995). At the same time, a central focus area for universities has been to recruit students with a greater cognitive diversity into the various individual subjects. This is a desirable strategy, in order to achieve a broader epistemological platform and greater diversity within the various academic approaches. Such a strategy is necessary to satisfy requirements for more comprehensive and interdisciplinary solutions to complex issues (Buckridge and Guest Citation2007; Biggs Citation2011; Miller Citation2015). In line with this, teaching infrastructure and learning material in higher education have to emphasize a greater degree of personalized learning to democratize or optimize the coping skills among this greater heterogeneity of cognitive profiles in the student population. The theory of psychological types has proven to help better to understand core students’ needs and select teaching strategies that reach more students effectively both generally in teaching (Fairhurst and Fairhurst Citation1995) and in subjects with high theoretical context (McCaully, et al. Citation1983; Rosati Citation1997; Felder Citation2002; Brovold Citation2014). Also, in the field of statistics, educators must develop a learning environment and offer teaching that allows the different student profiles and cognitive styles to thrive.
The hard reality of an introductory course in statistics is that a very heterogeneous group of students, in terms of both professional interests and learning preferences, should be socialized into the culture of statistical thinking and reasoning at an early stage in their studies (Conners, Maccown, and Roskos-Ewoldsen Citation1998; Tishkovskaya and Lancast Citation2012; Charalambous, Hodge, and Ippolito Citation2020). The students must learn to reflect critically, translate real-world problems into numbers, choose the appropriate analyzes, and finally, translate the results into new insights about the real world from which the numbers originated. In other words, they must learn basic scientific, quantitative research method, and in such detail that they could use it in their own bachelor’s or master’s thesis.
Historically, the introductory course in statistics (STAT100) at the Norwegian University of Life Sciences (NMBU) has been a lecture-based course. However, as found in a previous study (Saebø, Almøy, and Brovold Citation2015), the course structure and teaching method appeared to disfavor certain cognitive types among the students. Saebø et al. (Citation2015) collected data from 288 STAT100 students, including their personality type (16 categories), their work habits and preferences, and examination grades from nine undergraduate subjects, both mathematical and some non-mathematical. Statistical analyses revealed a clear connection between grades and certain personality characteristics. They concluded that teaching structure in universities with lectures in large auditoriums with limited dialogue and a rigid and structured curriculum clearly disfavors some students who can be characterized as extraverted and contextual/relational, and to some extent also those who are intuitive and feeling. Consequently, other teaching methods, aiming at an extended student activity might improve the learning outcome for these types of students.
Several studies have pointed out the benefit of a flipped classroom (Tucker Citation2012) and cooperative learning in various disciplines in both academic performance and learning outcomes (Schultz et al. Citation2014; Foldnes Citation2016) leading to a higher percentage of students completing a course (Keeler 1995) and improving the students’ comprehension of course content (McLaughlin and Kang Citation2017). Also, in the field of statistics, positive effects of a flipped classroom approach have been found in several studies (Loux et al. Citation2016; Peterson Citation2016; McLaughlin and Kang Citation2017). As pointed out in Jensen, Kummer, and Godoy (Citation2015), one of the main keys to learning in the flipped classroom setting is not the flipped model in itself, but the inclusion of active learning and the availability of the instructor present for the application stage of learning in the exact moment students are open for this.
With Cronbach’s words in mind, we started to redesign the introductory course in statistics. In the fall of 2016, the STAT100-course was restructured into a more open and polyform student active learning course, mainly using elements from the flipped classroom concept. The students watched lecture videos at home before meeting in class to work together in colloquium groups with cooperative learning activities for two hours, twice a week with the instructor (course responsible) and several student assistants present to guide the learning process. To enhance metacognition, all students were encouraged to complete a short questionnaire about their cognitive preferences.
The aim of this study was to investigate how the new course structure affects the students’ final exam performances, more specifically, if students with different cognitive profiles obtained different final exam grades. Exam performance is likely also to depend on the mathematical background and knowledge level from high school. Hence, in order to better understand the effect of the cognitive traits on exam performance, high-school background and grades were included in the analyses. Finally, we explored course attendance in light of cognitive traits, since it was expected that course structure and teaching approach might affect the attendance differently for the various cognitive types.
Based on the previous study (Saebø, Almøy, and Brovold Citation2015), it was expected that the change from a traditional lecture style to a more dialogue-based and cooperative learning approach might be beneficial to students with high scores on the personality traits extraversion and agreeableness feeling and value-based cognitive preference, and low scores on conscientiousness (hence, high contextual cognitive preferences) (McCrae and Costa Citation2003).
2 Method
2.1 The Course and the Participants
The introductory course in statistics, STAT100, is a compulsory course for many of the 5500 students at The Norwegian University of Life Sciences. The university provides 70 study programs; only one of these programs educates statisticians at a graduate level. Annually, about 500 students—250 in each of the spring and fall semesters—complete the course.
In 2016, the course was restructured into a student active learning course following a flipped classroom approach. This meant that the previous semester’s lectures were recorded, edited, and made available as 150 short videos on YouTube (Saebø Citation2020). The students were expected to watch the lecture videos before they came to campus to work in colloquium groups, under supervision of teachers. A total of 20 mandatory colloquium meetings were scheduled throughout the semester. Three sets of exercises were given in each week: Mandatory colloquium exercises made for discussion in the groups with two weekly submissions; optional, traditional exercises made for individual practice; and online multiple-choice exercises in the form of mandatory and weekly quizzes, each with 10 questions.
In the fall semester of 2016, a total of 216 students completed the course. For each student, we obtained information about their mathematical background from high school, the results from an online cognitive profile test, attendance in colloquium group meetings, the performance on the weekly quizzes, and exam scores in STAT100.
2.2 The Cognitive Assessment
To assess the cognitive diversity of the student population, we have chosen to use a short version of the STEM-Education Profiler (Brovold 2020)Footnote1 of the typical structured questionnaires or tests used in such contexts (like Big Five Personality Traits, Myers-Brigs Type Indicator/MBTI, NEO-P-R, NEO-Five Factor Inventory, etc.). The Big Five personality traits were originally a factor analytic model to comprehend the relationship between personality and academic behavior (Costa and McCrae Citation1992; Goldberg Citation1993; Poropat Citation2009). The MBTI is based on the conceptual theory proposed by Jung (Citation1921). It is constructed for normal populations and emphasizes the value of naturally occurring differences. The underlying assumption is that people or students have specific preferences in how they construe their experiences, and those preferences underlie their interests, needs, values, learning styles, attention, and motivation (Myers and Myers Citation1995; McCrae and Costa Citation2003). In our study, and in the STEM-Education Profiler developed by the National Center for Science Recruitment, we have excluded the factor Neuroticism in Big Five/NEO-P-R, since this introduces something that can be easily be understood as a qualitatively negative element in the mapping of people. In this context, we are primarily concerned with the students’ strengths. Hence, the four basic cognitive/personality factors of interest in the present study are the dichotomies which are outlined in , and labeled as Extraversion (E) versus Introversion (I), Intuition (N) versus Sensing (S), Feeling (F) versus Thinking (T), and Digital (D) versus Contextual (C). These cognitive characteristics were assessed by the web-based form (Brovold 2020), which all students were encouraged to complete in the beginning of the course in order to make them aware of their own preferences and strengths.
Table 1 Description of the cognitive traits from the STEM-Education Profiler (Brovold, Utdanningstesten).
2.3 Mathematical Background
The highest level of high school mathematics was registered with level codes 2P, R1 (second-year courses), S2 or R2 (third-year courses).
Mathematics 2P, which is the least comprehensive mathematic background possible for enrollment at a Norwegian university, is a theoretical course, but contains practical problems that can be solved with the help of mathematics. It consists of four focus areas: Numbers and Algebra in practice, Statistics, Functions in practice, and Modeling.
Mathematics S2 provides specialization in Mathematics for further studies and work in several central areas of society. In this course, the focus is on how mathematics is an aid both in economics and in areas of society such as health, environment, and globalization. The course consists of four focus areas: Algebra, Functions, Economics, and Statistics.
Both the 2P and S2 courses have more practical curriculum than the R1 and R2 courses, but in contrast to the R courses, S2 and 2P contain more statistical theory. The mathematics courses R1 and R2 provide specialization in mathematics for further studies and work in science, architecture, medicine, engineering, technology, industry, computer science, economics, and the education sector. Pupils can stop after R1 or advance to R2. R2 is the most advanced mathematics course in the STEM direction, and this is often a requirement for technical studies, such as engineering and other STEM-directed studies in Norway. The subjects consist of the following areas: Geometry (R1), Combinatorics (R1), Probability (R1), Algebra (R1 + R2), Functions (R1 + R2), and Differential Equations (R2).
As a proxy for the individual mathematical competence, the mean grade from all mathematical courses at high school was registered for each student. This gave a number between 2 (the lowest grade for obtaining a valid report card) and 6 (highest grade) and was based on 2 grades for those with 2P or R1, and 3 grades for those with S2 or R2.
2.4 Attendance
Absence was registered as a binary variable (0 present, 1
absent) for each student at each of the 20 colloquium groups throughout the course. The total attendance for each student was summarized in a variable Nonattend as the percentage of absence from the colloquium groups.
2.5 Performance on Weekly Quizzes
All students had to complete weekly multiple-choice quizzes, 10 questions each week for 11 weeks. To get the assignment approved, at least 50% of the questions had to be correct. The students had two attempts to succeed with each test. They got feedback on which questions they had answered wrongly, after the first attempt. A student who got five correct answers or more in the first attempt did not have to complete the second attempt. For each student, the performance on these assignments was summarized by the average percentage score for the last attempt on each of the 11 tests.
2.6 Exam Scores
The course exam consisted of three parts; Assignment 1, Assignment 2, and a set of multiple-choice questions. In Assignment 1, the students were asked to write a short report based on the output from a given context and a given statistical analysis. This open question was formulated to correspond to the weekly colloquium assignments, and the task measured the students’ ability to contemplate freely about a statistical analysis. It was graded on a point scale from 0 to 10, based on whether and how the students had formulated and included the statistical models, assumptions, parameters with interpretation, parameter estimates with uncertainty, and hypothesis tests that reflected the problem given. Considerable emphasis was also placed on whether they explained the results in light of the problem and whether they were able to draw correct conclusions. The questions in Assignment 2 were formulated to reflect the optional, traditional exercises. The multiple-choice part of the exam corresponded to the weekly, mandatory multiple-choice quizzes. The three parts of the exam accounted for 25%, 25%, and 50% of the total exam score, respectively. For the purpose of calibration, 20 randomly chosen exam papers were evaluated by both internal and external examiners. The remaining papers were only graded by the internal examiner, who was also the course responsible. Variables used in the following analysis include the scores from the three parts of the exam (ranging from 0 to 10 for each part). The grading system is A–F, where A is the top score, E is the lowest passing grade, and F is failing the course.
2.7 Statistical Methods
Descriptive statistics are given as mean and standard deviation (SD), or frequencies and percentages, according to the type of data. Regression modeling (Analysis of Variance (ANOVA) and linear regression models) with a logit transformation of the exam percentage scores as the response variable were used to analyze the associations between the exam performance, the student’s mathematical background, course attendance, and their cognitive characteristics. The logit of the exam scores transforms these numbers from a 0% to 100% scale to a –1.8 to 4.0 scale, to meet the assumptions in the models. The results were then back-transformed to exam percentage scores by the invlogit function in R (https://www.r-project.org/), to exemplify the results from the regression type models. A value equal or less than 0.05 was considered statistically significant.
The anonymized data with variable descriptions are available at https://doi.org/10.18710/EOGMVW.
3 Results
Of the 216 students completing the course, the cognitive assessment was available for 209 students, and high school Mathematics background was available for 188 participants, together leaving a study sample of n 183 students. An overview of the data is given in . Among the 183 participants, there was a fairly good balance between students with predominantly both extraverted and introverted personality characteristics (40% vs. 60%, respectively), and students with either digital or contextual cognitive preferences (55% vs. 45%, respectively). More students scored higher on the feeling than on the thinking preferences (63% vs. 37%, respectively), and few students scored higher on the intuition trait than on the sensing counterpart (16% vs. 84%, respectively). Almost half of the students’ mathematical background was at the most advanced high school level, R2. Few students (n
34) had top grades in Mathematics at high school, that is, grade “5” or “6”, and the mean grade reflected a mediocre level, as did the mean exam percentage score.
Table 2 Sample characteristics.
3.1 Mathematical Background
An ANOVA of the impact of mathematical background on the exam score was conducted. A logit transformation of the exam percentage score was used as the response variable, with mathematical background as a categorical explanatory variable. This can be written as(1)
(1) where yi is the logit of the exam scores and
are identically and independently distributed
error terms, which we assume for all other models further presented in this article.
A statistically significant difference between at least two math levels was found. These differences were identified by post-hoc Tukey test for pairwise comparisons as a statistically significant difference in exam performance between the students who have R2 and S2 background, but not between students with an R2 and R1 background (p-values 0.034 and 0.059, respectively). Students with the most advanced mathematics level from high school (R2) had a mean score of 69.9%, whereas those with S2 had a mean score of 56.0%, almost 14 points less. The R1 students had a mean score of 57.9%, whereas the 2P students, those with the least comprehensive mathematical background, obtained a mean score of 66.7%.
Individual mathematical competence measured by the mean high school math grade, has positive association to the exam performance in STAT100. This can be seen from where the logit-scores from the final exam in STAT100 are plotted against the mean grade from high school mathematic courses.
Fig. 1 The logit-scores from the introductory course in statistics plotted against the mean grade from high school and colored with respect to the highest math level taken together with their respective regression lines.
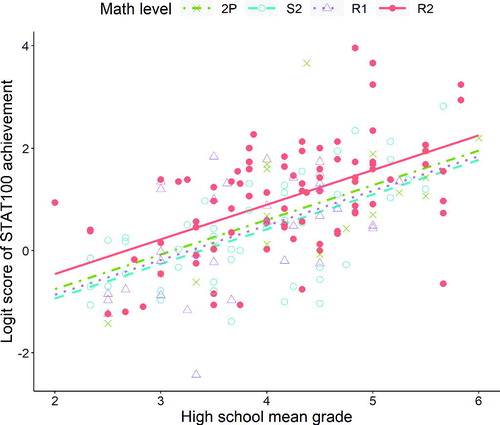
We observed a somewhat better performance (logit-score) in STAT100 for students with better mathematical averages from high school, but we also observe from that R2 students on average perform better than the students with the other mathematical courses, especially S2 students, regardless of grade from high school.
The ANOVA model was therefore expanded with the average math grade in high school with respect to the highest mathematic course taken, Model (2). The math grade variable was highly statistically significant (p-value <0.001) and increased the explained variability in the logit-score from an to
. An interaction term between math grade and math level was also included but found not to be statistically significant, and therefore left out from the further analysis. Model (2) can be written as:
(2)
(2)
As an example, we may use Model (2) to estimate the expected STAT100 exam score for various types of students. The highest achievers are the R2 students. The expected exam score in STAT100 of an R2 student with an average math grade of 5 (on a scale from 2 to 6) from high school will, according to a reverse transformation (invlogit) of the fitted model, be
An exam score of 83% corresponds to a grade B on the exam. On the other hand, if the student was an S2 student, also with a mean grade of 5 in math from high school, then the expected score on the STAT100 exam would bewhich corresponds to a grade C on the exam. Correspondingly, the expected scores if the students had grade 3 averages will be:
for the R2 student (a grade D), and
for the S2 student (a grade E).
3.2 Is There an Effect of Cognitive Types?
We have seen that the performance on the STAT100 exam is expected to depend on both the highest mathematical level completed in high school and the average grade achieved in these courses. However, there is still a lot of variability (more than 60%) in the STAT100 exam performance, that is not explained by these two factors. Cognitive traits may play an important role in explaining individual achievement on an exam. Personal characteristics may reflect how the teaching approach and course structure fits the learning preferences for the different cognitive types. Out of the 216 students, the 183 students taken into account in this study completed the voluntary cognitive assessment provided by the National Center for Science Recruitment described in the method section. In an extended regression model, the four dichotomous traits, Extraversion (E) versus Introversion (I), Intuition (N) versus Sensing (S), Feeling (F) versus Thinking (T), and Digital (D) versus Contextual (C), were included as four dummy variables, along with their internal interactions up to order three. This highly complex model with only statistically insignificant effects was then pruned down by F-test-based backward elimination with the test level 5% to obtain a final model with only statistically significant effects. The resulting Model (3) was(3)
(3) where XD and XT are the effect of the cognitive traits Digital (D) versus Contextual (C) and Thinking (T) versus Feeling (F). The effects of math level and math grade mean from high school remained highly statistically significant (p-value
0.018 and p-value <0.001, respectively), but in addition the two cognitive traits were statistically significant at the 5% level, the Digital (D) versus Contextual (C) (p-value
0.001) and Thinking (T) versus Feeling (F) (
value 0.002). The estimated regression parameters indicated that both the digital and thinking cognitive preferences had positive effects on the expected exam score in STAT100. The explained variability in the logit-score also increased to
with Model (3).
On the logit scale, the estimated effect () on exam score in STAT100 of being Thinking (T) versus Feeling (F) is 0.423 and for being Digital (D) versus Contextual (C) the estimated effect (
) on the exam score in STAT100 was 0.426. To interpret these effects in the percentage score, we can compare two students with Model (3), both with a mean math grade of 4 and R2 math from high school, one characterized as Thinking (T) and the other as Feeling (F) (other cognitive traits being equal). The estimated expected percentage score for the Feeling (F) student is
which corresponds to a low C, borderline D, grade on the exam. For the Thinking (T) student, the expected score on the STAT100 is
corresponding to an average C. Hence, with the same mathematical background and grade from high school, a student with a cognitive trait Thinking (T) would, based on our model, score almost 10 percentage points higher than their Feeling (F) counterparts.
3.3 Colloquium Group Attendance
In light of the above findings, we aimed at testing whether the level of absence from colloquium groups has any effect on the final score and whether this depends on any of the cognitive traits. It is interesting to see if the introduction of student active learning counters the effect of the cognitive trait Introversion (I) versus Extraversion (E), which was found in the earlier study by Saebø et al (Citation2015). A new model was fitted including the variable NonAttend, the percentage of the absence of each student, together with the potential interaction with all the four cognitive trait variables. After backward elimination, the final Model (4) contained(4)
(4) where β7 is the interaction effect between the two categorical variables Extraversion (E) and NonAttend on the response. The explained variability in the logit-score increased to
with Model (4).
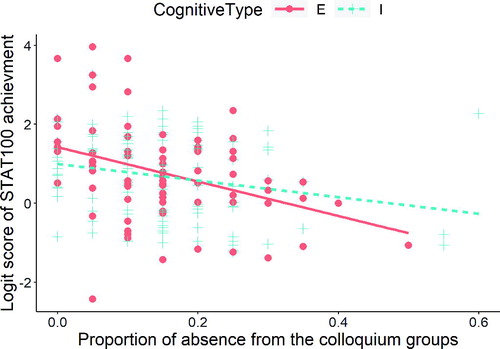
Expectedly, there was a negative effect of not attending colloquium groups, but interestingly this effect had a statistically significant interaction (p-value 0.015) with the Extraversion (E)/Inroversion (I) trait, visualized in . The estimated model output indicates that for extraverts, there is a noticeable negative effect of not attending the groups (–3.91), whereas the corresponding effect for introverts is much less negative (–1.09), the latter being a statistically nonsignificant negative effect (p-value
0.126). Hence, it did not substantially affect the exam score of the introverts who did not attend the colloquium groups, whereas the extraverts who did not attend the groups scored substantially lower than the extraverts who participated in the colloquium groups.
Fig. 2 The logit-scores from the introductory course in statistics plotted against the percentage of absence from the colloquium groups and colored with respect to the cognitive type Extraversion (E) and Introversion (I) together with their respective regression lines.
Other step-by-step methods were tested, but Model (4) proved to be best fit in accordance to R2 and significance as a criterion for including effects.
4 Discussion
We found that the cognitive traits Digital (D) and Theoretical (T) have positive effects on expected exam score in the introductory statistics course STAT100, also after adjusting for high school math level and math grade. There was no significant interaction effect between the high school math level and math grade on the STAT100 exam scores. This implies that among students with the same high school math grades, those with a higher math level are expected to perform better on the STAT100 exam.
We found a significant interaction effect between the Extraversion (E)/Introversion (I) trait and the percentage of absence from the colloquium groups on the exam results: The Extraverts (E) who did not attend the groups scored significantly lower on the exam than the Extraverts (E) who participated in group work. The interaction effect emphasizes that the students’ efforts and motivation may interfere with course structures, and thereby influence the students’ learning outcome.
Measuring the students’ motivation and learning outcome is a challenging task. In this study we have used exam scores. Although the STAT100 exam was split into three parts and developed to test different learning dimensions, a summative assessment with a traditional written exam at the end of the semester could probably stimulate short-term memorizing rather than long-term learning and understanding. Hence, the observed difference in the exam scores between the cognitive traits may be mediated by the difference in motivation and unobserved learning processes, and partly explained by the type of evaluation used. Since there are no formal standards of the content of a STAT100 exam, or how to formulate exam questions, the exam results will also partly be prone to chance.
The sample size of 183 in the study was sufficient to detect effects of interest. Furthermore, the school system in Norway ensures a comparable quality of all high schools and results based on high school math data can therefore be expected to be more precise than results from similar studies in countries with a large variation in education quality.
Participation in the study was voluntarily, and the cognitive traits were based on self-reported data from the students. This potential selection bias may affect the results, but it is not obvious to deduce which results could be biased, and by how much. Due to the restricted collection of explanatory variables, results may also be biased due to unmeasured confounding. As an example, the students’ choices of the high school math level, their high school math grades, and their STAT100 exam results may all be partly explained by their inherent interest in science. Furthermore, the measured variables can also be influenced by the student’s motivation to learn statistics, work ethic, and ambition, none of which we have measured. However, such traits can also be intertwined with the cognitive profiles, or be considered as mediating variables, and it is therefore not evident whether or how to include such variables in a model.
Studies of cognitive traits in STEM education often show that Introversion (I), Intuition (N), Thinking (T), and Digital (D) type students generally outperform the students of Extraversion (E), Sensing (S), Feeling (F), and Contextual (C) type (McCaully et al. Citation1983; Rosati Citation1997; Felder Citation2002). In accordance, the findings from Saebø, Almøy, and Brovold (Citation2015) showed that Digital (D), Introversion (I), and Thinking (T) type students scored significantly higher on exams in STAT100 at the NMBU than the opposite type: The Contextual (C), Extraversion (E), and Feeling (F). Furthermore, Saebø et al. (Citation2015) argued that these differences should not be interpreted as difference in skills, but rather that the course is structured in a manner that favors the types mentioned. Hence, the main intention behind the 2015/2016 course structure alteration was to try a way of teaching that was believed to benefit students with Contextual (C), Extraversion (E), and Feeling (F)-type preferences, since these students were believed to struggle most with the classical lecturing style of teaching.
In the present study, the significant negative effect of Extraversion (E) on exam scores, which was reported by Saebø et al. (Citation2015), was not found. Extraverted (E) students perform similarly to Introverted (I) students in STAT100 with the change from lecture-based teaching to dialogue based student active learning in the flipped classroom. The positive effect of this type of collaborative learning for Extraverts (E) is further supported by our finding that Extraverts (E) perform even better when they attend the colloquium groups compared to being absent and presumably working individually. Although this result might also be somewhat confounded by, or intertwined in, unmeasured traits like motivation; that is, that nonmotivated Extraverted (E) students are more likely to be absent from group work than their Introverted (I) peers, it is still a strong implication that different teaching styles (e.g., lecture vs. flipped classroom) may be necessary to reach out to students with different cognitive preferences.
It was anticipated that the gap in exam performance between Contextually (C) and Digitally (D) oriented students would be diminished with an adapted and modified style of teaching. However, contrary to our hypotheses, the Contextual (C) students still perform at a significantly lower level than the Digital (D) students. The Contextual (C) students are expected to thrive better under a flexible teaching regime (Myers and Myers Citation1995; McCrae and Costa Citation2003; Brovold Citation2014), and a highly structured course and curriculum with lectures and textbook reading and exercises may be too rigid for the Contextual (C) students. However, although the new STAT100 course was taught in a student active manner, the course structure was admittedly quite inflexible, with weekly mandatory assignments and a compulsory attendance requirement of 67% at colloquium groups twice a week, with preparation through watching lecture videos. This tight scheme may have reduced the motivation for learning for this group of students.
The large extent of compulsory work related to the colloquium group got remarkable high attention in the student evaluations. Personal feedback from several students indicated that there was a heavy workload attached to this part of the course, which also probably had a negative effect on the voluntary attendance on regular exercise groups where students sit and solve problems on an individual (or group) basis. These exercise groups are important for automation of computational and formal statistical skills. Theory of a cognitive type’s support is that the Digital (D) type is better on such automation tasks and it is reasonable to believe that the Contextual (C) students are even more reluctant to attend these voluntary exercises in addition to the compulsory part of the course. This is also a possible explanation of the differences in exam performance between the Contextually (C) and Digitally (D) oriented students.
The workload and exercise organization mentioned above could also explain the lack of difference in performance between the cognitive archetypes Intuition (N) and Sensing (S), often found in theoretical fields (McCaully et al. Citation1983; Felder Citation2002). Furthermore, it should also be noted that a major part of the course curriculum is of a kind that needs memorizing and repetitive exercise solving which favors the Sensing (S) type students more than the Intuitive (N) ones, who more easily get bored with repetitive tasks (Brovold Citation2014). Brovold (Citation2014) highlighted that a project-based course format could be a better envision for the Intuitive (N), where they can discover the usefulness of the statistics discipline through self-exploration.
It was expected that the Feeling (F) type students would benefit from a teaching style with a more social setting and increased teacher–student interaction, in which the difference in exam performances found for the Feeling (F) versus Thinking (T) traits would be attenuated (Fairhurst and Fairhurst Citation1995; McCrae and Costa Citation2003; Brovold Citation2014). However, in the present study, the Thinking (T)-type students still outperformed the Feeling (F)-type students, in accordance with (Rosati Citation1997; Felder Citation2002; Saebø, Almøy, and Brovold Citation2015). This may be explained by the fact that statistics is a highly theoretical subject, which by default may fit better to the interests and mindsets of students with Thinking (T)-type cognitive preferences. Despite a student active environment, the Feeling (F)-type students may still experience lack of sufficient amounts of personal contact with and feedback from the teachers, which has been found to be important for this cognitive type to feel comfortable and thrive in learning situations. In Emerson, English, and McGoldrickb (Citation2016), the Feeling (F) types did not point out cooperative learning as a favorable learning style. Felder (Citation2002) discovered the same phenomenon and discusses whether this may be due to the fact that a Feeling (F)-type student may feel overwhelmed by strong Thinking (T)-type personalities in a group, when learning a technical subject. Therefore, the group effect with cooperative learning may have the opposite effect on the Feeling (F)-type students than is first anticipated. One could also speculate that the gap between the Thinking (T)- and Feeling (F)-type students has become smaller with the change to a more dialogue based and student active course structure.
Both Rosati (Citation1997) and Felder (Citation2002) reported stronger effects of different cognitive types on exam performance for the academically weak students. In the present study, the lack of interaction effect between cognitive traits and high school grade, on exam scores, indicates that this is not the case for the statistics students at the NMBU. However, most NMBU students are life sciences students with ambition toward fields other than technology, engineering, and mathematics where they have STAT100 as the only mandatory statistics course in their study plans. The mean math grade from high school of 4.1, the few students (n 34) with top grades in mathematics (that is, grade “5” or “6”), and the mean STAT100 grade in the present study, show that the students’ performance is at a mediocre level. Also, the students who drop out of the course, who chose not to take the cognitive trait assessment, or do not complete the mandatory activities are not included in the present analyses. It could be assumed that a large proportion of the latter students are the academically weak ones. Hence, the study sample in the present study may not span the grade scale to the same extent as students at other STEM universities. This may explain the lack of interaction effect of cognitive traits and grades that was found in other studies. If the findings of Rosati (Citation1997) and Felder (Citation2002) are the case, then it is even more important to consider alternative teaching strategies, so that a bigger part of the student population can feel mastery and succeed in statistics.
Our result highlights Cronbach’s (Citation1957) theory: everybody acquires knowledge and adapts to learning approaches differently. This will also apply to the field of statistics. A flipped classroom, with a student active approach, is an educational design that makes the student feel more responsible for their own learning outcome. This in turn means that the students themselves contribute through their own activity to establish a form of personalized learning or the best treatment and environment for their own or the group’s mastery. Based on our results it seems that the students with an Extravert (E) trait are able to profit more from group dynamics and/or learning through interaction. However, our findings indicate that this may not apply to the same extent to the more Introverted (I) students. They seem to be dependent on being able to process their experiences at their own pace and in more individual ways. Hence, one pedagogical treatment doesn’t fit them all.
As Felder and Brent highlights in their book (Felder and Brent Citation2016), the traditional lecture style violates every principle of effective instruction and suits very few students, if any. Nevertheless, to adapt teaching to fit each one’s learning preference will be futile. The overall goal is not to teach each student in the way that he or she prefers, it is to make sure instruction is balanced and not heavily biased in favor of one preference or another. The goal, as Felder and Brent point out (Felder and Brent Citation2016, p. 278), should be to teach in an inclusive manner that helps as many students as possible to succeed and enable them for further use of the topic.
5 Conclusion
Our main goal was to investigate whether an adjustment in teaching structure would affect the students’ performances in the introductory course in statistics (STAT100). The students we meet in introductory courses in statistics comprise a cognitively heterogeneous student population, and a “one-size-fits all” approach may be disadvantageous and directly unmotivating for them. Several of our results did coincide with the previous studies of the effect of cognitive types on performance in STEM subjects. The novel finding was that a previously found negative effect of Extraversion (E) on exam scores in a lecture-based course was no longer found when the course was taught according to the flipped classroom principle, with cooperative learning, and more student activity in the learning process. Apparently, these students benefited more from dialogue and closer contact with other students and the teachers. The Extraverts (E) also performed better when they attended the colloquium groups compared to being absent. However, the students with Digital (D) and Thinking (T) cognitive preferences still outperformed students with Contextual (C) and Feeling (F)-based preferences, respectively.
These findings are sufficient indications that additional adaptations should be made, in order to reach a wider scope of the heterogeneous student mass taking an introductory course in statistics.
Notes
1 The students answered the test in Norwegian, but the English translation is also available at the same webpage.
References
- Biggs, J. (2011), Teaching for Quality Learning at University. New York: Open University Press.
- Brovold, H. (2014), Invarians Drøftet i et nevropsykologisk perspektiv med spesiell referanse til realfag kognisjon. “Fire veier inn i matematikken”. Thesis, Norwegian University of Science and Technology.
- ——— (2020), Utdanningstesten - med fokus på realfag. The National Center for Science Recruitment. Available at: https://www.utdanningstesten.no/
- Buckridge, M., and Guest, R. (2007), “A Conversation About Pedagogical Responses to Increase Diversity in University Classrooms,” High Education Research & Development, 26.
- Charalambous, M., Hodge, J. A., and Ippolito, K. (2020), “Statistically Significant Learning Experiences: Towards Building Self-efficacy of Undergraduate Statistics Learners Through Team-Based Learning,” Educational Action Research, 29, 1–19.
- Conners, F. A., Maccown, S. M., and Roskos-Ewoldsen, B. (1998), “Unique Challenges in Teaching Undergraduate Statistics,” Teaching of Psychology, 25, 40–42. DOI: 10.1207/s15328023top2501_12.
- Costa, P. T., and McCrae, R. R. (1992), Revised NEO Personality Inventory and NEO Five Factor Inventory Professional Manual, Odessa: Psychological Assessment Resources.
- Cronbach, L. J. (1957), “The Two Disciplines of Scientific Psychology,” American Psychologist, 12, 671–684. DOI: 10.1037/h0043943.
- Dockterman, D. (2018), “Insights From 200+ Years of Personalized Learning,” Npj Science of Learning, 3, Article no. 15.
- Emerson, T. L., English, L., and McGoldrickb, K. M. (2016), Cooperative learning and personality Types.” Available at: https://www.sciencedirect.com/science/journal/14773880.
- Fairhurst, A. M., and Fairhurst, L. L. (1995), Effective Teaching, Effective Learning: Making the Personality Connection in Your Classroom, Mountain View, CA: Davies-Black, CPP. Inc.
- Felder, R. M. (2002), “The Effects of Personality Type on Engineering Student Perfermance and Attitudes,” Journal of Engineering Education, 3–17. DOI: 10.1002/j.2168-9830.2002.tb00667.x.
- Felder, R. M., and Brent, R. (2016). Teaching and Learning STEM — a Practical Guide. San Francisco, CA: Jossey-Bass.
- FitzGerald, E., Jones, A., Kucirkova, N., and Scanlon, E. (2018), “A Literature Synthesis of Personalised Technology-Enhanced Learning: What Works and Why,” Research in Learning Technology, 26. DOI: 10.25304/rlt.v26.2095.
- Foldnes, N. (2016), “The Flipped Classroom and Cooperative Learning: Evidence From a Randomised Experiment,” Active Learning in Higher Education, 17, 39–49. DOI: 10.1177/1469787415616726.
- Goldberg, L. R. (1993), “The Structure of Phenotypic Personality Traits,” American Psychologist, 26–34. DOI: 10.1037/0003-066X.48.1.26.
- Jensen, J. L., Kummer, T. A., and Godoy, P. D. (2015), “Improvements From a Flipped Classroom May Simply be the Fruits of Active Learning,” CBE Life Science Education, 14. DOI: http://doi.org/10.1187/cbe.14-08-0129.
- Jung, C. G. (1921), Psychologische Typen. ZüRich: Rascher.
- Keeler, C. M., and Steinhorst R. K. (1995), “Using Small Groups to Promote Active Learning in the Introductory Statistics Course: A Report from the Field,” Journal of Statistics Education, 3. DOI: 10.1080/10691898.1995.11910485.
- Loux, T. M., Varner, S. E., and VanNatta, M. (2016), “Flipping an Introductory Biostatistics Course: A Case Study of Student Attitudes and Confidence,” Journal of Statistics Education, 24, 1–7. DOI: 10.1080/10691898.2016.1158017.
- McCaully, M., Godleski, E., Yokomoto, C., Harrisberger, L., and Sloan, E. (1983), “Applications of Psykological Type in Engereering Education,” Edgineering Education, 394–400.
- McCrae, R. R., and Costa, P. T. (2003), Personality in Adulthood: A Five-Factor Theory Perspective (2nd ed.), New York: The Guilford Press.
- McLaughlin, J. E., and Kang, I. (2017), “A Flipped Classroom Model for a Biostatistics Short Course,” Statistics Education Research Journal, 16, 441–453.
- Miller, R. K. (2015), “Why the Hard Science of Engineering is No Longer Enough to Meet the 21st Century Challenges,” Olin College of Engineering, Available at: http://www.olin.edu/sites/default/files/rebalancing_engineering_education_may_15.pdf
- Myers, I. B., and Myers, P. B. (1995). Gifts Differing: Understanding Personality Type. Palo Alto, Calif.: Davies-Black Publishing.
- Peterson, D. J. (2016), “The Flipped Classroom Improves Student Achievement and Course Satisfaction in a Statistics Course: A Quasi-Experimental Study,” Teaching of Psychology, 41, 10–15. DOI: 10.1177/0098628315620063.
- Poropat, A. (2009), “A Meta-Analysis of the Five-Factor Model of Personality and Academic Performance,” Psychological Bulletin, 135, 322– 338. DOI: 10.1037/a0014996.
- Rosati, P. (1997), “Psychological Types of Canadian Engineering Students,” Journal of Psychological Type, 41, 33–37.
- Schultz, D., Duffield, S., Rasmussen, S. C., and Wageman, J. (2014), “Effects of the Flipped Classroom Model on Student Performance for Advanced Placement High School Chemistry Students,” Journal of Chemical Education, 91, 1334–1339. DOI: 10.1021/ed400868x.
- Scott, P. (1995). The Meanings Of Mass Higher Education, Buckingham, UK: SHRE and Open Univerity Press.
- Saebø, S. (2020), “Solve Saebø.” Available at: https://www.youtube.com/channel/UCQ3SIQ5bTqVB77m4rgKUlJA
- Saebø, S., Almøy, T., and Brovold, H. (2015), “Does Academia Disfavor Contextual and Extroverted Students?” Uniped, 38, 274–283. DOI: 10.18261/ISSN1893-8981-2015-04-03.
- Tishkovskaya, S., and Lancast, G. A. (2012), “Statistical Education in the 21st Century: A Review of Challenges, Teaching Innovations and Strategies for Reform,” Journal of Statistics Education, 20, 1–55.
- Tucker, B. (2012), “The Flipped Classroom,” Education Next, 12, 82–83.