Abstract
Temporality-driven covariate classification had limited impact on: the specification of directed acyclic graphs (DAGs) by 85 novice analysts (medical undergraduates); or the risk of bias in DAG-informed multivariable models designed to generate causal inference from observational data. Only 71 students (83.5%) managed to complete the “Temporality-driven Covariate Classification” task, and fewer still completed the “DAG Specification” task (77.6%) or both tasks in succession (68.2%). Most students who completed the first task misclassified at least one covariate (84.5%), and misclassification rates were even higher among students who specified a DAG (92.4%). Nonetheless, across the 512 and 517 covariates considered by each of these tasks, “confounders” were far less likely to be misclassified (11/252, 4.4% and 8/261, 3.1%) than “mediators” (70/123, 56.9% and 56/115, 48.7%) or “competing exposures” (93/137, 67.9% and 86/138, 62.3%), respectively. Since estimates of total causal effects are biased in multivariable models that: fail to adjust for “confounders”; or adjust for “mediators” (or “consequences of the outcome”) misclassified as “confounders” or “competing exposures,” a substantial proportion of any models informed by the present study’s DAGs would have generated biased estimates of total causal effects (50/66, 76.8%); and this would have only been slightly lower for models informed by temporality-driven covariate classification alone (47/71, 66.2%). Supplementary materials for this article are available online.
It’s such a mistake, I always feel, to put one’s trust in technique
(George Smiley in: The Looking Glass War by John Le Carre, 1965)
1 Introduction
1.1 Statistical Skills at the Heart of Evidence-Informed Policy and Practice
Notwithstanding George Smiley’s caution and the fallibility of method, statistical expertise plays an increasingly important role in generating and interpreting quantitative evidence to inform policy and practice (Teater et al. Citation2017; Firpo Flyvbjerg et al. Citation2019); and training in statistical skills has always needed to keep pace with ongoing developments in analytical practice (Tu and Greenwood Citation2012; Porta, Vineis, and Bolúmar Citation2015; Efron and Hastie Citation2016; Hokimoto Citation2019; Lübke et al. Citation2020). Indeed, perhaps the most important contribution that statistics can make to evidence-based decision making (and, by extension, the contribution that statistical skills training can make to professionals and the lay public, alike) is in revealing and dealing with the many different sources of bias that can occur when analyzing and interpreting obvious, observable differences between ostensibly comparable phenomena (Firpo Flyvbjerg et al. Citation2019). Regardless of whether such comparisons are an integral part of human nature or a conditioned response to our natural and social environments (Ross Citation2019), they manifest as compelling objects of enquiry and speculation even for those trained to recognize how method, context, and perspective determine the extent to which these comparisons actually provide precision, generalization, and causal/predictive insight, respectively (Asprem Citation2016).
In the not so recent past, concern with selection bias (and, to some extent, with chance associations generated by underpowered sample sizes) led to a renewed focus: on statistical training in the use of research design (particularly experimentation and randomization) to address potential sources of bias when estimating evidence of cause and effect; and on critical appraisal and research synthesis techniques (including meta-analysis) to deal with contradictory findings from different studies undertaken in different contexts using different techniques (Djulbegovic and Guyatt Citation2017). Over time, the limited utility of this approach has led to a resurgence of interest in the analysis of nonexperimental (observational) data and the synthesis of “real world evidence” (e.g., Klonoff Citation2020; though see also: Losilla et al. Citation2018). Indeed, there is broad consensus that such analyses will remain far more common in many applied disciplines, not least in the era of “digital tech” and “Big Data” (Eustace Citation2018); and in contexts where intervention complexity, ethics, governance, safety, participation, and cost make experimentation impossible or simply undesirable and undesired (Meyer et al. Citation2019).
1.2 Why Observational Data, Why Causal Inference and Why Directed Acyclic Graphs (DAGs)?
Many of the same sources of bias that led to the earlier focus on experimentation and randomisation—particularly those relating to confounding and sampling bias—continue to threaten the validity of observational analyses, not least because design constraints mean that such studies exert little control over the allocation of naturally occurring “exposures” (be these physical, biological, or social phenomena). Nonetheless, recent efforts to address confounding and sampling bias have made substantial progress; and the emergence of “causal inference” as a novel interdisciplinary field spanning statistics, mathematics, and computing (as well as the applied social and biomedical sciences), has helped in the translation of abstract theoretical techniques into accessible and practical applications (Porta, Vineis, and Bolúmar Citation2015; Lübke et al. Citation2020).
Causal path diagrams (commonly operationalized as directed acyclic graphs; DAGs) are one such technique. These diagrams enable analysts to summarize and share both: their theoretical knowledge and speculation regarding the likely nature of the underlying data-generating mechanism (and the causal relationships that are thought to exist between measured [“manifest”] and unmeasured [“latent”] variables); and how these assumptions (and presumptions) are reflected in the statistical analyses designed to generate causal inference. In effect, using DAGs to strengthen the design of such analyses requires analysts to up their game by thinking through their assumptions and taking greater care to prepare, double check, and open these up for scrutiny, debate, and challenge (Textor et al. Citation2016).
Notwithstanding the philosophical and epistemological considerations involved (which have been summarized in Section 1 of the online supplementary materials), DAGs offer an immediate and compelling contribution to improving the analysis of observational data because they help to encourage and facilitate the principled elucidation of plausible (yet often imperceptible) data generating processes, and thereby reveal many of the critical features involved so that these can: inform the design of statistical models; and ensure these models are capable of providing a sound basis for causal inference. These benefits reflect the ease with which DAGs can help analysts seeking causal inference to identify which of the variables that are known or available to them might play important roles in the causal relationship they are interested in estimating (the so-called “focal relationship”, Aneshensel Citation2002), and the extent to which a hypothesized cause (the specified “exposure”) might genuinely affect a hypothesized consequence (the specified “outcome”). Indeed, beyond the variables specified as the “exposure” and “outcome” in any given analysis, each of the other measured covariates (and all of any other unmeasured or latent covariates, regardless of whether these are known or available to the analyst involved) can act as “confounders,” “mediators,” or “consequences of the outcome”, and—when key causal paths among these variables are missing—in a whole host of other roles, such as “competing exposures” and “mediator-outcome confounders” (see ). “Confounders” are covariates that cause both the specified exposure and the specified outcome and which, in the absence of adjustment (or equivalent conditioning achieved through sampling or stratification), can reverse, enhance and/or mask the direction, strength, and precision of the true (total causal) relationship between exposure and outcome (as a result of “confounder bias” (VanderWeele Citation2019)). “Mediators” are covariates that are caused by the specified exposure and cause the specified outcome (i.e., they fall along one of the potential causal paths between the specified exposure and outcome). Like confounders, mediators can reverse, enhance, and/or mask the direction, strength, and precision of the true (total causal) relationship between exposure and outcome (as a result of inferential bias generated through “over-adjustment” (Richiardi, Bellocco, and Zugna Citation2013; Gilthorpe et al. Citation2015))—though, unlike confounders, mediators only generate such biases after (over-)adjustment (or as a result of conditioning thereon through sampling or stratification (Westreich and Greenland Citation2013)). Meanwhile, “consequences of the (specified) outcome” are covariates that do not necessarily have any causal relationship with the specified exposure but are caused by the specified outcome. Like mediators, conditioning on such variables can reverse, enhance, and/or mask the direction, strength, and precision of the true relationship between the exposure and the outcome as a result of biases that are essentially the same as those generated through conditioning on the outcome and (when they are also consequences of the specified “exposure”) “collider bias” (Elwert and Winship Citation2014; Porta, Vineis, and Bolúmar Citation2015; Ellison Citation2020; Griffith et al. Citation2020; Herbert et al. Citation2020). Finally, “competing exposures” are covariates that are causally unrelated to the specified exposure (whether directly or indirectly) but which cause—and can therefore explain a proportion of the variance in—the specified outcome. Conditioning on genuine competing exposures has no effect on the strength or direction of the relationship observed between the specified exposure and outcome, but can improve the precision of its estimation (Tennant et al. Citation2017).
Fig. 1 Temporality-driven directed acyclic graphs (DAGs) drawn to demonstrate the three principal roles that covariates can play when situated: before the specified exposure (potential confounders); between the specified exposure and outcome (likely mediators); and after the specified outcome (consequences of the outcome). The upper DAG (A) includes: all possible unmeasured covariate sets; all probabilistic causal paths (between preceding and subsequent variables); and two of the many other covariate roles (mediator outcome confounders [MOCs] and competing exposures) that are possible when one or more relevant causal paths are missing. The lower DAG (B) is the simplified example provided to medical undergraduates in the present study which excluded unmeasured covariates and MOCs.
![Fig. 1 Temporality-driven directed acyclic graphs (DAGs) drawn to demonstrate the three principal roles that covariates can play when situated: before the specified exposure (potential confounders); between the specified exposure and outcome (likely mediators); and after the specified outcome (consequences of the outcome). The upper DAG (A) includes: all possible unmeasured covariate sets; all probabilistic causal paths (between preceding and subsequent variables); and two of the many other covariate roles (mediator outcome confounders [MOCs] and competing exposures) that are possible when one or more relevant causal paths are missing. The lower DAG (B) is the simplified example provided to medical undergraduates in the present study which excluded unmeasured covariates and MOCs.](/cms/asset/8b77d09c-d2b2-466d-9f62-cdb7ec5644cc/ujse_a_1936311_f0001_c.jpg)
Clearly, by helping analysts better understand: which covariates do (and do not) introduce bias as a result of conditioning (whether through sampling, stratification, or adjustment); and which covariates do (and do not) warrant adjustment in statistical models examining the direction and strength of the potential total causal relationships among measured variables in observational datasets, DAGs can not only transform analytical practices but can also enhance the ability of analysts to critique and learn from the theories and modeling practices of others. These improvements in analytical modeling to support causal inference from observational data have helped to transform what passed for accepted/acceptable practice where, until relatively recently: there was little consensus on how to define or identify a true “confounder” (VanderWeele and Shpitser Citation2013); arbitrary and ostensibly haphazard techniques (including those based simply on the covariates for which data were available; Schelchter and Forsythe Citation1985) were commonplace; and even the more reputable parametric techniques were deeply flawed, such as:
selecting covariates for adjustment on the basis that they display strong univariate correlations with either the specified exposure and/or the specified outcome (e.g., Harris, Ellison, and Clement Citation1999a); and
using step-wise techniques to select a group of covariates whose adjustment optimizes the total amount of variance explained by the model (e.g., Harris, Ellison, and Clement Citation1999b).
Indeed, since covariates acting as confounders, mediators, competing exposures, and consequences of the outcome can display both strong and weak univariate correlations with specified exposures and outcomes (i), and since adjustment for each type of covariate can both strengthen and weaken the total amount of variance explained by the model (ii), neither of these parametric techniques are capable of distinguishing which covariates might act as genuine confounders, and which are likely to act as mediators, consequences of the outcome or competing exposures. DAGs have addressed this impasse by providing a principled schema based on two key tenets of causal logic, namely that: all causal paths are unidirectional (hence “directed”); and no consequence can directly or indirectly affect any of its own cause(s) (hence “acyclic”).
In this way, DAGs greatly improve the ability of analysts to identify potential confounders and include these in the “covariate adjustment sets” required to mitigate the effect of “confounder bias” in observational analyses that aim to support causal inference. DAGs have also provided the tools required to identify, better understand, and explicate hitherto complex and challenging sources of bias in observational datasets – perhaps the most famous of which is the “low birth weight paradox” (the observation that low birth weight babies are more likely to survive if their mothers had smoked during pregnancy), which DAGs have revealed to be a seminal example of “selection collider bias” (Porta, Vineis, and Bolúmar Citation2015).
1.3 The Potential Utility of Temporal Logic to Improve the Specification of DAGs
Nonetheless, the utility of DAGs to improve the design of observational analyses for causal inference ultimately depends upon the analyst’s understanding of the context and covariates involved, and such understanding is inevitably vulnerable to: errors and biases in the theoretical understanding, speculation, or empirical evidence on which this is based; and limitations in the knowledge, experience, and expertise of the analyst concerned. Thus, while DAGs help make such vulnerabilities visible, and thereby facilitate transparency, they add little to the valid estimation of causal inference beyond: exposing the inherent weaknesses in the data (and variables) available, the analyst’s (imperfect) understanding and associated assumptions; and ensuring the analyst’s statistical models appropriately reflect these.
For DAG-informed statistical models to provide greater confidence in the valid estimation of the direction, strength, and precision of focal relationships using observational data, a more consistent, consensual, and objective approach to specifying DAGs is required. This is where temporal considerations have an important role to play, since the role(s) that covariates can play in relation to a specified focal relationship are determined by causal relationships that are themselves dependent upon their temporal relationship to the specified exposure and outcome. Indeed—setting aside prior theoretical knowledge and speculation—temporality alone should determine which covariates might plausibly act as confounders, mediators, or consequences of the outcome simply on the basis of whether these occur before the exposure, between the exposure and outcome, or after the outcome, respectively. Assuming that all preceding variables can be assumed to act as (probabilistic) causes of all successive variables—at least in the absence of definitive evidence to the contrary—reduces the task facing experienced and inexperienced analysts alike to correctly identifying which of their known/available covariates occur before the specified exposure, and can therefore be considered potential confounders on the basis that they will be probabilistic causes of both the exposure and the outcome.
In spite of the substantive conceptual and contextual challenges involved in correctly identifying precisely when a covariate (as measured) is likely to have occurred—which, in the case of time-variant covariates requires evaluating when the covariate (as measured) “crystallized” in the form in which (and by the time at which) it was measured—drawing a DAG using temporal logic appears deceptively simple and seems to require limited technical expertise. As such, might not DAG specification and its tangible benefits (of improved transparency, interrogatability, and bias mitigation) be accessible to even inexperienced and novice analysts using temporality alone as the basis for determining the (probabilistic) causal relationships involved? This then was the rationale behind the development of a novel directed learning exercise for third year medical undergraduates,1 which comprised a series of four consecutive tasks culminating in the classification of covariates (as confounders, mediators, consequences of the outcome, and competing exposures) and the specification of DAGs. The aim of the present study was to evaluate the implementation of this exercise by examining: student engagement and task completion; the (mis)classification of covariates; the (mis)specification of DAGs; and the likely utility of these tasks for improving the design of observational analyses to support causal inference.
2 Methods
2.1 Background to the Directed Learning Exercise on DAG Specification
The development of the “Research and Special Studies” (RESS) strand within the undergraduate curriculum at Leeds Medical School, and the development therein of training in DAG specification during the third year (“RESS3”) module (Ellison et al. Citation2014a, Citation2014b), has been summarized in Section 2 of the online supplementary materials. The RESS3 module begins with a series of lectures explaining the distinction between clinical audit and service evaluation, and between biomedical and methodological research (“discovery”) and applied health service research (“translation”). These sessions also offer practical guidance on: expert and stakeholder involvement; institutional governance; and ethical approval procedures; and seek to emphasize and reinforce how these preparatory steps can offer tangible benefits in helping to establish: what mistakes to avoid; which questions to prioritize; what support might be required; and any necessary constraints to protect research participants and researchers alike. These lectures conclude with peer-led training in the use of NICE Evidence Search (a database developed by the UK’s National Institute for Clinical and Care Excellence to facilitate access to selected authoritative evidence on health and social care, including best practice guidelines), delivered with support from the NICE Evidence Search Champions Scheme (Rowley et al. Citation2015; Sbaffi et al. Citation2015).
The students then focus their attention on developing a “Project Protocol” assignment for a hypothetical study (comprising a combined audit and service evaluation) that aims to provide causal insights for improving adherence to a selected best practice guideline. The design of this assignment aims to balance the consistency required for the assessment of learning outcomes with opportunities for students to choose, innovate, succeed, and excel. To this end, the RESS3 Project Protocol assignment requires students to specify, as their project’s specified outcome, adherence to a clinical practice guideline in any specialty or context of interest to them. Likewise, for their specified exposure, students can then choose any modifiable aspect of health service organisation/delivery that might feasibly affect adherence to their selected practice guideline.
Over the weeks that follow, subsequent lectures, large-group lectorials, and small-group tutorials support the students to develop each of the five key skills required to design a detailed Project Protocol that is capable of generating the evidence required to support causal inference regarding the nature, direction, and strength of any relationship between their specified exposure and specified outcome. These skills involve: selecting which additional variables (i.e., covariates) are likely to be (un)necessary to measure, collect or extract; developing standardized data measurement and/or extraction procedures to strengthen precision and internal validity; designing coherent inclusion and exclusion criteria to optimize both internal and external validity; conducting sample size estimation to generate a suitably powered sampling strategy; and using DAGs to select an appropriate covariate adjustment set to minimize bias from measured confounders that are available for adjustment (and from adjustment for measured mediators [or consequences of the outcome] that have been mistaken for confounders), and thereby inform the design of suitable multivariable statistical models to support causal inference and associated interpretation.
The directed learning exercise developed to support the acquisition of the last of these skills draws together four successive tasks which are summarized on a two-sided worksheet that students work through during the large-group lectorial following their introductory lecture on causal inference and DAGs and subsequently discuss in supervised small-group tutorials later that same day. These four tasks comprise:
Task 1: Exposure and Outcome Specification: In this task, students first choose an appropriate exposure variable that “aims to measure/record the variation in clinical practice experienced by” service users receiving care within the clinical context(s) chosen by the student. Students then choose a suitable outcome variable that describes “whether each patient in your proposed study has received care that complied with the NICE guidance/standard” as chosen by the student.
Task 2: Covariate Selection: This task involves the selection of what are described as “potentially important variables – excluding the exposure—that are likely to cause the outcome, for which students are reminded that “such causes must precede the variable they cause—in this instance they must precede the outcome and cannot be a subsequent consequence of the outcome.”
Task 3: Temporality-driven Covariate Classification: Students are once more reminded that “causes must temporally precede the variable they cause” before they are directed to identify: which of the covariates selected during task 2 are confounders (since they were “ALSO likely to cause the exposure”); which are mediators (because they were “ALSO likely to BE CAUSED BY the exposure”); and which must be competing exposures (on the basis that they are neither causes of, nor are they caused by, the specified exposure—although it is worth noting that a substantial weakness in classifying competing exposures in this fashion is that all such covariates are likely to have indirect causal relationships with the exposure through their direct causal relationships with confounders, mediators, and consequences of the outcome).
Task 4: DAG Specification: Finally, in the last of the four tasks the students are simply directed to “sketch a Directed Acyclic Graph that includes your…exposure, outcome and each of the…” selected covariates as identified and classified during task 2 and 3 (above), respectively.
2.2 Engagement, Completion, Covariate (Mis)Classification and DAG (Mis)Specification
To evaluate the directed learning exercise and each of its subsidiary tasks, lectorial worksheets were photocopied, anonymised and the original returned to the students concerned. The anonymised worksheets were then used to assess the proportion of students who had successfully completed each of the four tasks (as outlined above) as a primary indicator of student engagement. The medical (sub)specialities pertinent to the clinical contexts, topics, and foci chosen by each student were then classified and enumerated to provide an assessment of the extent to which students had been able to exercise choice when selecting these. Similar summaries of the guideline-related outcomes, modifiable health service exposures and speculative causes of each of the student-selected outcomes (i.e., the covariates selected in the second task) offered an assessment of the extent to which students explored different healthcare pathways and the factors that might influence these. Subsequent, in-depth assessment (undertaken by the author) of the temporality-driven covariate classifications completed during the third task (and those reflected by the DAGs specified in the fourth task) permitted the estimation of covariate misclassification rates in each of these tasks, disaggregated by the type of covariate concerned (i.e., among confounders, mediators, consequences of the outcome, and competing exposures). Finally, each of the specified DAGs was subjected to detailed examination to calculate the average number of variables (nodes) and causal paths (arcs) these contained, and to enumerate the frequency of unorthodox features and technical errors (such as: the use of adirectional or bidirectional arcs; the unwarranted omission of arcs; and the presence of cyclical paths). Together, these analyses aimed to evaluate the potential utility of the directed learning exercise for strengthening the analytical knowledge, skills and competencies of undergraduate medical students in the use of DAGs to support the development of statistical models capable of generating causal inference from observational data (such as routinely collected health service data on which many of their exposures, outcomes, and covariates were likely to rely).
3 Results
3.1 Completion of the Four Successive Tasks in the Directed Learning Exercise
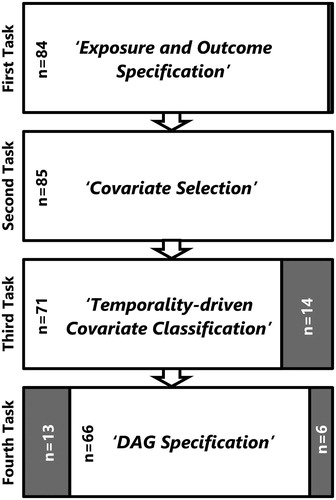
A total of 85 anonymised worksheets were available for analysis in the present study and although two thirds of the students involved (58, 68.2%) had successfully completed all four of the tasks in the directed learning exercise, completion rates declined with each successive task from: close to 100% for the first and second task (“Exposure and Outcome Specification,” and “Covariate Selection,” respectively); to 83.5% (71/85) for the third task (“Temporality-driven Covariate Classification”); and 77.6% (66/85) for the fourth and final task (“DAG Specification”; see ). The median number of covariates selected during the second of these tasks (i.e., those considered “potentially important variables… that are likely to cause the [specified] ‘outcome”’) was 8, with a range of 5–14. Of those covariate sets subsequently subjected to “Temporality-driven Covariate Classification,” all 71 contained at least one potential confounder (median number: 3; range: 1–8), while only 64 (90.1%) and 57 (80.2%) contained any likely “mediators” (median number: 2; range: 1–6), or possible “competing exposures” (median number: 2; range: 1–6), respectively.
Fig. 2 Flowchart summarizing the numbers of participants in the present study who completed each successive task within the directed learning exercise (white boxes; black text); and those participants who failed to complete one or more of these tasks (grey boxes; white text).
3.2 Student-Selected Clinical Contexts, Outcomes, Exposures, and Covariates
The practice guideline-related outcomes chosen by students during the first task in the present study (“Exposure and Outcome Specification”) spanned a wide range of clinical specialties; the only notable omissions were public health, oncology, radiology, intensive care, pathology, anesthesia, and surgery (see ). Likewise, the guidelines selected also covered every stage of the healthcare pathway, the commonest being: assessment and diagnosis (n = 17); referral, monitoring, and follow-up (n = 20); and the provision of advice, medication, therapy and/or care (n = 30). Somewhat unsurprisingly, given these outcomes were derived from practice guidelines that commonly serve as performance criteria, most (58/85, 68.2%) had associated delivery/waiting time targets.
Table 1 Clinical specialties, modifiable health service exposures, and guideline-related outcomes selected by 85 third year medical undergraduates receiving instruction in the use of DAGs to inform analytical modeling for causal inference. Students were also invited to speculate what additional covariates might act as likely causes of their selected outcome (in addition to their specified exposure), and these have been classified under four headings: patient characteristics and practitioner characteristics; healthcare facilities; and service catchment area.
Meanwhile, the preceding health service characteristics considered amenable to modification included: the location of health care delivery; the staff involved in delivering this care; and the expertise and equipment required/available. Of these, the most common involved consideration of which professions were available to/involved in the delivery of care (n = 16); the training, experience and expertise of the health care practitioners involved (n = 17); and associated staffing levels and staff-to-patient ratios (n = 18). These features also predominate among the patient-, practitioner-, facility-, and catchment-specific parameters which students speculated might act as potential causes of their selected outcomes during the second task (“Covariate Selection”); although a far greater proportion of students included those covariates specific to patients (95.1%) or health care facilities (90.1%) than to either practitioners (62.0%) or health service catchments (36.6%; see ).
3.3 Covariate Misclassification Prior to DAG Specification
Through careful assessment of those covariates classified as confounders, mediators, and competing exposures during the “Temporality-driven Covariate Classification” task it was possible to identify a substantial proportion that had been misclassified (see ). These included two covariates that were assessed as equivalent/identical to the specified exposure (one of which had been misclassified as a likely mediator; the other as a competing exposure); and three covariates that were assessed as being “consequences of the (specified) outcome” (all three of which had been misclassified as likely mediators). These errors aside, misclassification rates were lowest (at 4.4%) among the 252 covariates classified as potential confounders, although these misclassifications involved a larger proportion of the 71 students who completed this task (at 15.5%). Misclassification was substantially higher among the 123 covariates classified as mediators (at 56.9%) and among the 137 classified as competing exposures (at 67.9%); and these misclassification rates were higher still (at 84.4% and 93.0%) among the 64 and 57 students who classified at least one of their selected covariates as likely mediators or competing exposures, respectively.
Table 2 A comparison of student-reported and assessor-validated covariate classifications generated during the third task within the directed learning exercise (“Temporality-driven Covariate Classification”) among students who completed this task (n = 71/85, 83.5%).
As a result of these errors, only 11 (15.5%) of the students were assessed as having correctly classified all of their selected covariates as confounders, mediators, and/or competing exposures; and most of these students (9, 81.8%) only achieved this after selecting/classifying none of their covariates as mediators or competing exposures. This left just two students who had correctly classified one or more of their selected covariates as a confounder, mediator, and competing exposure. Nonetheless, were these classifications to have informed the covariate adjustment sets used in multivariable statistical models designed to mitigate the risk of bias (from unadjusted confounding or over-adjustment for mediators [or consequences of the outcome]) when estimating the (total causal) probabilistic relationship between the specified exposure and the specified outcome, only those instances where either: confounders had been misclassified as mediators (and excluded from the covariate adjustment sets used); or mediators [or consequences of the outcome] had been misclassified as confounders or competing exposures (and included in these covariate adjustment sets) would have led to biased estimates of the total causal effect. For this reason, a much larger proportion of the students who completed the “Temporality-driven Covariate Classification” task (24/71, 33.8%) would have been able to generate unbiased estimates of total causal effects on the basis of these classifications.
3.4 Covariate Misclassification During DAG Specification
Very similar covariate misclassification rates were also observed in the DAGs specified by the 66 (77.6%) students who went on to complete the final task of the directed learning exercise (“DAG Specification”; see ); although these rates were slightly higher for covariates classified as confounders (24.2% per DAG; 8.4% per covariate) and slightly lower for those classified as mediators (79.2% per DAG; 48.7% per covariate) or competing exposures (82.8% per DAG; 62.3% per covariate) when compared to those observed during the previous task (“Temporality-driven Covariate Classification”; see ). However, it is clear that a substantial proportion of the 58 (68.2%) students who completed both of these tasks altered not only the total number of covariates included therein, but also how these were classified (see ). Indeed, the total number of covariates classified as confounders, mediators, and competing exposures increased by 5.4% from n = 425 to n = 458 from the third to the fourth/final task; and while the DAGs contained a similar number of covariates classified as mediators, they contained substantially more covariates classified as confounders and competing exposures than those classified as such during the Temporality-driven Covariate Classification task.
Table 3 A comparison of student-reported and assessor-validated covariate classifications generated during the fourth task within the directed learning exercise (“DAG Specification”) among students who completed this task (n = 66/85, 77.6%).
Table 4 A comparison of student-reported covariate classifications generated during the third task (“Temporality-driven Covariate Classification”) with those classified in the fourth task (“DAG Specification”) among students who completed both tasks (n = 58/85, 68.2%).
These changes in the number and classification of covariates following “DAG Specification” may explain why substantially fewer of the students who completed this task successfully classified all of their selected covariates as confounders, mediators, or competing exposures (5/66, 7.6%) than those who completed the preceding task (11/71, 15.5%). This observation held true for the subset of 58 students who had completed both of these tasks, 17.2% of whom (10/58) had successfully classified all of their selected covariates following the “Temporality-driven Covariate Classification” task, while only 6.9% (4/58) had achieved this during “DAG Specification.” As before (see Section 3.3), the proportion of multivariable models capable of generating bias-mitigated estimates of the (total) probabilistic causal relationship between the specified exposure and specified outcome was substantially higher at 24.2% (16/66), although this was a good deal lower than that achieved by “Temporality-driven Covariate Classification” alone (24/71, 33.8%); and this disparity was also evident among the subset of students who completed both the fourth task (15/58, 25.9%) and the preceding third task (21/58, 36.2%).
3.5 DAG Specification Errors and Their Likely Consequences
Across all of the DAGs specified by the 66 (77.6%) students who completed the final task of the directed learning exercise, the median total number of nodes included was 10 and ranged from 4 to 14 (these numbers comprising all included covariates, as well as the specified exposure and specified outcome). All of these DAGs included at least one covariate assessed as representing a potential confounder, and the median number of such nodes was 4 (range: 1–10). In contrast, 17 (25.8%) DAGs contained no likely mediators, and the median number of mediators was just 1 (range: 0–6). Likewise, 9 (13.6%) DAGs contained no competing exposures, and the median number of competing exposures was also 1 (range: 0–6).
Two students included nodes in their DAG that were assessed as being consequences of the outcome (one student included two such nodes, the other included just one), though none of the three students who had previously selected (and misclassified) such covariates during the second and third tasks (see ) then went on to represent these as such in their DAGs (i.e., with arcs leading to them from the outcome, with or without additional arcs from the specified exposure and/or other included covariates). Elsewhere, 16 (24.2%) DAGs used composite “super-nodes” (i.e., a single node with which two or more covariates were associated; Tennant et al. Citation2020), and in these 16 DAGs the median number of arcs drawn was just 6 (range: 3–9), while for the remaining 50 (75.8%) DAGs—all of which had separate nodes for each of the selected covariates—the median number of arcs was 12 (4–22). Neither approach to DAG specification (using super-nodes or separate/discrete nodes) generated DAGs that were assessed as being “forward saturated” (i.e., included all possible arcs between temporally separated nodes); and all but one had missing arcs between covariates specified as potential confounders and those specified as likely mediators. There were also a substantial number of DAGs with missing arcs: between confounders and the specified outcome (32, 48.5%), from the specified exposure to any mediators (21, 31.8%), and from any mediators to the specified outcome (23, 34.8%). Indeed, there were even 9 (13.6%) DAGs in which the focal relationship itself—that is, the arc between the specified exposure and the specified outcome—was missing.
While a strict interpretation of these missing arcs would have made it challenging to assess which (if any) of the DAGs had correctly classified covariates as potential confounders, likely mediators or competing exposures, this was achieved by interpreting: covariates with single arcs leading into the exposure as confounders; those with single arcs leading out of the exposure as mediators; and those with only a single arc leading into the outcome as competing exposures—an approach that was validated by reference to the classificatory labels which 27 (40.9%) students had included next to individual covariates or clusters of covariates in their DAGs. Thus, despite the fact that almost all of the DAGs contained missing arcs (a serious issue given the strong assumption an absent arc implies), only a handful of DAGs contained errors suggesting a fundamental lack of understanding: only one contained a cyclical causal path; only one had used adirectional arcs (i.e., arcs that lacked arrows); and only one had arcs that ended in the middle of another arc (in this instance the arc between the specified exposure and outcome) rather than ending at one of the nodes at either end of that arc. Nonetheless, together with the large number missing arcs, and the associated failure to apply or achieve forward saturation, all of the specified DAGs contained at least one technical error, and none of the students succeeded in applying the “DAG Specification” task instructions correctly.
4 Discussion
Despite the tightly structured design of the directed learning exercise, the students involved in the present study were able to exert substantial choice when selecting the clinical specialties and contexts in which to situate their hypothetical Project Protocols. This is likely to have enhanced their engagement with, and completion of, the exercise, and should also have strengthened its impact on the successful acquisition of the DAG specification skills required to select an appropriate covariate adjustment set to minimize bias from available/measured confounders, and thereby inform the design of suitable multivariable statistical models to support causal inference and associated interpretation. However, it is also plausible that students were more likely to choose hypothetical contexts within clinical specialties for which they already (felt they) had sound theoretical knowledge, or at least sufficient interest and understanding on which to base any speculation necessary. If so, their prior assumptions regarding the likely causal pathways and data-generating mechanism(s) involved in such contexts—whether knowledge-based or somewhat speculative—may have actually made it more challenging for them to preference temporality during the third and fourth tasks of the directed learning exercise (“Temporality-driven Covariate Classification” and “DAG Specification,” respectively). Some evidence to this effect can be found in the list of clinical specialties that students did not choose as hypothetical contexts for their Project Protocol assignments (see ), since many of these only offer placements to medical undergraduates at Leeds Medical School in year 4 or 5 of the 5-year MBChB course (i.e., in the years after they complete the RESS3 module in which the present study took place; Murdoch-Eaton and Roberts Citation2009).
Setting these issues aside for the time being, the present study found that most of the students were able to complete all four of the tasks in the directed learning exercise; although an increasing proportion found the last two tasks (“Temporality-driven Covariate Classification” and “DAG Specification”) more challenging or difficult to complete within the time available. Moreover, since a small proportion of the students who completed the fourth task (“DAG Specification”: 8/66, 12.1%) did so without completing the third task (“Temporality-driven Covariate Classification”), it seems likely that the latter was experienced as the most difficult and time-consuming; or perhaps the least important for completing the ultimate task—DAG Specification itself. These possibilities are worth exploring further if, as seems plausible, the conceptual challenges involved when classifying covariates on the basis of their temporal relationship with the specified exposure (while ignoring any—potentially erroneous—prior knowledge or speculation regarding the causal/functional relationships involved), meant it was only possible to complete one of these tasks in the time available; and that some students found the fourth task needed to be (and could be) completed without completing the third.
Similar considerations might have influenced the emphasis many students placed not simply on completing the fourth and final task (“DAG Specification”)—regardless of whether they had completed the third—but also on choosing variables in the second of these tasks (“Covariate Selection”) that were more likely to be confounders than mediators or competing exposures.
Given the focus of the directed learning exercise on DAG specification, and on identifying potential confounders (and distinguishing these from likely mediators) to permit their inclusion in the covariate adjustment sets of multivariable models intended to generate causal inference, it is perhaps unsurprising that some students completed the fourth task (“DAG Specification”) without completing the third; or that all of the students who completed these last two steps classified at least one of their chosen covariates as a potential confounder. Likewise, it is also possible that students felt prompted, or indeed obliged, to specify at least some covariates as mediators and/or competing exposures—and thereby demonstrate/evidence that they could differentiate these from potential confounders—even though correctly classifying covariates as mediators and competing exposures was largely a secondary consideration given the focus on compiling appropriate covariate adjustment sets (of confounders) to mitigate the effects of potential confounding within multivariable models capable of generating causal inference.
Together with the potential impact of enabling students to choose the clinical speciality in which to situate their hypothetical Project Protocol on the prior theoretical knowledge and associated speculation available to them, the implicit expectations of the directed learning exercise—that students should focus on DAG specification (i.e., the fourth task) regardless of completing the preceding task (“Temporality-driven Covariate Classification”), and demonstrate their ability to identify potential confounders by distinguishing these from likely mediators or competing exposures—may well have undermined the successful acquisition of the skills intended. As such, addressing each of these expectations (and being able to evidence this) appears to have taken precedence over performing covariate classification and DAG specification with any degree of proficiency for the vast majority of students; only 5.9% (5/85) of whom completed all four tasks while correctly classifying the covariates they had selected.
It certainly seems likely that the instructions and prompts to privilege temporality over prior causal knowledge/speculation that were embedded within the third and fourth tasks of the directed learning exercise were either ineffectual or very difficult for students to apply against the backdrop of their existing knowledge, training, beliefs and/or interests in the healthcare contexts and pathways that they themselves had chosen as the basis for their hypothetical Project Protocol assignments. However, the present study found that many of the students who completed both of the last two tasks in the directed learning exercise (“Temporality-driven Covariate Classification” and “DAG Specification”) altered not only the classification of their covariates but also the total number of covariates involved. Contrary to the suggestion that students focused on completing these tasks (rather than on applying the skills required to perform these competently), it seems more likely that drawing their DAGs when completing the final task (i.e., “DAG Specification”) prompted or required many of the students to reconsider both the covariates they had chosen (in the second task of the exercise: “Covariate Selection”) and how these covariates had been classified (in the third task of the exercise: “Temporality-driven Covariate Classification”). It also seems clear that DAG specification led students to re-evaluate the role(s) that (other) covariates might play in relation to any potential causal relationship between the exposure and outcome variables they had chosen in the very first task (“Exposure and Outcome Specification”). As such, DAG specification – in and of itself – proved to be a task that invoked and involved considerations other than temporality when students decided which covariates were relevant for consideration/inclusion, and what role(s) each of these might play within their DAG.
Unfortunately, because the study context did not permit the random allocation of task completion (or the sequence in which tasks were completed), the differences observed between the n = 13 students who completed the third task without completing the fourth, the n = 8 students who completed the fourth task without completing the third, and the n = 58 who completed both the third and then the fourth task, might simply reflect differences in the confidence and competencies of: the students who found the “Temporality-driven Covariate Classification” so challenging (or time-consuming) that they did/could not complete the subsequent task; those who chose not to complete the “Temporality-driven Covariate Classification” task because they viewed this as irrelevant or unnecessary having quickly grasped its role in the “DAG Specification” task (and having decided/been able to undertake both tasks in a single step); and those who more diligently followed the instructions provided (which encouraged students to complete both tasks, one after the other; and to focus therein on temporality). Moreover—since so few students completed the third and fourth tasks without completing the fourth or third, respectively—the covariate classifications these provide offer scant evidence on which to draw firm conclusions as to the relative merits of “Temporality-driven Covariate Classification” versus “DAG Specification” alone, or in combination; and further research is warranted using experimental designs (in which groups of participants are randomly allocated to complete the third and fourth tasks independently, together, or in alternate sequences) to confirm whether “Temporality-driven Covariate Classification” and “DAG Specification” have differential (independent, combined, and/or sequential) effects on covariate misclassification rates. Were such differences to be confirmed, subsequent research would be warranted to establish (rather than infer) the reasons and reasoning involved in “Temporality-driven Covariate Classification” versus “DAG Specification.” Such research would be necessary to establish
the extent to which it is possible to base covariate classification decisions solely on careful and nuanced consideration of the temporal sequence of known covariates that constitute time-invariant phenomena—as opposed to those that have been operationalized as time variant measurements—or those conceptualized as characteristics of entities or processes rather than “events” in their own right; and
whether it is possible to preference temporality over the cognitive and heuristic prejudices created by the acquisition of theoretical knowledge (whether through training, experience or social conditioning; Wilson Citation1983).
Such research might generate important insights simply by conducting in-depth interviews with established analysts who have used temporality-driven covariate classification and/or DAG specification to inform the design of appropriate statistical models capable of generating causal inference from observational data. Experimental psychological techniques might also assist in elucidating the substantial challenges that conceptualization, operationalization and cognitive heuristics pose in achieving the phenomenological and critical realist perspectives and insights that are likely to be required to accurately and consistently interpret covariates (and their measurements) as markers of temporally anchored and relational events which can then be used to inform the design of statistical analyses capable of informing causal inference.
5 Conclusion
The present study extends our understanding of the ease with which directed learning in causal inference techniques might be integrated within undergraduate courses that aim to equip students with practical analytical and statistical skills. Using an exercise designed to provide directed learning in each of the four successive tasks involved in temporality-driven covariate classification and DAG specification, as well as substantial scope for student choice regarding the contexts and topics to which these tasks were applied, the present study demonstrated that reasonable levels of student engagement and task completion can be achieved. However, completion rates declined with each successive task, and a large number of errors were made in the last two tasks (“Temporality-driven Covariate Classification” and “DAG Specification”) which substantively undermined their classificatory value and analytical utility. Taken together, these findings suggest that some students struggled to complete the exercise in the time available, and that those who completed all four tasks may have only been able to do so at the expense of the diligence required to follow instructions, consolidate their learning, and demonstrate/attain a degree of proficiency.
Since the principal utility of specifying DAGs in full (i.e., with every temporally plausible arc included) is to facilitate the identification of covariate adjustment sets for any of the possible focal relationships (i.e., between any possible pair of variables when specified as the exposure and outcome), the DAGs drawn by students in the present study would have added little value to the classification of covariates undertaken in the preceding task (“Temporality-driven Covariate Classification”). Indeed, only a very modest proportion (16/66, 24.2%) of the specified DAGs provided a sufficiently clear indication as to which covariates were considered potential confounders, likely mediators and competing exposures so as to support the identification of an appropriate covariate adjustment set for mitigating potential bias from measured confounders (and misclassified mediators [or consequences of the outcome]) when estimating the (total) probabilistic causal relationship between the specified exposure and specified outcome. That said, as was evident from the assessment of the results of the previous task (“Temporality-driven Covariate Classification”; see ), clearly indicating which covariates are considered confounders, mediators, or competing exposures offers little benefit to subsequent analytical modeling if these have been incorrectly classified; and although the third task (“Temporality-driven Covariate Classification”) involved lower rates of covariate misclassification to those achieved during the subsequent task (“DAG Specification”), misclassification rates were still high enough to introduce substantial avoidable bias in any subsequent analyses aiming to estimate the (total) causal relationship between the specified exposure and specified outcome if these had relied upon covariate adjustment sets derived using the covariates as classified by either task.
Nonetheless, the selection of additional and alternative covariates and the changes in covariate classification that occurred as a result of completing the final task (“DAG Specification”) confirms the impact that drawing causal path diagrams—in and of itself—can make in elucidating the covariate adjustment sets required to mitigate bias from measured confounders (and misclassified mediators) in analyses of observational data that aim to support causal inference. At the same time, it is entirely possible that the apparent worsening in covariate misclassification rates observed following DAG specification in the present study simply reflected the powerful influence that theoretical knowledge and speculation can bring to bear on (re)interpreting the likely causal relationships between covariates selected on the basis that they that “…are likely to cause the outcome” (see Task 2: Covariate Selection; above); and even when the prior application of temporal logic has already been used to generate more objective covariate classifications. Moreover, it is worth bearing in mind that the undergraduates involved in the present study had limited expertise in the conceptualization and operationalization of quantitative variables (and particularly time-variant variables) as temporally anchored phenomena and on the opacity of temporal relationships among and between these. Indeed, these are exacting challenges even for competent analysts with advanced training and substantial experience (Tennant et al. Citation2020); and there are well-established (if contentious and contested) concerns that drawing DAGs might actually obfuscate rather than elucidate the critical insights and associated thinking required to design analytical models capable of supporting causal inference with observational data (e.g., Krieger and Davey Smith Citation2016). Clearly, further research is warranted to strengthen our understanding of whether, and how, training in DAG specification (and related techniques) might actually improve the selection of appropriate covariate adjustment sets for use in the analysis of observational data to support causal inference.
Supplemental Material
Download PDF (521.5 KB)Acknowledgments
This study would not have been possible without the participation of the MBChB students involved, and the support of colleagues within Leeds School of Medicine, including the Co-Lead of the RESS3 module (Mark Iles), and the module’s Tutorial Supervisors, each of whom make a substantial contribution to the annual programme of analytical training for third year MBChB students. Likewise, the development of undergraduate training in the use of temporality and directed acyclic graphs to develop the skills required to improve the design of statistical models for causal inference has benefited enormously from collaboration with Johannes Textor (from Radboud University Medical Centre in The Netherlands), and with colleagues from Leeds Causal Inference Group including: Kellyn Arnold, Laurie Berrie, Mark Gilthorpe, Wendy Harrison, John Mbotwa, Hanan Rhoma, Peter Tennant, and Carol Wilson – all of whom have been characteristically forthright in their views, and unstintingly generous with their insights, instincts, and ideas.
Supplementary Materials
Section 1: Philosophical and Epistemological Considerations in the use of DAGs; and Section 2: Development of Causal Inference Training at Leeds Medical School
References
- Aneshensel, C. S. (2002) Theory-Based Data Analysis for the Social Sciences, London: SAGE Publications.
- Asprem, E. (2016), “How Schrödinger’s Cat Became a Zombie: On the Epidemiology of Science-Based Representations in Popular and Religious Contexts,” Method and Theory in the Study of Religion, 28, 113–140. DOI: 10.1163/15700682-12341373.
- Djulbegovic, B., and Guyatt, G. H. (2017), “Progress in Evidence-Based Medicine: A Quarter Century On,” Lancet, 390, 415–423. DOI: 10.1016/S0140-6736(16)31592-6.
- Efron, B., and Hastie, T. (2016), Computer Age Statistical Inference, Cambridge, UK: Cambridge University Press.
- Ellison, G. T. H. (2020) “COVID-19 and the Epistemology of Epidemiological Models at the Dawn of AI,” Annals of Human Biology, 47, 506–513. DOI: 10.1080/03014460.2020.1839132.
- Ellison, G. T. H., Harrison, W., Law, G. R., and Textor, J. (2014a), “Graphical, Cross-Tabulatory and Relational: Which Is Best for Drawing DAGs?,” Proceedings of VI European Congress of Methodology, July 23, Vol. 6, p. 11.
- Ellison, G. T. H., Harrison, W., Law, G. R., and Textor, J. (2014b), “Teaching DAGs to Support MBChB Students Design, Analyze and Critically Appraise Clinical Research,” Proceedings of the 35th Annual Burwalls Meeting for Teachers of Medical Statistics, July 3, Vol. 35, p. 3.
- Elwert, F., and Winship, C. (2014), “Endogenous Selection Bias: The Problem of Conditioning on a Collider Variable,” Annual Review of Sociology, 40, 31–53. DOI: 10.1146/annurev-soc-071913-043455.
- Eustace, S. (2018), “Technology-Induced Bias in the Theory of Evidence-Based Medicine,” Journal of Evaluation in Clinical Practice, 24, 945– 949. DOI: 10.1111/jep.12972.
- Firpo Flyvbjerg, B., Ansar, A., Budzier, A., Buhl, S., Cantarelli, C., Garbuio, M., Glenting, C., Holm, M., Lovallo, D., Molin, E. J., and Rønnest, A. (2019), “On De-Bunking ‘Fake News’ in the Post-Truth Era: How to Reduce Statistical Error in Research,” Journal of the American Planning Association, 126, 409–411.
- Gilthorpe, M. S., Jiang, T., Tilling, K., Ellison, G. T. H., and Baxter, P. D. (2015), “Common Statistical Errors: Over-Adjustment for Confounders and Mediators in Lifecourse Research,” International Journal of Epidemiology, 44, Suppl 1, i36–i37. DOI: 10.1093/ije/dyv097.126.
- Griffith, G. J., Morris, T. T., Tudball, M. J., Herbert, A., Mancano, G., Pike, L., Sharp, G. C., Sterne, J., Palmer, T. M., Smith, G. D., and Tilling, K. (2020), “Collider Bias Undermines Our Understanding of COVID-19 Disease Risk and Severity,” Nature Communications, 11, 1–12. DOI: 10.1038/s41467-020-19478-2.
- Harris, H. E., Ellison, G. T. H., and Clement, S. (1999a), “Do the Psychosocial and Behavioral Changes That Accompany Motherhood Influence the Impact of Pregnancy on Long-Term Weight Gain,” Journal of Psychosomatic Obstetrics and Gynecology, 20, 65–79. DOI: 10.3109/01674829909075579.
- Harris, H. E., Ellison, G. T. H., and Clement, S. (1999b), “Relative Importance of Heritable Characteristics and Lifestyle in the Development of Maternal Obesity,” Journal of Epidemiology and Community Health, 53, 66–74.
- Herbert, A., Griffith, G., Hemani, G., and Zuccolo, L. (2020), “The Spectre of Berkson’s Paradox: Collider Bias in Covid-19 Research,” Significance, 17, 6–7. DOI: 10.1111/1740-9713.01413.
- Hokimoto, T., ed. (2019), Advances in Statistical Methodologies and their Application to Real Problems, London: IntechOpen.
- Klonoff, D. C. (2020), “The Expanding Role of Real-World Evidence Trials in Health Care Decision Making,” Journal of Diabetes Science and Technology, 14, 174–179. DOI: 10.1177/1932296819832653.
- Krieger, N., and Davey Smith, G. (2016), “The Tale Wagged by the DAG: Broadening the Scope of Causal Inference and Explanation for Epidemiology,” International Journal of Epidemiology, 45, 1787–1808.
- Losilla, J. M., Oliveras, I., Marin-Garcia, J. A., and Vives, J. (2018), “Three Risk of Bias Tools Lead to Opposite Conclusions in Observational Research Synthesis,” Journal of Clinical Epidemiology, 101, 61–72. DOI: 10.1016/j.jclinepi.2018.05.021.
- Lübke, K., Gehrke, M., Horst, J., and Szepannek, G. (2020), “Why We Should Teach Causal Inference: Examples in Linear Regression with Simulated Data,” Journal of Statistics Education, 28, 133–139. DOI: 10.1080/10691898.2020.1752859.
- Marsden, J. S. (2006), “An Insider’s View of the American and UK Medical Systems,” British Journal of General Practice, 56, 60–62.
- Meyer, M. N., Heck, P. R., Holtzman, G. S., Anderson, S. M., Cai, W., Watts, D. J., and Chabris, C. F. (2019), “Objecting to Experiments That Compare Two Unobjectionable Policies or Treatments,” Proceedings of the National Academy of Sciences, 116, 10723–10728. DOI: 10.1073/pnas.1820701116.
- Murdoch-Eaton, D. G., and Roberts, T. E. (2009), “The Doctor,” in Educating Professionals: Practice Learning in Health and Social Care, eds. M. Doel and S. M. Shardlow, Farnham: Ashgate, pp. 51–72.
- Porta, M., Vineis, P., and Bolúmar, F. (2015), “The Current Deconstruction of Paradoxes: One Sign of the Ongoing Methodological ‘Revolution’,” European Journal of Epidemiology, 30, 1079–1087. DOI: 10.1007/s10654-015-0068-8.
- Richiardi, L., Bellocco, R., and Zugna, D. (2013), “Mediation Analysis in Epidemiology: Methods, Interpretation and Bias,” International Journal of Epidemiology, 42, 1511–1519. DOI: 10.1093/ije/dyt127.
- Ross, D. (2019), “Empiricism, Sciences, and Engineering: Cognitive Science as a Zone of Integration,” Cognitive Processing, 20, 261–267. DOI: 10.1007/s10339-019-00916-z.
- Rowley, J., Johnson, F., Sbaffi, L., and Weist, A. (2015), “Peer-Based Information Literacy Training: Insights From the NICE Evidence Search Student Champion Scheme,” Library and Information Science Research, 37, 338–345. DOI: 10.1016/j.lisr.2015.11.007.
- Sbaffi, L., Johnson, F., Griffiths, J., Rowley, J., and Weist, A. (2015), “NICE Evidence Search: Student Peers’ Views on Their Involvement as Trainers in Peer-Based Information Literacy Training,” Journal of Academic Librarianship, 41, 201–206. DOI: 10.1016/j.acalib.2014.08.002.
- Schelchter, M. D., and Forsythe, A. B. (1985), “Post-Hoc Selection of Covariates in Randomized Experiments,” Communications in Statistics Theory and Methods, 14, 679–699. DOI: 10.1080/03610928508828942.
- Teater, B., Roy, J., Carpenter, J., Forrester, D., Devaney, J., and Scourfield, J. (2017), “Making Social Work Count: A Curriculum Innovation to Teach Quantitative Research Methods and Statistical Analysis to Undergraduate Social Work Students in the United Kingdom,” Journal of Teaching in Social Work, 37, 422–437. DOI: 10.1080/08841233.2017.1381216.
- Tennant, P. W. G., Arnold, K. F., Berrie, L., Ellison, G. T. H., and Gilthorpe, M. S. (2017), Advanced Modelling Strategies: Challenges and Pitfalls in Robust Causal Inference with Observational Data, Leeds: Leeds Institute for Data Analytics.
- Tennant, P. W. G., Harrison, W. J., Murray, E. J., Arnold, K. F., Berrie, L., Fox, M. P., Gadd, S. C., Keeble, C., Ranker, L. R., Textor, J., Tomova, G. D., Gilthorpe, M. S., and Ellison, G. T. H. (2020), “Use of Directed Acyclic Graphs (DAGs) to Identify Confounders in Applied Health Research: Review and Recommendations,” International Journal of Epidemiology, 50, 620–632. DOI: 10.1093/ije/dyaa213.
- Textor, J., van der Zander, B., Gilthorpe, M. S., Liśkiewicz, M., and Ellison, G. T. H. (2016), “Robust Causal Inference Using Directed Acyclic Graphs: The R Package ‘Dagitty’,” International Journal of Epidemiology, 45, 1887–1894.
- Tu, Y. K., and Greenwood, D. C., eds. (2012), Modern Methods for Epidemiology, Dordrecht: Springer.
- VanderWeele, T. J. (2019), “Principles of Confounder Selection,” European Journal of Epidemiology, 34, 211–219. DOI: 10.1007/s10654-019-00494-6.
- VanderWeele, T. J., and Shpitser, I. (2013). “On the Definition of a Confounder,” Annals of Statistics, 41, 196–220.
- Westreich, D., and Greenland, S. (2013). “The Table 2 Fallacy: Presenting and Interpreting Confounder and Modifier Coefficients,” American Journal of Epidemiology, 177, 292–298. DOI: 10.1093/aje/kws412.
- Wilson, F. (1983), “Hume’s Defence of Causal Inference,” Dialogue: Canadian Philosophical Review, 22, 661–694. DOI: 10.1017/S0012217300015316.