 ?Mathematical formulae have been encoded as MathML and are displayed in this HTML version using MathJax in order to improve their display. Uncheck the box to turn MathJax off. This feature requires Javascript. Click on a formula to zoom.
Abstract
We present an innovative activity that uses data about LEGO sets to help students self-discover multiple linear regressions. Students are guided to predict the price of a LEGO set posted on Amazon.com (Amazon price) using LEGO characteristics such as the number of pieces, the theme (i.e., product line), and the general size of the pieces. By starting with graphical displays and simple linear regression, students are able to develop additive multiple linear regression models as well as interaction models to accomplish the task. We provide examples of student responses to the activity and suggestions for teachers based on our experiences. Supplementary materials for this article are available online.
1 Introduction
In this article, we present an activity that allows students to explore multiple linear regressions using a dataset about LEGO building brick sets. The objective of our activity is to help students self-discover multiple linear regression using graphs as a starting point. The LEGO dataset is ideal to accomplish our objective because it contains variables that lend themselves to additive multiple linear regression models as well as models with interactions. For example, students create models to predict the Amazon price of Lego sets using explanatory variables such as the number of pieces and the theme. The activity guides students to achieve the following learning outcomes:
create and explore graphs with more than two variables,
self-discover an additive multiple linear regression model, and
develop a multiple linear regression model with an interaction.
Students typically struggle in their first exposure to multiple linear regressions. Self-discovery and experimentation, such as advocated in this activity, allow students to make connections on their own terms, thus solidifying the concepts and increasing student retention (Garfield Citation1995). In a traditional setting, multiple linear regression is introduced with two quantitative explanatory variables (e.g., Moore et al. Citation2015; Cannon et al. Citation2013). Using only quantitative variables makes it difficult for students to visualize the model after adding a second explanatory variable. The GAISE College Report (GAISE 2016) encourages the use of meaningful graphs with multivariate data and provides an example of a scatterplot with simple linear regression lines for multiple categories of a categorical variable. Without any formal introduction to multiple linear regressions, students can interpret results in a scatterplot including more than two variables, such as the one in the GAISE College Report. By choosing the second explanatory variable to be categorical instead of quantitative, students can explore the data and build their first multiple linear regression modeling aided by visualization.
In the following sections, we describe the dataset and activity. Further, we share student responses and provide recommendations to instructors for successfully conducting the activity. We conclude with suggestions for additional uses of the dataset.
2 Data Description
The dataset discussed in this article includes many variables describing LEGO building brick sets. LEGO sets are comprised of colored plastic interlocking bricks with accompanying gears, minifigures (LEGO people), and various other parts. Data on LEGO bricks are available in several locations (e.g., Allain Citation2014; Brickset n.d.; Pickett Citation2012; Kross Citation2015). To obtain an up-to-date dataset and a wider breadth of variables than are available on just one website, we merged scraped data from Brickset (n.d.) and BrickInstructions.com (n.d.) using R (R Core Team Citation2018; Wickham Citation2007, Citation2019, Citation2020; Wickham et al. Citation2020). A full description of the variables and the datasets is included with the supplemental materials.
The population of LEGO sets includes those produced between January 1, 2018 and September 11, 2020 (see supplemental materials lego.population.csv). This population dataset is restricted to the 1,304 LEGO sets posted on Brickset (Brickset n.d.), excluding LEGO mystery sets where the number of pieces were unknown. The population includes the sets found on Brickset because Brickset claims to have the most up-to-date list of LEGO sets (Millington Citation2018).
The population dataset includes 41 product lines called themes. For the activity, we present the students with a scaled down dataset to make it more manageable. Specifically, we pulled out three LEGO set themes for our activity: City, Friends, and Duplo. LEGO City sets generally include LEGO pieces with a primary color scheme with trucks, cars, and other vehicles. The LEGO Friends sets generally include LEGO pieces with a pink or purple color scheme. The age recommendations on both LEGO City and Friends sets are typically marked for aged 5+ or 6+ years. In contrast, LEGO Duplo sets include larger pieces typically marked for aged 1.5 or 2 years to 5 years.
In order for students to develop a basic understanding of multiple linear regressions, we want students to see a scenario where the slopes of Amazon price versus the number of pieces per set for two themes are very similar. For pedagogical reasons, throughout the entire activity, all students use a random sample of 25 LEGO City and 25 LEGO Friends sets that produces estimated models with very similar estimated price per piece for the two themes. Additionally, we want students to see estimated models where the slopes are not similar. Therefore, we include an additional random sample of 25 LEGO Duplo sets because LEGO Duplo sets have a consistently higher price per piece compared with other LEGO sets. The supplemental materials include the dataset with the 75 LEGO City, Friends, and Duplo sets (lego.sample.csv).
3 Activity
In this section, we present an activity where students use graphs to introduce multiple linear regression involving quantitative and categorical variables. In the activity, students answer three research questions:
Is there a relationship between the Amazon price versus the number of pieces per set for LEGO City and LEGO Friends sets in our sample?
Is there a difference in LEGO Friends sets and LEGO City sets regarding the Amazon price and the complexity in our sample?
Does the relationship between the Amazon price and the number of pieces differ between small and large bricks in our sample?
Students are able to answer the first research question after creating a scatterplot and an estimated simple linear regression model of the Amazon price by the number of pieces per set. One goal is for students to discover the transition from simple linear regression models to an additive multiple linear regression models. Students accomplish this goal by exploring the relationships in the graphs to answer the second research question. Finally, to answer the third research question, students explore a more complex multiple linear regression model with an interaction.
3.1 Classroom Use
Students complete the activity in two hours working in previously established cooperative groups. Instructors with shorter class periods can consider splitting the activity into two parts. For example, students can explore Research Questions 1 and 2 in one class period and can explore Research Question 3 in another class period. We recommend cooperative groups of size three or four to promote active learning as recommended in the GAISE College Report (GAISE 2016). Using cooperative groups also allows the instructor to ask questions that are more complex. Several of the questions in this activity are challenging questions that many individual students cannot answer on their own at this point in the curriculum.
We use the activity in our second statistics course with class sizes of 40 to 60. The course is an applied course and does not require students to do many hand calculations. Our students have a variety of majors, backgrounds, and levels of statistical literacy. The activity takes place during the 6th week of a 15-week semester after reviewing introductory statistics material and covering simple linear regression in depth. After completing this activity, the class spends the next four weeks on various multiple linear regression modeling topics such as quadratic models and model selection.
While students complete the activity, we have one instructor and one graduate student lab assistant in the room. If there are more than eight groups per instructor/assistant, we recommend encouraging groups to work together. Each group only requires a minimum of one computer, so this activity could be completed in a lecture-style room where at least one student per group has a laptop. Students can complete the activity using pencil and paper or by typing their answers. The statistical software our students use is JMP (JMP[textregistered], Version 15.2.0). The output in this article is from JMP; however, an R Shiny app (Chang et al. Citation2020; R Core Team Citation2018; Wickham Citation2016; Wickham et al. Citation2020) is provided to accompany this activity. The activity is available in the supplemental materials with instructions to use JMP or the R Shiny app.
3.2 Setting Up the Activity
Prior to starting the activity, we recommend the instructor present the context to increase student interest. For example, they can start by describing that LEGO Group is a large company with a cult following (Baichtal and Meno Citation2011). As a result, many dedicated LEGO fans have created blogs, such as The Brothers Brick and The Brick Fan (Feedspot Citation2020). One specific blog post to discuss includes a claim made by a mother who believes that LEGO sets designed for girls, such as LEGO Friends, are not as complicated as other LEGO sets (Momsla Citation2012). Complexity can mean different things, such as the number of pieces in a LEGO set, the number of steps required to put together a LEGO set, and the sizes of the individual pieces. We measure the complexity indirectly by the price. The price is determined by a variety of factors such as the number of pieces in a set and the number of new and unique molds required to create the pieces in the set (LEGO n.d.). The instructor should explain to students that, in the activity, we consider the number of pieces by the Amazon price as a measure of complexity and ultimately use this to support or contradict the mothers’ claim.
After introducing the claim, the instructor can discuss the three LEGO themes used in the activity: City, Friends, and Duplo sets. We find it helpful to show students one set from each theme, by either bringing physical sets to class or showing photos of sets readily available online. Seeing and discussing the sets further stimulates interest.
Following the description of the Lego context, the instructor presents descriptive statistics, such as those presented in . Students compare the Amazon price and the number of pieces per set for the various LEGO themes. Students quickly observe a similar estimated mean number of pieces for City and Friends sets, which is substantially larger than Duplo sets. In addition, the theme with the highest estimated mean Amazon price is City followed by Friends then Duplo.
Table 1 Summary statistics.
Helpful Hint: Before starting the activity, tell students they will explore new ideas without the expectation of perfect answers in their explanations. This will help avoid student frustration as they work through difficult questions.
3.3 Review of Simple Linear Regression (Answering Research Question 1)
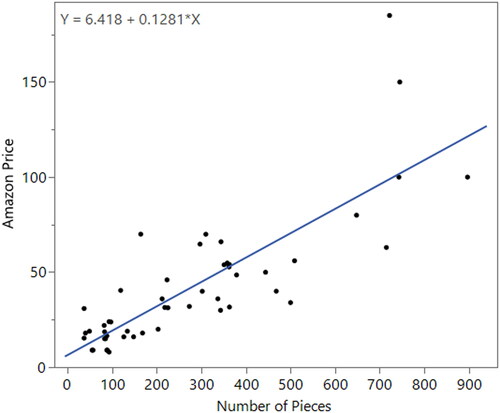
After the short motivational introduction and discussion of descriptive statistics, students are ready to start the activity using the sample data for LEGO City and LEGO Friends. Students begin identifying the explanatory and response variables and continue with a review of simple linear regression. In order for students to decide which variable is the explanatory variable and which is the response variable, they are directed to read a short description on lego.com explaining how LEGO determines the prices of their LEGO sets (LEGO n.d.). The online description indicates that the number of pieces in a set helps determine the price. After reading the description, students have sufficient information to define the number of pieces per set as the explanatory variable and the Amazon price as the response variable. Students use the variables to create a scatterplot and estimate a single simple linear regression model to answer the first research question (see ).
Fig. 1 Scatterplot displaying the relationship between the Amazon price and the number of pieces.
3.4 Developing an Additive Multiple Linear Regression Model (Answering Research Question 2)
In the second part of the activity, students see a hypothetical claim suggesting people pay more, on average, per piece for LEGO Friends sets compared to LEGO City sets. In order to investigate this claim, students start with their scatterplot with the single estimated simple linear regression line from the beginning of the activity. Students replace the single estimated line with two separate estimated simple linear regression lines; one for LEGO City sets and one for LEGO Friends sets (see ). The new regression lines help students see how adding the categorical LEGO theme further explains the relationship.
Fig. 2 Scatterplot displaying the relationship between the Amazon price and the number of pieces for LEGO City and LEGO Friends sets.
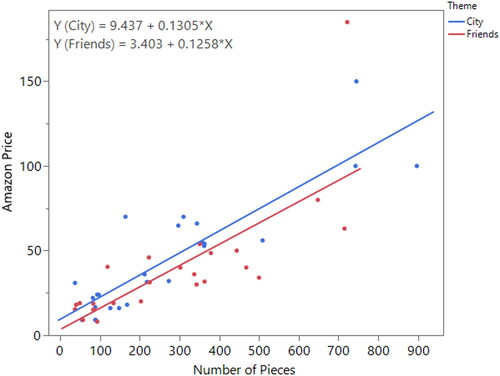
Students use a scatterplot similar to to discuss the differences and similarities between the two themes. They find that the LEGO City sets tend to cost more, on average, than LEGO Friends sets for sets with similar number of pieces; however, the estimated slopes for the number of pieces are very similar for each theme. The scatterplot allows students to provide an answer to the second research question based on descriptive statistics only.
At this point in the activity, students use their knowledge of simple linear regression to explore the second learning outcome, to develop an additive multiple linear regression model. Using a graph with similar slopes is ideal here because students start with a simple linear regression line and visually move it up or down by a constant to account for the different y-intercepts. Students then interpret a hypothetical model assuming the two estimated lines have the same slope of 0.13 but differing y-intercepts of 9.44 and 3.40 for the City and Friends sets, respectively. Students quantify the difference in the y-intercepts and speculate what this difference tells us. The example responses are direct quotes from student groups. They are not necessarily model answers.
Example Student Group Responses:
“9.44-3.40 = $6.04. If there is the same # of pieces in each theme, then we can expect the city theme to cost $6.04 higher than Lego friends.”
“It tells you that Lego City sets cost more for the same number of pieces than a Lego Friends set. The difference is 9.44 – 3.40 = $6.04.”
“Since the y-intercept for
(9.44) is higher than the y-intercept for
*The dataset is regularly updated to include more recent years. Therefore, values were adjusted from the student group responses to be consistent with the values from the dataset presented in this article.
Helpful Hint: Many students struggle to explain the meaning of the difference in y-intercepts. Try not to directly answer their questions, but rather guide them in the correct direction. Students work in groups to help them with their struggles; encourage students to interact and discuss with other groups close to them when they are stuck.
The next part of the activity introduces students to another new idea, indicator variable coding. Students read a short description about coding a categorical variable and see a new variable called “Theme 2.” Theme 2 is coded as 1 for LEGO City sets and as 0 for LEGO Friends sets. While we see benefits in having students explore their own variable coding, it is challenging for many students to extend to multiple linear regression when they choose other coding schemes, such as 1 and 2.
After students learn about indicator variables, they work through one of the most important tasks in the activity: combining the two estimated models. Students are guided to start with the estimated equation for the Friends set and consider how to add terms to the existing equation so that the equation can generalize to both estimated models for the Friends and City sets.
Example Student Group Responses:
“
“
*The dataset is regularly updated to include more recent years. Therefore, values were adjusted from the student group responses to be consistent with the values from the dataset presented in this article.
Potential Pitfall: Many, if not all, groups of students will ask you about this task. Some will get frustrated. Do not provide the answer. Remember, one of the purposes of this activity is to have students make their first attempt at extending ideas from simple linear regression to a model that includes two explanatory variables. We want students to do the exploring and discovering.
Helpful Hint: If students ask about this task and you see they have not written anything down, remind them the problem statement tells them to start with the model for Friends sets, so encourage them to write out the model on paper. Then, point them to the part of the statement that says “add your difference in y-intercepts that is conditional on the theme using the coding scheme.” If they continue to be confused, ask them to think about it more, discuss it, and tell them if they are still confused after more discussion, then you can come over and help again. In our experience, we found students were able to figure it out after more discussion.
It is not reasonable to expect students to have a formal statistical equation since they likely have never seen a multiple linear regression equation before. For example, some students write out the Friends model and then write out in words “add 6.04 if the set is City.” We recommend not giving them the standard format of the equation at this point in the activity. Consider discussing the standard form of the equation either at the end of the activity or in a future lecture.
After students create their estimated multiple linear regression model by hand, they use technology to create an estimated multiple linear regression model (). The values of the coefficients for the multiple linear regression model created using the hypothetical simple linear regression models are somewhat different from the coefficients for the estimated multiple linear regression model found using technology. We explain to students that the multiple linear regression coefficients found by hand and those estimated using technology are interpreted in the same way. Students find the estimated coefficient for the theme and describe what the coefficient represents. This is challenging for students; however, many are able to figure this out based on their previous work.
Fig. 3 Multiple linear regressions prediction expression output for additive model.
Example Student Group Responses:
“If the theme is city, Theme 2 = 1 so the price will be $7.32 more than if the theme is friends because their Theme 2 = 0.”
“The difference in average cost between city and friends, City – Friends (City is more).”
*The dataset is regularly updated to include more recent years. Therefore, values were adjusted from the student group responses to be consistent with the values from the dataset presented in this article.
Helpful Hint: If students ask you about this task, then refer them back to their first estimated model and ask them where their number came from.
3.5 Developing a Multiple Linear Regression Model with an Interaction (Answering Research Question 3)
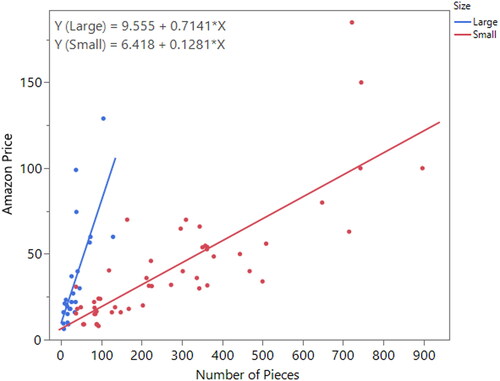
After building an understanding of additive multiple linear regression models, students examine the third learning outcome: to develop a multiple linear regression model with an interaction term. In the activity, students explore the relationship between the Amazon price and the number of pieces per set for two sizes of LEGO bricks, small and large. Recall LEGO City sets and LEGO Friends sets have small bricks and LEGO Duplo sets have large bricks. Students run a similar analysis as they did earlier with LEGO City versus LEGO Friends, but now compare small with large brick sets.
As before, students start building a scatterplot and add simple linear regression lines. They find LEGO sets with large bricks tend to cost more per piece, on average, than LEGO sets with small bricks. In this case, the slopes of the price per piece for the two sizes of LEGO bricks are clearly different (see ). Students determine whether it would be appropriate to fit the same type of model as the previous example, which compares LEGO City and LEGO Friends. It is wonderful to see that just about all of the student groups determine it is not appropriate because the slopes of the lines are too different.
Fig. 4 Scatterplot displaying the relationship between the Amazon price and the number of pieces for small and large brick sets.
After realizing a new method is needed, students are told to create a new variable, Size 2, by coding sets with small bricks as 0 and sets with large bricks as 1. Then they follow the instructions on how to use technology to fit a model that allows the slopes for the number of pieces to differ for small and large bricks (see ). Students do not hear the term “interaction” in this activity; they learn the formal language in a later lecture.
Fig. 5 Multiple linear regressions prediction expression output for model with interaction.
Helpful Hint: It is helpful to use a technology that will show the estimated regression model in equation form rather than a list of the coefficients in a table. Since this activity is an informal introduction to multiple linear regressions, students have not seen how to put the numbers into a formal equation for multiple linear regressions, so it is helpful to have the software do this for them.
Next, we want students to discover what the coefficients represent in this new model. To start this discovery they simplify the estimated model for sets with small bricks and for sets with large bricks. It is important to tell students to show all of their work (e.g., showing the 0’s and 1’s in the equation) for them to discover the purpose of the coefficients. Students consider the estimated coefficient for the size variable in the unsimplified model and describe the purpose of this number. Students are also encouraged to reference the computations they use when simplifying the model. Next, we ask students to consider the estimated coefficient for the interaction term and describe the purpose of its value by referencing their computations in simplifying the model. We notice a majority of students are able to describe the purpose of these coefficients. Students generally make a correct prediction using this model with no further guidance. Incorporating their discoveries, students answer the last research question: Does the relationship between the Amazon price and the number of pieces differ between small and large bricks in our sample?
Example Student Group Responses: When asked to describe the purpose of the coefficient of the Size variable:
“When the number pieces equals to 0, the predicted sale price for “Large” is 3.14 dollars higher than that for “small.””
“slope = 3.137. The purpose is to describe the difference between the y-intercepts of large and small bricks.”
Example Student Group Responses: When asked to describe the purpose of the coefficient of the interaction:
“To change the slope for number of pieces”
“The slope for (Pieces)(Size 2) changes the slope for number of Pieces when size 2 is 1, which means the Larger bricks.”
“slope = 0.586. The purpose is to describe the difference in slopes between large and small bricks.”
*The dataset is regularly updated to include more recent years. Therefore, values were adjusted from the student group responses to be consistent with the values from the dataset presented in this article.
3.6 Activity in a Virtual Environment
In fall 2020, we administered this activity in a remote, virtual environment. Student groups worked synchronously in breakout rooms within a virtual meeting and took turns typing answers into a shareable text document (e.g., Google Doc). The instructor visited the breakout rooms to answer questions and a graduate student monitored the shareable text documents to provide live feedback. We found multiple student group responses from the remote class demonstrated deep understanding (see ). Although we anticipated students would struggle to complete the activity remotely, we found that a majority of submissions were very similar in both the in-person and virtual environments.
Table 2 Example responses from a virtual implementation of the activity.
3.7 Overall Experience and Benefits
In general, students appeared to enjoy and appreciate the activity. Students were animated and very vocal in their discussions. A few verbal comments were noted when the instructor was walking around the room. When one group started examining the scatterplot with simple linear regression lines that were not parallel, one student said, “Wow, this is going to be like real statistics!” At the end of the activity, one student said “It was kind of a neat lab” and another said, “This is a really well written lab, especially the last three questions.” The last three “questions” the student was referring to asked them to simplify their estimated interaction model for the small and large brick sets. Based on these anecdotal interactions, we concluded that students not only liked the LEGO context of the activity, but also enjoyed learning about statistics through this activity.
For our students, this activity provided a good foundation for future assignments. Students referenced this activity when completing other assignments and many students gave good slope interpretations in different contexts later in the semester. However, we are unable to determine if the activity produced a difference in understanding due to the limited number of classes that completed the activity, the lack of a control group, and the observational nature of our study.
4 Extensions
The main purpose of our activity is to provide an intuitive introduction to multiple linear regression by allowing students to focus on descriptive statistics. Therefore, we do not include any checks for the model assumptions or conduct inference during this introductory activity. We recommend several additional directions or extensions for the LEGO dataset. Instructors can choose two or more themes from the population and take a different random sample for each student group. Students can choose two or more explanatory variables from their dataset. For example, one group of students may choose the number of pages in the instruction manual, the number of unique pieces in the set, and the theme to predict the price recommended by LEGO. Each group of students can fit a multiple linear regression model including interactions, proceed to check the model assumptions, and conduct statistical inference. Students can also discuss practical significance.
Later in the course, student groups can use their random sample described above and convert the response variable to be the price per piece rather than the price per set. Students can create side-by-side box plots grouped by the theme of LEGO sets and analyze as a one-way ANOVA model. We recommend creating an activity aimed at investigating multiple comparisons to determine how different, on average, the price per piece is depending on the theme. An ANOVA model with these data produces an application for the use of a contrast analysis for a test of the differences in mean prices based on the theme of the set.
We suggest students repeat what they learned after the activity by going into more detail by completing a project. Students can consider other blogs that compared different themes. For example, Jon Orr (Citation2015) wrote a blog post comparing LEGO Friends sets to LEGO Star Wars sets. Using the themes presented in the blog post, students take a random sample of the sets with predetermined themes from the population, run their own analysis on the relationships, and present the results as a final paper or presentation. Each project will be different because each group of students ideally has a different subset of themes. We recommend students explain their sampling process before proceeding. Additional variables can also be considered (i.e., the age range recommendations, the number of pages in the instruction manuals, or the number of years since the set was first released). Students can also investigate different measures of complexity, such as the number of unique pieces. Last, students can use more than two explanatory variables to explore different model selection techniques and check for indicators of multicollinearity.
A different approach is to create a project not restricting students to compare the LEGO set themes. For example, students can compare LEGO and Mega Bloks. An article claims that Mega Bloks are the cheaper alternative to LEGO (Joffe-Walt Citation2012) when, in fact, we see numerical evidence to suggest Mega Bloks are more expensive, on average, after accounting for the number of pieces. We like this direction for creating different (yet similar) class projects that are guided but provide a feasible way to allow students to go through the entire investigative process. This project approach allows students to start at the initial planning phase, then collect, graph, and analyze the data, and lastly present the results.
Finally, we suggest using this activity as motivation for students to collect data on other consumer products in an attempt to support or counter various media/blog claims. Students determine what data they want to collect to verify or counter the claim. Students can reflect on how or where to obtain these data, develop a data collection strategy, implement their data collection, and analyze if applicable.
5 Conclusions
The LEGO dataset offers several variables for a variety of analyses. In our experience, students enjoy the LEGO context. Since many students have experience playing with LEGO bricks as children or have knowledge of LEGO bricks, there is limited cognitive load related to the nonstatistical content. Their prior knowledge of LEGO sets helps students focus on the development of a more complex statistical model. Overall, we see high student engagement during this activity. Our anecdotal impressions are positive. Many students successfully use their intuitions to build their multivariate models. Students understand the need for including an interaction term in the model when the slopes were visually different between sizes of LEGO bricks. In subsequent lectures, we found it easier to motivate the use of two quantitative explanatory variables in multiple linear regressions and further straightforward to discuss what the coefficients represent.
Disclaimers: LEGO[textregistered] is a trademark of the LEGO Group of companies, which does not sponsor, authorize, or endorse this article. Amazon is a trademark of the Amazon Services LLC, which does not sponsor, authorize, or endorse this article.
Supplemental Material
Download Zip (412 KB)Acknowledgments
We thank our students for their participation in the LEGO activity and for giving us permission to share their responses. We also thank to Ann Brearley, Philip Dixon, Jackie Herman, Laura Le, Bob Stephenson, Frank Ziegler, the anonymous reviewers, and editors who spent time providing thoughtful feedback that helped us greatly improve this article.
Supplemental Material
Activity- Exploring Multiple Regression-JMP.pdf and Activity-Exploring Multiple Regression-R Shiny.pdf contain the activity that is described in this article. The first provides instructions for students on how to complete the activity using JMP and the second provides instructions for students on how to complete the activity using an R Shiny App. LEGO Shiny App Code.R includes the R code used to create the R Shiny App used in the activity created for students. Lego.population.csv includes the population of data and Lego.sample.csv includes the sample of data used for the activity. Documentation-Codebook.pdf includes a short description of these datasets along with a list of the variables with their definitions. LEGO Data Scraping Code.R includes the R code used to scrape the LEGO data from Brickset (Brickset, n.d.) and BrickInstructions.com (n.d.).
References
- Allain, R. (2014, August 4), “How Much Does One Lego Piece Cost?” [Blog post]. Available at https://www.wired.com/2014/08/lego-cost/
- Baichtal, J., and Meno, J. (2011), The Cult of LEGO. San Francisco, CA: No Starch Press.
- BrickInstructions.com. (n.d.), Available at https://lego.brickinstructions.com/, https://perma.cc/5BGJ-WC7G
- Brickset. (n.d.), BRICKSET: Your LEGO[textregistered] set guide. Available at https://brickset.com/, https://perma.cc/5K75-X2N4
- Cannon, A. R., Cobb, G. W., Hartlaub, B. A., Legler, J. M., Lock, R. H., Moore, T.L., and Witmer, J.A. (2013), STAT2: Building Models for a World of Data, New York: W. H. Freeman and Company.
- Chang, W., Cheng, J. Allaire, J., Xie, Y., and McPherson, J. (2020), Shiny: Web Application Framework for R. R package version 1.5.0. Available at http://CRAN.R-project.org/package=shiny
- Feedspot. (2020), Top 75 Lego Blogs & Websites for Lego Fans in 2020: Lego Blog. Available at https://blog.feedspot.com/lego_blogs/
- GAISE College Report. (2016), ASA Revision Committee. “Guidelines for Assessment and Instruction in Statistics Education College Report 2016.” Available at http://www.amstat.org/education/gaise
- Garfield, J. (1995), “How Students Learn Statistics,” International Statistical Review, 63, 25–34. DOI: https://doi.org/10.2307/1403775.
- JMP®. (1989–2019), Version 13.2.1. Cary, NC: SAS Institute Inc.
- Joffe-Walt, C. (2012), “Why Legos Are So Expensive-and So Popular.” NPR. Available at https://www.npr.org
- Kross, S. (2015), Lego, v4.1.1. Available at https://github.com/seankross/lego
- LEGO. (n.d.), How We Decide the Prices of LEGO[textregistered] Sets. Available at https://www.lego.com/en-us/service/help/products/themes-sets/how-we-decide-the-prices-of-lego-sets-408100000008322, https://perma.cc/R2U8-CGJL
- Millington, H. (2018), Digging Deeper into the Database. Available at https://brickset.com/article/37956/digging-deeper-into-the-database
- Momsla. (2012), “Why My Daughters Won’t be Playing With LEGO Friends” [Blog post]. Available at https://momsla.com/why-my-daughters-wont-be-playing-with-lego-friends/
- Moore, D. S., McCabe, G. P., Alwan, L. C., and Craig, B. A. (2015), The Practice of Statistics for Business and Economics (4th ed.), New York: W. H. Freeman.
- Orr, J. (2015), “Is Lego Gender Biased?” [Blog Post]. http://mrorr-isageek.com/is-lego-gender-biased/
- Pickett, D. (2012), “Thinking Brickly” [Blog post]. Available at http://thinkingbrickly.blogspot.com/2012/12/why-lego-friends-is-not-worst-toy-of.html
- R Core Team. (2018), R: A Language and Environment for Statistical Computing, Vienna, Austria: R Foundation for Statistical Computing. Available at https://www.R-project.org/.
- Wickham, H. (2007), Reshape2: Reshaping Data with the {reshape}Package. R package version 1.4.4. Available at http://www.jstatsoft.org/v21/i12/
- Wickham, H. (2016). ggplot2: Elegant Graphics for Data Analysis, New York: Springer-Verlag. Available at https://ggplot2.tidyverse.org
- Wickham, H. (2019). stringr: Simple, Consistent Wrappers for Common String Operations. R package version 1.4.0. Available at https://CRAN.R-project.org/package=stringr
- Wickham, H. (2020). rvest: Easily Harvest (Scrape) Web Pages. R package version 0.3.6. Available at https://CRAN.R-project.org/package=rvest
- Wickham, H., François, R., Henry, L., and Müller, K. (2020). dplyr: A Grammar of Data Manipulation. R package version 1.0.2. Available at https://CRAN.R-project.org/package=dplyr