 ?Mathematical formulae have been encoded as MathML and are displayed in this HTML version using MathJax in order to improve their display. Uncheck the box to turn MathJax off. This feature requires Javascript. Click on a formula to zoom.
ABSTRACT
Many statistics education researchers have found that statistics students’ attitudes tend to decrease over the duration of a course. Although many researchers have tried to incorporate a variety of activities and/or teaching methods to improve student attitudes, many are not only very time consuming to implement, but have also not shown many favorable results. In the study presented here, the inclusion of a low-stakes and easy-to-implement assignment and its effect on student attitudes is investigated. Although the results presented here did not show large changes, they suggest that some changes in students’ attitudes can be made with a small change in a course.
1 Introduction
According to Ramirez, Schau, and Emmioğlu (Citation2012), “Positive attitudes keep us using what we have learned. They also encourage us to seek opportunities to learn more” (p. 67). There has been a great deal of research on student attitudes that confirms what many statistics instructors already thought—students have relatively negative attitudes toward statistics (Evans Citation2007; Bond, Perkins, and Ramirez Citation2012; Schau and Emmioğlu Citation2012). There have been numerous research studies conducted that compare students’ attitudes across delivery methods (e.g., Gundlach et al. Citation2015) or disciplines (e.g., Griffith et al. (Citation2012)). In addition, others are measuring how the students’ attitudes compare when implementing new activities (e.g., Carnell Citation2008) or teaching techniques (e.g., Carlson and Winquist Citation2011; Huynh, Baglin, and Bedford Citation2014).
However, quite often the delivery method, activity, and/or technique being implemented or revamped involves a substantial commitment for the instructor. As many instructors are quite stretched for time or intimidated by the task of making such a change, it would be desirable to have an easy to implement activity that an instructor could incorporate in their course that could also lead to some desirable changes in students’ attitudes toward statistics.
Both the GAISE College Report (2016) and the ASA Guidelines (2014) discussed the importance of context and the use of real data in an introductory statistics course. More specifically, the GAISE College Report (2016) stated: “Using real data in context is crucial in teaching and learning statistics, both to give students experience with analyzing genuine data and to illustrate the usefulness and fascination of our discipline.” The goal of this research study was to see if by making a cognizant effort to do just that, it could result in more favorable changes in students’ attitudes? Could we help students see the applications of statistics in their everyday lives? Thus, it was decided to implement a “Question of the Week” that was designed to help students make real-world connections to the material they were learning without instructors having to overhaul the course.
2 Literature Review
Investigating the students’ attitudes toward statistics has been the main focus in many research studies. In addition, the recommendation of using real data (and thus, real-life scenarios) given by both the GAISE College Report (2016) and ASA Guidelines (2014) were not new. Many researchers have also investigated ways of following this recommendation and measuring the impact those changes have had on students.
2.1 Research on the Students’ Attitudes in General
Past research has stressed the need to investigate students’ attitudes in statistics as well as what influences these attitudes. Gal and Ginsberg (Citation1994) emphasized the need to assess student attitudes as they are likely related to their perceived difficulty of the subject. In addition, they asked what confounding factors, such as major or math anxiety level, are at work behind the attitude assessments used at the time. Evans (Citation2007) found that although they were unable to detect any statistically significant changes in attitudes (using the Student Attitudes and Conceptions in Statistics (STACS) instrument) over the duration of the course, they found that students who took their statistics class through the sociology department had more favorable attitudes than the students who took their classes through the mathematics or psychology departments. However, regardless of the department the class was offered from, there was a common theme: Students would not have taken a statistics course if it had not been required nor were they interested in taking any more statistics courses. Huynh, Baglin, and Bedford (Citation2014) discovered that students found mathematics and statistics unenjoyable to learn so they wanted to determine what could be done to improve their attitudes towards the subject. On the other hand, Dempster and McCorry’s (Citation2009) research on a statistics sequence in the psychology department found that the students’ attitudes have a stronger association with course assessments than with the previous statistics exposure.
2.2 Research on Activities to Improve Student Attitudes
Many statistics instructors have incorporated activities into their course with the hopes of improving the students’ attitudes toward statistics. Alldredge, Johnson, and Sanchez (Citation2006) incorporated five minute videos showing real-world applications of statistics at the beginning of each laboratory session, and asked the students to answer the following questions for informational purposes only (that is, the student responses were not graded): (i) “What were some of the main concepts presented in the video you viewed today?” and (ii) “Which of these are most meaningful to you? Why? (p. 2)” In addition to answering the two questions after each video, students were asked to complete a questionnaire (pre- and post-) to assess the students’ attitudes towards statistics; this was based on Schau’s (Citation2003) Survey of Attitudes Towards Statistics (SATS) with a few additional questions. These researchers did not find any statistically significant differences between the experimental and control sections of the laboratory in terms of the students’ “positive feelings concerning statistics.”
Other researchers have tried implementing activities such as a student-designed data collection project (Carnell Citation2008), the incorporation of small group sessions in addition to a lecture (Olani, Hoekstra, Harskamp and van der Werf 2010), multimedia lectures (Hilton and Christensen Citation2002), and a jigsaw classroom approach (Perkins and Saris Citation2001) to name a few; none of these approaches produced a statistically significant change in the students’ attitudes (favorably or unfavorably).
Although Carnell (Citation2008) did not find any statistically significant differences in the students’ attitudes between the control and experimental groups, both groups saw a decrease in the students’ interest towards statistics. Similarly, Gundlach et al. (Citation2015) found a decrease in the students’ interest and value towards statistics when investigating the students’ attitudes between flipped, traditional, and web-augmented courses.
There have been some research studies which resulted in the improvement of the students’ attitudes in statistics. Berk and Nanda (Citation1998) used the Bad Attitude Towards Statistics (BATS) instrument, created by the researchers, to assess the students’ attitudes in a study that looked at a teaching method which successfully utilized humor to “improve attitudes, reduce anxiety, and increase achievement in introductory undergraduate and graduate statistics courses. (pg. 1)” Carlson and Winquist (Citation2011) incorporated a workbook approach into the classroom; “students were to read content before and during class, and then work in groups to complete problems and answer conceptual questions pertaining to the material read. (p. 1)” Carlson & Winquist found that this approach had a positive impact on the students’ attitudes in terms of cognitive competence, affect, and difficulty.
2.3 Research on Real-World Connections
Due to the importance of making statistics seem applicable to the students’ lives and not just an abstract area of mathematics, many instructors try to use real-world scenarios or when possible, real data in their course. The attempts at making these connections have been done in various ways. Some research was done where the real data connection was made by having students collect their own data. Carnell (Citation2008) conducted a comparison study where one section of introductory statistics had a student-designed project and another section did not. Carnell measured student attitudes using the SATS-36 and found no statistically significant differences between the two sections of the courses for any of the six attitude components. In addition, when only investigating attitude changes for the section that completed the student-designed project, it was found that the change of the Interest component was significantly negative; meaning, that even with the inclusion of the project, the student’s interest in statistics went down over the duration of the course. Huynh, Baglin, and Bedford (Citation2014) examined how students’ attitudes changed after the implementation of an activity using The Island for ninth- and tenth-grade students. They used their own instrument which included some questions about attitudes. The results showed some positive changes in mean attitudes on the two questions that measured a student’s interest in statistics as well as a positive change in mean attitude about the importance of statistics in their everyday lives. Although this seems promising, this difference was measured right before and after the activity. Just as many instructors have experienced, activities may seem to have an impact that day, but may not show a long-term impact on the students or their learning. In addition, this was for ninth- and tenth-grade students, not college-level.
Other research looked at measuring how using real data affects the student. Neumann, Hood, and Neumann (Citation2013) interviewed students in the first-year university statistics course to investigate how the use of the real data impacted them. They found some themes that included real-life relevance, interest, motivation, and engagement. Alldredge, Johnson, and Sanchez (Citation2006) investigated how video clips given prior to a statistics lab session impacted attitudes. However, part of the questions that were asked of these students was which video clips shown were most meaningful to them and why, but these results were not provided.
As shown in the above examples, many approaches have been implemented with the hopes of impacting students’ attitudes in an introductory statistics course, hopefully for the better. Some of these approaches were successful in positively impacting the students’ attitudes; however, it appears either no change or a negative change in attitudes is more typical.
3 Study Design
Getting students interested in learning statistics and appreciating the discipline’s value is a challenging task, especially in an introductory statistics course. The researchers’ goal was to increase real-world applications of the material taught in class to aid students in forming stronger connections with statistics to their everyday lives. In addition, the researchers would like to do this with minimal change to an already existing introductory course to allow for easy implementation. Thus, the idea came to the researchers of having students answer a “Question of the Week” (QOW) for each week in the course. These questions would be specifically designed to spark some interest in the course or to spotlight its value in their lives.
3.1 Participants
Students at the authors’ universities took part in this research. Both of the universities are public and primarily four-year undergraduate institutions with enrollments between 7000 and 12,000 undergraduate students. However, one campus is more of a residential campus whereas the other has a greater commuter student population. Each course in which this research was implemented was an algebra-based introductory statistics course with primarily traditional inference methods, such as t-tests.
3.2 Question of the Week
The QOW was intended for students to encounter a real-world application related to the content being covered in the course or to understand how statistics may be used in practice. Students were given the question at the beginning of the week and were given until the end of that week to complete it. In order to get reasonable responses without a large grading burden, the QOWs were graded on the basis of both accuracy and effort using a 0, 1, and 2 scale. For students who were in a QOW section, these assignments had about a 5%–10% weight in their final grade. However, both the QOW and control sections had very similar weights assigned to class exams.
Determining how to develop questions that would either specifically tie to course content or have students see why statistics may be useful is already challenging due to the course being taken by a variety of majors. Conducting this research at different universities imposed additional challenges including different course objectives as well as a different ordering of topics presented in an introductory statistics course. Common questions were developed to be used at both universities although the timing of the questions were sometimes different due to what content was being covered during the given week. Described below are a few examples of questions that were given, as well as why they were chosen.
Question 1: “Home births give babies a good chance” was a headline in the NZ Herald in 1990. The article then went on to report that babies are twice as likely to die during or sooner after a hospital delivery, than those from a home birth. The report was based on a simple random sample of home births and hospital births. Does this mean hospitals are dangerous places to have babies in Australia?
Define the population of interest.
Define the variables of interest.
Does this mean hospitals are dangerous places to have babies in Australia? Explain.
Some things you might want to consider when answering this question are:
Why would someone want to deliver at home?
Why would someone want to deliver at the hospital?
What are the reasons someone might change their mind in where they want to deliver their child?
Goal/Reasoning: In many introductory statistics classes, an instructor has to take time to cover basic statistical definitions, which helps to lay a foundation for future understanding of inference. This question is asked generally quite early in the semester when definitions are covered, but also attempts to stretch the student to think about what the results do or do not mean.
Question 2: Rate My Professor - Suppose you are interested in learning about various professors on campus and decide to visit www.ratemyprofessor.com. If you’ve never visited this website, then please do so now.
Answer the following questions:
Who has the opportunity to post on this website?
What types of people do you think choose to post on this website?
Discuss the pros and cons of using this information to make your decision about what class(es) to take.
For those that have utilized this information when choosing classes, how accurate was the information given?
Goal/Reasoning: One large concept usually addressed in an introductory statistics course is about getting accurate and reliable data. However, quite often instructors don’t get to spend much time on this topic due to the large number of course objectives they need to get through. By having students think through an example of quite biased information they may be using to make decisions, the hope is to help students bring home the idea of why random sampling is such an important aspect in any data collection.
Question 3: Skittles replaced lime with green apple. What steps do you think were involved in making the decision to do this?
Things to think about when answering this question:
What would make them choose to get rid of lime?
How do you think they determined the replacement flavor (for example, why not watermelon or kiwi?)?
How would they go about collecting accurate consumer preference data?
How would they determine if replacing lime was an appropriate decision?
What may happen if they (the Skittles Company) were to make the wrong decision?
Your answer to this question should be at least 2 paragraphs in length.
Goal/Reasoning: In the authors’ experiences, a fair number of students who take introductory statistics are business majors. This question allows these students to see how statistics might be used to make a business decision. Additionally, students might not think that statistical thinking or the statistics process could be used to answer such a question. This question gets at the beginning stages of the research process.
Question 4: Suppose you work for Adidas and have just developed a new type of running shoe. You conduct a pilot study to determine whether runners are satisfied with the product. To do this you find a random sample of runners and send them a free pair of shoes to try out for a month and give feedback on. One of the overall questions is how satisfied are you with this running shoe (1 very dissatisfied, 2
dissatisfied, 3
satisfied, 4 very satisfied).
If we were to calculate the percentage of customers who were satisfied (or very satisfied), how high would you want this number (percentage: 0%–100%) to be to feel comfortable with putting this shoe on the market? Justify your choice.
Suppose that we found enough of the respondents were satisfied with the product to decide to market this shoe.
If we committed an error in this situation, would it have been a Type I or Type II error? Explain.
Describe what this type of error means in the context of the problem (Adidas running shoes)
What chain of events (i.e., consequences) could happen if this error was committed? Fully explain.
Goal/Reasoning: When a student first learns about hypothesis testing, the entire procedure presented can be a bit overwhelming. Many students equate statistics with mathematics and believe that one should be 100% certain of the result that they get. As this is not the case in statistics, students need to grapple with the uncertainty involved in the decision-making process. This question helps students to investigate the idea of Type I and Type II errors in an application setting.
Question 5: Suppose that you are looking to open a restaurant in one of two locations (that are similar in size and makeup). How would you determine which location to choose? Please provide a detailed response to this question.
You may want to think about the following:
What would attract you to a restaurant?
What would deter you from a restaurant?
What possible factors could impact the success of a restaurant?
What means could you use to assess the success of a restaurant in a given location?
Use your answer to devise a plan to help the restaurant choose a location.
Goal/Reasoning: This question is one that is asked near the end of the semester. The goal of this question was to get students to think through the entire statistical process—what data are needed, data collection, …, all the way through the decision process.
3.3 Instrument
The Survey of Attitudes Towards Statistics (SATS) (Schau Citation2003) is a tool that can be used to assess students’ attitudes in an introductory statistics course. Although there are two versions of the instrument (SATS-28 and SATS-36), the SATS-36 is commonly used in practice. The instrument consists of a set of Likert scale questions where 1 “strongly disagree” and 7
“strongly agree.” Additionally, negatively worded items need to be reversing coded before scoring. Historically, the SATS-36 is given as a pre- and post-assessment at the beginning and the end of the semester to assess the following six constructs:
Affect—a measure of the students’ positive and negative feelings concerning statistics
Cognitive Competence—a measure of the students’ attitudes about their intellectual knowledge and skills when applied to statistics
Value—a measure of the students’ attitudes about the usefulness, relevance, and worth of statistics in their personal and professional life
Difficulty—a measure of the students’ attitudes about the difficulty of statistics as a subject
Interest—a measure of the students’ level of individual interest in statistics
Effort—a measure of the amount of work the student expends to learn statistics
When investigating results of the SATS, generally the mean score for each component is calculated for each student.
In their 2012 articler, Schau and Emmioğlu reported that the mean attitude scores for Affect, Cognitive Competence and Difficulty slightly increased over the course of the semester, while Value, Interest and Effort had large decreases (p. 91).
3.4 Methods
In order to assess if the QOW has a favorable impact on student attitudes, this study included both experimental (requiring the QOW) and control (did not require QOW) groups. Since the researchers were often teaching only one introductory statistics section a semester, more sections ended up being in the QOW group. When more than one section was being taught, some sections were randomly chosen to be control sections. The average class size was roughly 35 students. All students whose data was used in the results gave consent as required by the approved IRB protocols (about 95% of students gave their consent).
For both the QOW and control groups, the SATS-36 was administered online using the Qualtrics survey platform (Qualtrics, Provo, UT) during the first week (after the first day) and last week (before the final exam) of the semester. Each administration was a required class assignment and graded on completion only; that is, if a student completed the administration, full credit was given. In order to be included as part of the results, a student must have completed both the pre- and post-test as well as given consent for their data to be used.
Most analyses of SATS data compare the mean change in component scores between the pre- and post-test. Although the interest here lies in comparing the mean change for students who completed the QOW to those who did not, students were not randomly assigned to the sections. Therefore, the section, and not the student, is the inferential experimental unit, and due to the small number of sections offered, a descriptive analysis of the mean difference in SATS components scores will be conducted. The pre- and post-test means will be reported, in addition to their difference. Additionally, a visual representation of the data will be discussed.
4 Results
The way that SATS results are commonly investigated is through a comparison of mean component scores. These will be the first results investigated for both the QOW and control groups. The results can be found in :
Table 1 Comparison of mean attitude changes.
When looking at the pre-test SATS results, the first interesting thing to note is that the mean score is noticeably higher for the control group in the affect, cognitive competence, value, and interest components, while the means for difficulty and effort are quite comparable. Looking back at some demographics of the students, there does not appear to be any obvious explanations for this as both the QOW and control groups had similar breakdowns of majors, class standings, sex, and semester of enrollment.
Generally, the primary interest when looking at SATS results is the change in component scores from the pre- to the post-test. This change (post- pre) can be found in the last column of . Due to the order of subtraction, a positive change in scores would be most desirable. What should be noticed when looking at the results is that the mean change in scores for the QOW group is higher than that of the control group for every single component. However, the components where this difference is of greater magnitude are in affect, cognitive competence, value, and interest.
In order to get a better idea of how SATS results changed from the pre- to the post-test, side-by-side boxplots were created for each of the components. These plots can be found in :
Fig. 1 Side-by-side boxplots of differences in SATS scores by component.
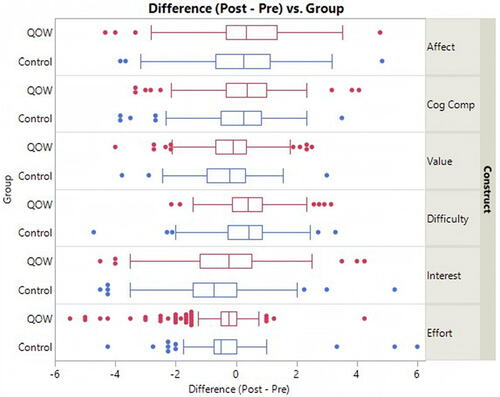
Although the medians shown in are all near zero (indicating that the attitudes didn’t change much from the beginning to the end of the semester), there is at least some evidence of an upward shift for the QOW group compared to the control group. This suggests that the difference in component scores is at least slightly better for the QOW group than for the control group.
5 Discussion
As statistics instructors well known, the students’ attitudes in an introductory course have never been all that favorable (Evans Citation2007; Bond, Perkins, and Ramirez Citation2012; Schau and Emmioğlu Citation2012). When looking at the results found in this study, negative mean changes in attitudes were found for both the QOW and control groups for value, interest, and effort. While it would be ideal to see positive mean changes in all areas, those found in the QOW group for both value and interest were noticeably closer to zero than that of the control group. Thus, although the mean changes found in these components were not positive, they were more favorable for the QOW group. The mean changes found for affect, cognitive competence, and difficulty were all in the desirable direction showing positive changes in these attitude components. However, these mean changes were closer to zero for the control group showing more support for the QOW.
Even though all the results presented were descriptive, they are still encouraging. Although the researchers had hoped the QOW group would have had an even more favorable change in attitudes than what was found, this is still promising as it indicates the QOW appeared to have some positive influence on students’ attitudes. This is in slight contrast with what Alldredge, Johnson, and Sanchez (Citation2006) found in their study, which incorporated short real-world application videos, which resulted in no statistically discernible differences in attitudes for their experimental and control groups.
6 Conclusion (future work)
6.1 Limitations
The data collected in this study was from introductory algebra-based statistics courses at two primarily undergraduate institutions in the Midwest. Although much of the literature on attitudes in a statistics course has been done with this population of students, the authors realize that the region, as well as the professor, may make a difference in the results that were obtained.
Due to class enrollments not being randomly assigned, as well as an unequal number of sections being assigned to the QOW and control groups, differences in attitudes that were found cannot be causally related to the implementation of the QOW as there could have been other factors present. However, the students did not know what course they were enrolling into (QOW or Control) which helps to alleviate much of that concern.
6.2 Implications
Many statistics educators are continually trying to improve their courses for the better. However, not only is it desired for students to better understand the material and improve their scores, it is also desired to improve the students’ attitudes about the course they are in. This is important as attitudes can play a role in the students’ future use of what they learned, as well as what they may want to learn more about (Ramirez, Schau, and Emmioğlu Citation2012). The results found here are encouraging in that a relatively small adjustment to a course could favorably impact the students’ attitudes toward statistics.
6.3 Ideas for Future Research
As the results of implementing the QOW are promising, it brings forward suggestions of future studies to conduct. First, a study should be conducted in which inferential procedures can be used to determine whether a discernable change in attitudes exists. For instance, if the student could be randomly assigned to a section of the course, one would be able to treat the student as the experimental unit. Second, one could perform the QOW at either different institutions (such as a liberal arts college or a research institution) or with different student populations (such as calculus-based introductory statistics course) to see if similar results are found. Finally, a difference in pre-test scores was observed between the control and QOW courses; one could investigate potential reasons behind this difference.
Acknowledgments
The SATS-36 for this paper was administered using Qualtrics software, version April 2015 of Qualtrics. Copyright Ⓒ 2020 Qualtrics. Qualtrics and all other Qualtrics products or service names are registered trademarks or trademarks of Qualtrics, Provo, UT, USA. Available at https://www.qualtrics.com.
References
- Bond, M., Perkins, S., and Ramirez, C. (2012), “Students’ Perceptions of Statistics: An Exploration of Attitudes, Conceptualizations, and Content Knowledge of Statistics,” Statistics Education Research Journal, 11, 6–25. DOI: https://doi.org/10.52041/serj.v11i2.325.
- Alldredge, J., Johnson, H., and Sanchez, J. (2006), “Does Viewing Video or Statistics in Action Affect Statistics Attitudes?” Proceedings of the Seventh International Conference on Teaching Statistics (ICOTS7, July 2006), Salvador, Bahia, Brazil. Voorburg, The Netherlands: International Statistics Institute. Available at https://iase-web.org/documents/papers/icots7/C335.pdf
- American Statistical Association. (2014), Curriculum Guidelines for Undergraduate Programs in Statistical Science, Washington, DC: ASA. Available at https://www.amstat.org/asa/education/Curriculum-Guidelines-for-Undergraduate-Programs-in-Statistical-Science.aspx
- American Statistical Association. (2016), Guidelines for Assessment and Instruction in Statistics Education (GAISE) College Report, Washington, DC: ASA. Available at http://www.amstat.org/education/gaise/
- Berk, R. A., and Nanda, J. P. (1998), “Effects of Jocular Instructional Methods on Attitudes, Anxiety, and Achievement in Statistics Courses,” Humor: International Journal of Humor Research, 11, 383–409.
- Carlson, K., and Winquist, J. (2011), “Evaluating and Active Learning Approach to Teaching Introductory Statistics: A Classroom Workbook Approach,” Journal of Statistics Education, 19. DOI: https://doi.org/10.1080/10691898.2011.11889596.
- Carnell, L. (2008), “The Effect of a Student-Designed Data Collection Project on Attitudes Toward Statistics,” Journal of Statistics Education, 16. DOI: https://doi.org/10.1080/10691898.2008.11889551.
- Dempster, M., and McCorry, N. (2009), “The Role of Previous Experience and Attitudes Toward Statistics in Statistics Assessment Outcomes Among Undergraduate Psychology Students,” Journal of Statistics Education, 17. DOI: https://doi.org/10.1080/10691898.2009.11889515.
- Evans, B. (2007), “Student Attitudes, Conceptions, and Achievement in Introductory Undergraduate College Statistics,” The Mathematics Educator, 17, 24–30.
- Gal, I., and Ginsberg, L. (1994), “The Role of Beliefs and Attitudes in Learning Statistics: Towards an Assessment Framework,” Journal of Statistics Education, 2. DOI: https://doi.org/10.1080/10691898.1994.11910471.
- Griffith, J., Adams, L., Gu, L., Hart, C., and Nichols-Whitehead, P. (2012), “Students’ Attitudes Toward Statistics Across the Disciplines: A Mixed-Methods Approach,” Statistics Education Research Journal, 11, 45–56. DOI: https://doi.org/10.52041/serj.v11i2.328.
- Gundlach, E., Richards, K., Nelson, D., and Levesque-Bristol, C. (2015), “A Comparison of Student Attitudes, Statistical Reasoning, Performance, and Perceptions for Web-Augmented Traditional, Fully Online, and Flipped Sections of a Statistical Literacy Class,” Journal of Statistics Education, 23. DOI: https://doi.org/10.1080/10691898.2015.11889723.
- Hilton, S., and Christensen, H. (2002), “Evaluating the Impact of Multimedia Lectures on Student Learning and Attitudes,” Proceedings of the Sixth International Conference on Teaching Statistics (ICOTS6, July 2002), Capetown, South Africa. Voorburg, The Netherlands: International Statistics Institute.
- Huynh, M., Baglin, J., and Bedford, A. (2014), “Improving the Attitudes of High School Students Towards Statistics: An Island-Based Approach,” in Sustainability in Education. Proceedings of the Ninth International Conference on Teaching Statistics (ICOTS9, July 2014), Flagstaff, AZ, USA, eds. K. Makar, B. de Sousa, & R. Gould. Voorburg, The Netherlands: International Statistics Institute.
- Neumann, D., Hood, M., and Neumann, M. (2013), “Using Real-Life Data when Teaching Statistics: Student Perceptions of this Strategy in an Introductory Statistics Course,” Statistics Education Research Journal, 12, 59–70. DOI: https://doi.org/10.52041/serj.v12i2.304.
- Olani, A., Hoekstra, R., Harskamp, E., and van der Werf, G. (2010), “Fostering Students’ Statistical Reasoning, Self-efficacy, and Attitudes: Findings From a Comprehensively Reformed Undergraduate Statistics Course,” in Data and context in statistics education: Towards as evidence-based society. Proceedings of the Eighth International Conference on Teaching Statistics (ICOTS8, July 2010), Ljublijana, Slovenia, ed. C. Reading. Voorburg, The Netherlands: International Statistics Institute. Available at https://icots.info/icots/8/cd/pdfs/contributed/ICOTS8_C142_OLANI.pdf
- Perkins, D., and Saris, R. (2001), “A “Jigsaw Classroom” Technique for Undergraduate Statistics Courses,” Teaching of Psychology, 28, 111–113.
- Ramirez, C., Schau, C., and Emmioğlu, E. (2012), “The Importance of Attitudes in Statistics Education,” Statistics Education Research Jorunal, 11(2), 57–71. [Online: https://iase-web.org/documents/SERJ/SERJ11(2)_Ramirez.pdf] DOI: https://doi.org/10.52041/serj.v11i2.329.
- Schau, C., and Emmioğlu, E. (2012), “Do Introductory Statistics Courses in the United States Improve Students’ Attitudes?” Statistics Education Research Journal, 11, 86–94. DOI: https://doi.org/10.52041/serj.v11i2.331.
- Schau, C. (2003). Survey of Attitudes Towards Statistics (SATS-36). Available at http://www.evaluationandstatistics.com