 ?Mathematical formulae have been encoded as MathML and are displayed in this HTML version using MathJax in order to improve their display. Uncheck the box to turn MathJax off. This feature requires Javascript. Click on a formula to zoom.
Abstract
This study aims to identify some perceived gaps in a selection of statistical skills and software abilities of professors of education in United States colleges and universities. In addition to a general U. S. sample, a sample of education professors in Historically Black Colleges and Universities (HBCUs) was examined in order to understand their unique needs. Results showed that many professors from both samples felt they were weak in their abilities with more advanced statistical methods such as structural equation modeling and propensity score matching. Professors of education at HBCUs, however, had significant perceived skill-need methodology gaps in most of the methodologies evaluated. The general U.S. sample indicated a skill-need gap with statistical software packages such as R, and the HBCU sample indicated a skill-need gap with all five software packages evaluated (Excel, SPSS, SAS, Stata, and R). Affordable training workshops addressing the greatest areas of perceived need should be helpful in reducing this skill-need gap.
We live in a world that values quantitative evidence, and the field of education is no exception. Clearly, high quality evidence is required for the system to justifiably place confidence in that evidence. In fact, a Canadian research study found that opinions by administrators about the quality and accessibility of educational research was the biggest predictor of the use of research in their practice (Lysenko et al. Citation2014). Increasing the quality, and thereby the reputation, of educational research, is a possible means of reducing the research-practice divide.
Much of educational research is quantitative in nature. For quantitative studies, the appropriate use of statistical methods is essential for achieving trustworthy results and conclusions. However, educational researchers are often considered weak quantitatively, and this reputation can lead to a poor image of educational research (Gorard, Rushforth, and Taylor Citation2004). Moreover, poor self-efficacy regarding research skills has predicted decreased publication output (Pasupathy and Siwatu Citation2014; Hemmings and Kay Citation2016). Poor statistical skills of educational researchers have been linked to poor statistical education of graduate students, including those preparing to become faculty members themselves (Harwell Citation2001). It is possible that any weaknesses in the statistical abilities of faculty of education can have a damaging impact for a long period in the future.
Not all educational research is quantitative in nature; many use qualitative approaches. However, Labaree (Citation2011) suggested educational researchers have been “seduced” by quantitative methods in an attempt to make the profession appear stronger. As long as quantitative methods are used in educational research, quality in the use of those methods can be assumed to be important.
Variability in Statistical Skills
One possible reason for the variability of skills of professors of education is that the amount of statistical training required of education doctor of philosophy students varies dramatically. Among the top five education schools, as rated by U.S. News & World Report (Citation2016), statistics course requirements varied from two to five (Harvard University Citation2016; Johns Hopkins School of Education Citation2016; Peabody College Citation2016; Stanford University Citation2017; University of Wisconsin-Madison Citation2017). Among HBCUs, several sources each list four universities with PhDs with the name “education” in the degree title (Salandy Citation2012; Virginia Tech Citation2018). As Ph.D. preparation is preferred training for future faculty members, the research methods coursework required within these four Ph.D. programs was examined; this coursework was found to vary from three to five courses (Alabama A&M University Citation2017; Jackson State University Citation2017; Prairie View A&M University Citation2017; Morgan State University Citation2018). There is great variability in the required statistical training of Ph.D. students and, hence, likely of education faculty.
Little research has been done on the statistical methods used in recent educational research publications. However, one literature review found that in a review of 697 articles published on gifted education from 2006 to 2010, the greatest proportion used basic statistics such as means (84%), t-tests (29%), Pearson’s r (50%), ANOVA (29%), or multiple regression (11%). Each of the following intermediate or advanced methods were used in less than 10% of the studies: hierarchical linear modeling, logistic regression, exploratory factor analysis, principal components analysis, path analysis, confirmatory factor analysis, structural equation modeling (Warne et al. Citation2012). This gifted education-related study suggests that either the questions asked by educational researchers only require simpler methods or researchers do not have adequate training to use more advanced methods. While there do not appear to be other studies examining the use of statistics in educational research, a similar study looked at the American Journal of Health Education from 1994 to 2003 (Merrill, Stoddard, and Shields Citation2004). This study found that descriptive statistics were used most often (83%), with the following other methods being used next most frequently: model validation (33%), chi-square tests (25%, ANOVA (17%), t-tests (17%), Pearson correlations (15%), and F-tests (13%). As was found in the gifted education study, simpler statistics methods appeared to be used most often.
Statistical Software
Another factor that affects an educational faculty member’s ability to conduct statistical analyses is their skill with and access to statistical software. In 2015, the four most used statistical software packages in journal articles in all fields were, in order of most frequent use: SPSS, R, SAS, and Stata (Muenchen Citation2016). Beyond these four software systems, researchers may use a variety of other software packages including MATLAB, Minitab, Analytica, JMP, and SYSTAT. However, this project will focus primarily on the top four ().
Table 1 Software package features.
SPSS, developed in 1968, has a focus on usability with well-developed drop-down menus that can conduct most analyses (SPSS Inc Citation2009). This software is perceived to be the most-used software in journal articles in all fields (Muenchen Citation2016). The software, however, is fairly expensive, can only be used when a user is online, except through a temporary commuter license (IBM Citation2018), and is not strong in some advanced areas of research methodology, as of Version 24. For example, structural equation modeling cannot be conducted without purchasing the expensive add-on AMOS, and propensity score matching is new to SPSS and fairly limited in its options. Item response theory is not available at all in SPSS. By contrast, R, Stata, and SAS can conduct all of these analyses. Unlike the other software packages, SPSS cannot handle user written packages, though it can interface with R, allowing it to use R’s user written packages.
R Software (R Core Team Citation2022) was developed as free software in the 1990’s (R Core Team n.d.), and it’s free distribution makes it an ideal choice for institutions and students who are tight on funds. R, moreover, is generally the most flexible in terms of analyses offered, especially in terms of specialized or newly developed methods, due to the many free add-on packages available. However, R can be intimidating to beginners or those who are less confident with their ability to work with syntax rather than dropdown menus unless they are aware of add-on GUIs or packages. Thus, many faculty who could benefit from using R in their teaching or research do not yet have the skill to do so without some direction.
Stata Software sits between SPSS and R in cost. Drop-downs and intuitive syntax allows beginning users to easily access the software and advanced users to conduct analyses that are, in many cases, beyond what is available in SPSS. In addition, like R, Stata is strong for those who are using more cutting edge procedures (Acock Citation2005) and can handle user written packages. A perpetual license for faculty or students users for Stata/IC, which is adequate for most needs, is currently available as a fairly affordable perpetual license (). Stata was first developed in the mid-1980’s (Cox Citation2005). Stata, however, is the least frequently used package in journal articles among the four software packages discussed here (Muenchen Citation2016).
SAS, like SPSS, is very expensive. A free university version is available, however, (). The software was developed in the 1960’s and 1970’s (SAS n.d) but is not a popular choice relative to SPSS (Muenchen Citation2016), which may be related to ease of use. SAS is very strong with respect to data management and complexity of the procedures it can handle compared to SPSS, and learning the software pays off for heavy data managers (Acock Citation2005). Statistical software skills, cost, and availability of software are important factors to consider upon examining the limitations of the abilities of educational researchers to conduct high quality quantitative research.
History of HBCUs
Another factor we need to consider is the context of the university. For this study, I examined both U.S. universities, in general, that have schools of education and one group of minority-serving institutions (Historically Black Colleges and Universities (HBCUs)).
The Higher Education Act of 1965 defines a HBCU as a college or university founded before 1964 with a primary mission of educating Black Americans. Currently, there are 103 such institutions, mostly in the southern states. They are varied in size and compositions and include both two-year and four-year public and private schools. Brown (Citation2013) indicates HBCUs have varied purposes related to providing leadership and an economic center for the Black community to produce graduates. In general, the schools’ reputations have been inconsistent; they have been both praised and criticized. Brown suggests they often feel a need to demonstrate their usefulness and quality due to public perceptions of the institutions representing a loss of white privilege. However, they tend to have very low federal and financial support and are in need of educational research that focuses more on them and their successes (Brown Citation2013).
Gasman and Commodore (Citation2014) conducted a review of the literature on HBCUs and found that the institutions are strong in a variety of areas including affordability, community engagement, willingness to educate at-risk students, leadership training, having an Afrocentric curricula, a focus on teaching, and diversity. However, they find that challenges include low retention, financial concerns, desegregation pressures, small endowment size, and gender gaps. The authors feel there has been insufficient research focused on HBCUs due to discouragement by graduate advisors who find the topic unhelpful to career development as well as due to discouragement by the HBCU community itself, which often has concerns they will not be portrayed well. The authors find that within HBCUs themselves, there is less research funding and time to devote to research than in similar U.S. institutions. Thus, it seems that a strong focus on teaching and limited research funds may impact the development of research agendas and skills.
The education of many HBCU faculty at HBCUs, however, does not appear to suggest limited skills that might reduce research productivity. Perna (Citation2001) found that 70% of African American faculty with doctorates from HBCUs work for HBCUs. Yet, research productivity was related neither to working at an HBCU nor obtaining a bachelor’s from an HBCU.
In summary, prior literature suggests that faculty at HBCUs may have limited budgets and time allotted to research, but there is no evidence that their production is less than that of faculty with similar characteristics at other institutions. They may, therefore, have particular need for tools and training that will make their limited budgets and time available more effective.
Need for the Study
Many statistical methods workshops are available to faculty members who have the time to travel, and support from their universities for program fees and travel-related costs. Seminars can be costly with fees for online and face-to-face programs ranging from nominal amounts to thousands of dollars. Similarly, software access and training can be cost and time-intensive, prohibiting faculty from learning the skills needed to use cheaper options such as R or Stata. There has been little examination of where the true needs for additional training, programs, and workshops are, and none regarding the particular needs, if any, of educational researchers at HBCUs.
Research Questions
Each research question was examined for the U.S. general sample and the HBCU sample separately.
For which of the five most published statistical software packages is there a significant gap between what professors of education are proficient in versus what they would like to be proficient in?
For which set of commonly used statistical methodologies is there a significant gap between what professors of education have proficiency in versus what they would like to have proficiency in?
What factors impede the abilities of professors of education to improve their skills with statistical methods and software packages?
Methods
The study entailed a multi-group descriptive gap analysis, and was not intended to be comparative in nature because the two sets of faculty have different histories, budgets, faculty profiles, and needs. That is, HBCUs were not directly compared to the more general U.S. sample using statistical tests or models. The needs of the two groups were examined separately within their own contexts.
Participants
Two groups of participates were located, one from all U.S. institutions and one from a sample of HBCUs as defined by the federal government. IRB approval was obtained from the researcher’s institution. All data were de-identified by the researcher and kept confidential.
General U.S. Sample
A list of all accredited post-secondary institutions in the United States from the U.S. Department of Education (Citation2017) was used as the sampling frame. From this, a simple random sample of 50 U.S. four year colleges and universities was selected. If the selected institution included a department, college, or school of education, and E-mail addresses were publicly available on the website, then these E-mail addresses were gathered. Satellite schools were not include. No more than 25 faculty E-mail addresses were gathered from any one school; the sample included the first 25 addresses located within each college, school, or department’s faculty directories. In many cases, fewer than 25 education faculty were listed. This procedure resulted in the inclusion of forty-seven institutions, none of which happened to be HBCUs. 596 faculty members were represented in this original sample and given E-mail invitations. The invitees were sent two reminder E-mails over a two week period and an additional third week was allowed for responses.
A final sample of 130 faculty members responded from thirty-six of these schools. This response rate was low (22%), likely due to the busyness of faculty members and the fact that the survey came from an outside institution with which they are potentially unacquainted.
HBCU Sample
Due to both the smaller number of HBCUs and the smaller school size at many of them, education faculty at all HBCUs in the United States (The Hundred-Seven Citation2017) for whom E-mails were publicly available online were sent surveys. Satellite schools were not included. This resulted in E-mail invitations being sent to 657 faculty members from 68 institutions using a procedure identical to the general sample. Of these invitees, 94 responded, representing 39 HBCUs. Again, a low response rate (14%) was likely due to the busyness of the faculty. The lower response rate for HBCUs may suggest higher faculty burdens at those institutions.
Instrumentation
An original survey was developed in Qualtrics that allowed respondents to indicate their level of proficiency in using the four most popularly used software packages described previously (SPSS, SAS, Stata, R). In addition, they were asked about their proficiency with Excel for comparison. They were also asked about their proficiency with a selection of 13 representative statistical methods. For both software and methods, respondents rated themselves on their current proficiency on a four-point scale (have not heard of it, little or no proficiency but heard of it, moderate proficiency, advanced proficiency). Similarly, they rated their desired or needed skill on a four-point scale (I don’t know, little or no proficiency, moderate proficiency, advanced proficiency). In all cases, proficiency was interpreted by respondents according to their own frameworks. Thus, the focus of this study is on whether faculty members feel proficient.
Regarding the five software packages, they were also asked which software package they use most, with other and I never/rarely do statistical analyses as additional options. Regarding the methods, they were asked whether they had personally conducted an analysis using the approach or statistic in the past five years, and they were asked if there was someone they could go to for help at their university, if needed, for these methods. In addition, respondents were asked what prevents them from learning more statistical methods, their preferred mode of learning new skills, and a variety of descriptors. All questions were asked in the order reported except as noted in the results.
In addition to examining responses at the item level, the items fell onto six scales. These scales were examined for internal consistency reliability, using Cronbach’s alpha. In addition, the items and scales were examined for content validity through review by three research methods experts. Construct validity was examined by looking at correlations amongst the scales.
Analysis
For all variables, summary statistics (proportions) were calculated for each response category. For the items related to perceived proficiency and perceived skill with software or methods, the proportion of respondents indicating their skills were at the moderate or advanced level was compared with the proportion with an indicated desire or need for skills at the moderate or advanced level. Because the data consisted of clustered matched-pair proportions, an Obuchowski test was used to test the difference in proportion with moderate-high skill versus need. Yang, Sun, and Hardin (Citation2010) suggest use of the Obuchowski test when there are a large number of clusters, within cluster size is small, and information about the correlation structure is not available. In this sample, the number of clusters was large in both cases (K, K
). Within cluster sizes were small with an average cluster size of n = 3.61 in the general sample and n = 2.41 in the HBCU sample. In addition, this test, an extension of McNemar’s statistic, has the advantage of not assuming a specific correlation structure. Obuchowski’s test uses a test statistic of the following form:
(1)
(1) where
represents the proportion with moderate to high skill,
represents the proportion with moderate to high need, and
represents the overall proportion in the moderate to high category. This test statistic is distributed as chi-square with one degree of freedom if the number of clusters is large. When the number of units within a cluster is one, this reduces to McNemar’s statistic (see Yang et al.). All analyses were conducted in R Software, and the modified Obuchowski test was conducted using the clust.bin.pair package (method
yang) in R (Gopstein Citation2016). The yang option in this package is based on the equations used and tested in Yang et al.
Results
After survey data were collected and data were examined for any problems with coding, results were found separately for the general U.S. and HBCU samples. All included respondents answered all questions.
General Sample
Of the 130 responses from the general U.S. sample, 72 faculty members were from public institutions, 51 were from private nonprofits, and 7 were from private for-profit. The majority came from teacher education (n = 33), counseling/psychology (n = 31), general education (n = 19), or educational leadership (n = 19) departments. Mean department size reported was 12.33, and the mean number of total education faculty at the responding institutions was 62.11. As indicated in , the majority of responding faculty were educated in the United States and were native English speakers. A minority taught only undergraduates, and few had no publication expectation.
Table 2 Traits of survey respondents U.S. Sample.
Software—General Sample
For the general U.S. sample, those who used statistical software reported using SPSS and Excel most often. SAS, Stata, and R, were reported as the primary software by very few respondents (). When reported proficiency (skill) versus perceived need were examined, a clearly statistically significant gap was found for the general U.S. sample with respect only to R software (; p < 0.001). The gap for Stata and Excel software had less evidence supporting significance (;
), especially considering the need to interpret p-values conservatively in the light of the large number of tests being conducted on the data. Respondents reported greatest skill with Excel and SPSS and least skill with Stata and R ().
Table 3 Software used most often for statistical analyses U.S. sample.
Table 4 Proportions reporting software skill and need in U.S. sample.
Statistical Methods—General U.S. Sample
Regarding methods in the general U.S. sample, usage in the last five years suggested the simpler methods such as summary statistics or t-tests was, unsurprisingly, higher than for more advanced methods such as hierarchical linear modeling or structural equation modeling (). For all methods, more than 50% of respondents were aware of help available, if needed, for the method. The methods skill-need gap was found to be positive and statistically significant for the general U.S. sample for six out of thirteen of the techniques (). For three of the techniques, however, the gap was statistically significant and negative, suggesting the respondents felt they had more skill than they needed to use. These p-values should be interpreted conservatively, however, due to the large number of tests conducted in this study.
Fig. 1 Percent of faculty who have used procedure in last 5 years in general U.S. sample. Percent who do not have help available to them with the procedure.
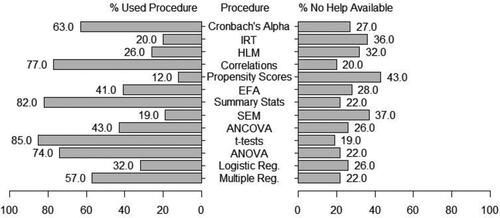
Table 5 Proportions reporting methodology skill and need in U.S. sample.
I also examined the relationship between skill and the requirement to publish using Chi-Square tests of independence in order to examine the possibility that those who are required to publish more have more advanced skills. These analyses indicated little evidence of a relationship, with only the exploratory factor analysis variable having a significant relationship to publishing (). For EFA, those with no requirement to publish at all were found to have lower skills than those with one or more publications required.
Training Issues and Preferences—General Sample
For the general sample, lack of time for training was the biggest factor preventing respondents from obtaining more statistics training. A lack of need or interest was the next most common factor, followed by a lack of funds for training ().
Table 6 What prevents respondent from getting more statistics training U.S. sample.
The most frequently desired mode of learning was face-to-face workshops, with online workshop rating second (). There was less expressed interest in taking additional university courses related to methods, either face-to-face or online.
Table 7 Desired modes for statistics training U.S. sample.
Sum Scale Results—General Sample
In addition to examining results at the item level, results were examined at the construct, or scale level. The items belonged to six scales measuring overall software proficiency, need for software skills, statistical methods proficiency, frequent use of methods, need for statistical methods proficiency, and available help for statistical methods. For the two software related skills, internal consistency reliability, measured by Cronbach’s alpha, was adequate (), and for the four scales related to statistical methods, Cronbach’s alpha was excellent (). Correlations amongst the first five scales were highly correlated (0.59 <r < 0.79), providing some evidence of convergent validity. The sixth scale was only minimally correlated with the others (0.03 <r < 0.15), providing evidence of divergent validity (this scale is not expected to relate to the others).
Table 8 Scale statistics: U.S. general sample.
HBCU Sample
The faculty who responded from HBCUs came from colleges and universities that included 67 public, 21 private nonprofit, and 6 private for-profit. The majority of faculty members came from teacher education () or educational leadership (
) departments. The mean department size reported by respondents was 9.22, and the mean reported total number of education-related faulty members at the institution was 33.17. As indicated in , a minority of HBCU faculty members were at public universities, few taught only undergraduates, nearly all were educated in the United States and spoke English as their primary language, the largest number were teacher educators, and nearly all had at least some publishing requirements as part of their jobs.
Table 9 Traits of survey respondents HBCU sample.
Software—HBCU Sample
The majority of responding HBCU faculty used SPSS most often, with Excel the next most often used software and the others being the software packages of choice rarely (). The skill-need gap was statistically significant for all software packages (all p < 0.05; ). Due to the many tests conducted, interpretations made based on these p-values should be treated conservatively, especially when the p-value is closer to the traditional cutoff.
Table 10 Software used most often for statistical analyses HBCU sample.
Table 11 Proportions reporting software skill and need in HBCU sample.
Statistical Methods—HBCU Sample
Method usage in the last five years suggested the simpler methods such as summary statistics or t-tests was higher than for more advanced methods such as hierarchical linear modeling or structural equation modeling (). The known help available to the faculty members varied, but there was generally a lower perception of available help for the more advanced techniques ().
Fig. 2 Percent of faculty who have used procedure in last 5 years in HBCU sample. Percent who do not have help available to them with the procedure.
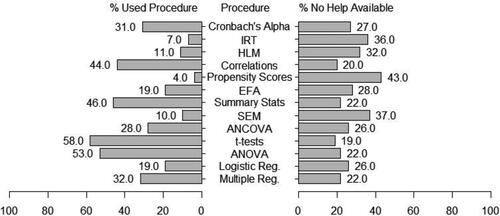
There was a statistically significant positive gap for eleven of the thirteen techniques. Many of the p-values were extremely small (p < 0.001). Those closer to the traditional should be interpreted cautiously due to the large number of tests conducted. In general, p-values were considerably smaller for the more advanced techniques ().
Table 12 Proportions reporting methodology skill and need in HBCU sample.
As was done with the general sample, Chi-Square tests were conducted to examine the possibility of a relationship between publishing expectations and skill. For the HBCU sample, nine out of the thirteen Chi-Square tests were statistically significant. Those with no publishing requirements were found to have less skills than the other faculty members. The statistically insignificant tests were associated with the most advanced statistical skills: structural equation modeling (), propensity score matching (
), hierarchical linear modeling (
), and item response theory (
), suggesting that even those who need to publish frequently have weak skills in the most advanced methods.
Training Issues and Preferences—HBCU Sample
Lack of funds for training and lack of funds for software were the second and third most commonly reported limitations to the ability to receive more training (). The most desired mode of learning was face-to-face workshops, with online workshop rating second ().
Table 13 What prevents respondent from getting more statistics training HBCU sample.
Table 14 Desired modes for statistics training HBCU sample.
Sum Scale Results—HBCU Sample
As was done for the general sample, HBCU results were examined at the construct, or scale level. For the two software related skills, internal consistency reliability, measured by Cronbach’s alpha, was adequate (), and for the four scales related to statistical methods, Cronbach’s alpha was good to excellent (). Correlations amongst the first five scales were in a reasonable range (0.33 <r < 0.79), providing some evidence of convergent validity. The sixth scale was only minimally correlated with most of the others (0.00 <r < 0.36), providing evidence of divergent validity (this scale is not expected to relate to the others).
Table 15 Scale statistics: HBCU sample.
Discussion and Conclusions
For both samples, clear gaps were found in the respondent’s evaluation of their skill with respect to their need. Larger skill gaps were found with the newest and most challenging software (R). While GUIs are available for R to make it more user friendly, it is possible that faculty either do not know about the existence of these GUIs or lack training to use them. In addition, larger skill gaps existed for the more advanced statistical methods. Bolstering these skills might be helpful in improving the often-negative view of professors of education, as suggested by Gorard, Rushforth, and Taylor (Citation2004).
U.S. Sample Gaps
For the U.S. researchers, the only perceived gap in software ability was with R, but most of the more advanced statistical methods were found to have gaps. Of these, the largest perceived gaps were with propensity score matching and structural equation modeling. To some degree, the perceived need regarding statistical software was likely understated as many of the more advanced methods (e.g., structural equation modeling, item response theory, propensity score matching) cannot be done well or at all in SPSS, the most commonly used software. As researchers become more advanced in their skills, they often “outgrow” SPSS and need more advanced or flexible software (Acock Citation2005). All of the methodologies for which there was no statistically significant gap can be done adequately in SPSS.
It is also reasonable to conjecture that the skill-need gap could become larger for the more advanced statistical methodologies if researchers had an introduction to using the methodology and learned what the methods could do, assuming some in the sample were not aware of the potential of the methods.
HBCU Sample Gaps
The HBCU respondents reported a gap with respect to all software packages, even Excel, and all methods except summary statistics and t-tests. The purpose of this study was not to compare the skill level at general U.S. versus HBCU institutions, and the greater perceived gap at the HBCUs should not be taken as due to greater skill deficits. In many cases, the increased gap size was due to a perceived higher need rather than a perceived lower skill level. The two samples are in many ways not comparable, and thus, any comparative conclusions should be made cautiously. However, as indicated by Gasman and Commodore (Citation2014), HBCUs do have less research funding and this may also be a reason for the gap.
We do see, however, that HBCUs have a large expressed need relative to their skill level, which could be related to many factors such as lack of funding for software or training, lack of time to improve their skills due to a focus on teaching, or simply high publication expectations at the particular institutions included in the study. The greater research needed on HBCUs and their successes (Brown Citation2013) might best be addressed by researchers at HBCUs themselves, suggesting additional training could be helpful.
With both samples, it is also possible that exposure to free software such as R, or cheaper software such as Stata, might cause the perceived need for those software packages to increase. In addition, some may not be aware of resources such as R GUIs that make use of the software easier for beginners. Future research might reveal whether knowledge of GUIs moderates skill level with R. In addition, it would be helpful to examine the impact of department budget, teaching loadings, faculty rank, and similar factors, on skill gaps.
Future Training
There is a clear need for continued research methods training for professors of education. It has been suggested that poor researcher self-efficacy predicts reduced research output (Pasupathy and Siwatu Citation2014; Hemmings and Kay Citation2016), and this can be detrimental to both the faculty member and the institution. This study supports prior research that suggests education faculty do not often stretch beyond simpler quantitative methods (Warne et al. Citation2012).
This study helps identify some of the ways in which this training might be most helpful. For example, future training offerings will preferably be offered as face-to-face workshops. However, those offering the programs need to be sensitive to the limited time and funds of the potential workshop attendees. These workshops should, ideally, focus on areas of greatest perceived skill-need gap, such as R programming or propensity score matching. With the more limited funding at HBCUs (Brown Citation2013), these workshops may need to be grant funded.
Preparing future professors of education while they are graduate students can help reduced future gaps (Harwell Citation2001), but universities preparing Ph.D.’s in education vary greatly in their statistical offerings and requirements. All Ph.D. programs would benefit from the greater methodological training, offering as many as five courses, given in some of the universities. In addition, tools that help professors of education teach these quantitative methods and software packages to their own students, such as approachable curriculum and online resources, may be helpful. These results also suggest that graduate students who intend to become professors of education would be better served by being taught on the software packages that it would most benefit them to use in their future careers. The practice of instructing graduate students on student software (e.g., JASP) may be detrimental.
Limitations
Conclusions are limited by the self-report nature of the data. Respondents rated their own skill levels and needs. Thus, conclusions about various gaps should be relative across software packages and methods rather than absolute. In addition, the low response rates make the ability to generalize limited as the respondents may not be representative of their larger populations. For analyses examining individual items, measurement error could be problematic and was not measured. Due to the time burden of the existing survey on respondents, and the difficulty in getting professors of education to respond, it was not possible to either lengthen the survey or repeat the survey in order to address measurement error (reliability) related to individual software packages or individual statistical methodologies.
References
- Acock, A. C. (2005), “SAS, Stata, SPSS: A Comparison,” Journal of Marriage and Family, 67, 1093–1095. DOI: https://doi.org/10.1111/j.1741-3737.2005.00196.x.
- Alabama A&M University. (2017), “Alabama Agricultural and Mechanical University: Graduate Catalog 2017–2018.” Available at http://www.aamu.edu/administrativeoffices/academicaffairs/Pages/Graduate-Catalogs.aspx.
- Brown, M. C. II. (2013), “The Declining Significance of Historically Black Colleges and Universities: Relevance, Reputation, and Reality in Obamamerica,” The Journal of Negro Education, 82, 3–19.
- Cox, N. J. (2005), “A Brief History of Stata on its 20th Anniversary,” The Stata Journal: Promoting Communications on Statistics and Stata, 5, 2–18. Available at http://www.stata-journal.com/sjpdf.html?articlenum=gn0017.
- CRAN. (2018), “The Comprehensive R Archive Network.” Available at https://cran.r-project.org/.
- Gasman, M., and Commodore, F. (2014), “The State of Research on Historically Black Colleges and Universities,” Journal for Multicultural Education, 8, 89–111. DOI: https://doi.org/10.1108/JME-01-2014-0004.
- Gopstein, D. (2016), clust.bin.pair: Statistical Methods for Analyzing Clustered Matched Pair Data (Version 0.0.6) [Software]. Available at https://CRAN.R-project.org/package=clust.bin.pair.
- Gorard, S., Rushforth, K., and Taylor, C. (2004), “Is There a Shortage of Quantitative Work in Education Research,” Oxford Review of Education, 30, 371–395. DOI: https://doi.org/10.1080/0305498042000260494.
- Harvard University. (2016), “Doctor of Philosophy in Education.” Available at https://www.gse.harvard.edu/doctorate/doctor-philosophy-education
- Harwell, M. (2001), “Future Directions and Suggestions for Improving the Use of Statistical Methods in Educational Research,” in Paper Presented at an Annual Meeting of the American Educational Research Association (Seattle, WA, April 10–14, 2001). Available at http://files.eric.ed.gov/fulltext/ED458271.pdf.
- Hemmings, B., and Kay, R. (2016), “The Relationship between Research Self-efficacy, Research Disposition, and Publication Output,” Educational Psychology, 36, 347–361. DOI: https://doi.org/10.1080/01443410.2015.1025704.
- IBM. (2018), “What is a Commuter License?” Available at https://www-01.ibm.com/support/docview.wss?uid=swg21482911.
- Jackson State University. (2017), “Course Titles and Modules.” Available at http://www.jsums.edu/ephd/program/courses/.
- Johns Hopkins School of Education. (2016), “Doctor of Philosophy Program Handbook.” Available at http://education.jhu.edu/Academics/doctoral/PhD_Handbook_2016.pdf.
- Labaree, D. F. (2011), “The Lure of Statistics for Educational Researchers,” Educational Theory, 61, 621–632. DOI: https://doi.org/10.1111/j.1741-5446.2011.00424.x.
- Lysenko, L. V., Abrami, P. C., Bernard, R. M., Dagenais, C., and Janosz, M. (2014), “Educational Research in Educational Practice: Predictors of use,” Canadian Journal of Education, 37, 1–26. Available at http://files.eric.ed.gov/fulltext/EJ1057960.pdf.
- Merrill, R. M., Stoddard, J., and Shields, E. C. (2004), “The Use of Statistics in the American Journal of Health Education from 1994 through 2003: A Content Analysis,” American Journal of Health Education, 35, 290–267. DOI: https://doi.org/10.1080/19325037.2004.10603659.
- Morgan State University. (2018), “PhD in Higher Education.” Available at https://www.morgan.edu/school_of_education_and_urban_studies/departments/advanced_studies_leadership_and_policy/degrees/majors/higher_education_program_(phd).html.
- Muenchen, R. A. (2016), “The Popularity of Data Analysis Software.” http://r4stats.com/articles/popularity/.
- On the Hub. (2018), “IBM SPSS Statistics Faculty Pack 25.” https://estore.onthehub.com/WebStore/OfferingsOfMajorVersionList.aspx?pmv=ef59e1db-5e83-e711-80f3-000d3af41938&cmi_mnuMain=ed6ad73c-7bc7-e011-ae14-f04da23e67f6&utm_source=LandingPage-SPSS-Statistics-faculty&utm_medium=LandingPage-b&utm_campaign=SPSS.
- Pasupathy, R., and Siwatu, K. O. (2014), “An Investigation of Research Self-efficacy Beliefs and Research Productivity among Faculty Members at an Emerging Research University in the USA,” Higher Education Research & Development, 33, 728–741.
- Peabody College. (2016), “Leadership and Policy Studies PhD Handbook.” Available at http://peabody.vanderbilt.edu/departments/lpo/graduate_and_professional_programs/phd/handbook-2017.pdf.
- Perna, L. W. (2001), “The Contribution of Historically Black College and Universities to the Preparation of African Americans for Faculty Careers,” Research in Higher Education, 42, 267–294.
- Prairie View A&M University. (2017), “”Department of Educational Leadership and Counseling.” Available at http://catalog.pvamu.edu/academicprogramsanddegreeplans/departmentofeducationalleadershipcounseling/#departmentstext.
- R Core Team. (2022), “R: A Language and Environment for Statistical Computing [Software].” R Foundation for Statistical Computing, Vienna, Austria. Available at https://www.R-project.org/.
- R Core Team. (nd), “A Free Software Project: A Brief History.” https://cran.r-project.org/doc/html/interface98-paper/paper_2.html.
- Salandy, A. (2012), “HBCUs Doctoral Degree Offerings.” Available at http://allhighered.blogspot.com/2012/01/hbcus-doctoral-degree-offerings.html.
- SAS. (n.d), “History.” Available at https://www.sas.com/en_us/company-information.html\#1966-1976.
- SAS. (n.d), “SAS University Edition Fact Sheet.” Available at https://www.sas.com/content/dam/SAS/en_us/doc/factsheet/sas-university-edition-107140.pdf.
- SPSS Inc. (2009), “Corporate History.” Available at http://www.spss.com.hk/corpinfo/history.htm.
- Stanford University. (2017), “Core Courses.” Available at https://ed.stanford.edu/academics/doctoral-handbook/courses/core.
- StataCorp LLC. (2018), “Stata Campus GradPlan.” Available at http://www.stata.com/order/new/edu/gradplans/campus-gradplan/.
- The Hundred-Seven. (2017), “HBCU Listing.” Available at http://www.thehundred-seven.org/hbculist.html.
- U.S. Department of Education. (2017). “The Database of Postsecondary Institutions and Programs.” Available at https://ope.ed.gov/accreditation/.
- U.S. News & World Report. (2016), “Best Education Schools.” Available at http://grad-schools.usnews.rankingsandreviews.com/best-graduate-schools/top-education-schools/edu-rankings.
- University of Wisconsin-Madison. (2017), “Ph.D. Program.” Available at https://elpa.education.wisc.edu/elpa/academics/phd-degree-requirements/graduate-program.
- Virginia Tech. (2018), “HBCU with Doctoral Programs.” Available at https://oea.vt.edu/content/dam/oea_vt_edu/affirmative-action/hbcu-doctoral-programs.pdf
- Warne, R. T., Lazo, M., Ramos, T., & Ritter, N. (2012), “Statistical Methods Used in Gifted Education Journals, 2006–2010,” Gifted Child Quarterly, 56, 134–149. DOI: https://doi.org/10.1177/0016986212444122.
- Wicklin, R. (2016), “Writing Packages: A New Way to Distribute and Use SAS/IML Programs.” Available at https://support.sas.com/resources/papers/proceedings16/SAS4201-2016.pdf.
- Yang, Z., Sun, X., & Hardin, J. W. (2010), “A Note on the Tests for Clustered Matched-Pair Binary Data,” Biometrical Journal, 52, 638– 652.