Abstract
Data science is a highly interdisciplinary field that comprises various principles, methodologies, and guidelines for the analysis of data. The creation of appropriate curricula that use computational tools and teaching activities is necessary for building skills and knowledge in data science. However, much of the literature about data science curricula focuses on the undergraduate university level. In this study, we developed an introductory data science curriculum for an out of school enrichment program aimed at middle grade learners (ages 11–13). We observed how the participants in the program (n = 11) learned data science practices through the combination of nonprogramming activities and programming activities using the language R. The results revealed that participants in the program were able to investigate statistical questions of their creation, perform data analysis using statistics and the creation of data visuals, make meaning from their results, and communicate their findings. These results suggest that a series of learner-centered nonprogramming and programming activities using R can facilitate the learning of data science skills for middle-school age students.
1 Introduction
Data science is a highly interdisciplinary field that refers to a set of skills and techniques that include statistics, computer science, and communication (Satyanarayana Citation2013; Cleveland Citation2014). Much of the literature about data science curricula focuses on introductory statistics and data science courses at the undergraduate university level (Baumer Citation2015; Hardin et al. Citation2015; Srikant and Aggarwal Citation2017). However, data science is not simply a technical subject to be taught for career-based purposes. An understanding of data science allows learners to gain skills that include computing simple statistics, choosing appropriate graphical and numerical displays for data representation, and communicating data results (Lazar and Franklin Citation2015). Researchers have identified the importance of developing data science curricula for secondary schools (Gould et al. Citation2016; Heinemann Citation2018; Lee and Wilkerson Citation2018) but ways to authentically engage younger learners with data science is still under-researched.
Data science research involving younger learners, ages 11 and above has focused on Python programming activities implemented in formal statistics courses (Thompson and Wu Citation2020) or the use of block-based programming tools (Datta and Nagabandi Citation2017; Dryer, Walia, and Chattopadhyay Citation2018), which contain visual drag-and-drop coding primitives that learners connect to execute commands, as opposed to coding that is based in text. However, few programs have engaged middle-school aged learners in using R, the dominant open-source programming language used by statisticians (Grolemund and Wickham Citation2016). Thus, in this study, we designed nonprogramming and programming activities which allowed participants to engage with text-based coding using the R programming language. While other researchers have explored R programming for teaching data science to middle school learners (Datta and Nagabandi Citation2017), our study focused on developing activities to engage participants in data science skills such as finding and cleaning publicly available and relatable datasets, identifying questions to investigate, writing R code to investigate a question, interpreting results, and finally communicating results in written and oral formats. Using a learner-centered framework (Quintana et al. Citation1999), we designed and taught a 8-session data science short course aimed at exposing self-enrolled middle school aged learners to data science skills.
2 Methods
2.1 Learner-Centered Design
The central theoretical framework guiding the design of the program was constructionism (Papert Citation1980; Harel and Papert Citation1991). A constructionist approach emphasizes creating “objects-to-think-with” that represent how a learner actively constructs and reconstructs their understanding of a domain (Kafai Citation1995). The act of construction allows the learner to guide their learning through the creation of personally meaningful and public artifacts. In many cases, the object being constructed is computational in nature (Wilensky Citation2003), which allows it to be easily manipulated in multiple ways to represent conceptual ideas (Harel and Papert Citation1991). To create an environment in which learners can create such personally meaningful “objects-to-think-with,” we draw on a learner-centered design framework, in which learners are encouraged to explore their interests while also guided to effectively use the tools in a new domain (Quintana et al. Citation1999).
The program was designed as an approach to data science using programming that aligned with the Computer Science Teachers Association (CSTA) sixth–eighth grade standards in data and analysis (Stephenson et al. Citation2012) and National Council of Mathematics Teacher (NCTM) standards for Data Analysis and Probability (National Council of Teachers of Mathematics (NCTM), Citation2000). CSTA states sixth–eighth grade students should be able to collect data using computational tools, visualize data to make it more useful and reliable, and present data visualizations to highlight relationships and support a claim. According to the NCTM grades sixth–eighth, students are supposed to collect and interpret data, learn how to create plots with data and utilize their observational skills and statistics to make inferences. These standards are similar to the Guidelines for Assessment and Instruction in Statistics Education (GAISE) K-12 Report (Franklin et al. Citation2007), where the process of statistical investigation is formulating questions, collecting data, analyzing data, and interpreting results. NCTM, CSTA and GAISE K-12 aim for participants to engage in data science skills that build on their ability to organize and present data to support a claim using technology.
2.2 Data Science Skills
We identified two ways in which participants engaged in the designed activities in this program: (i) data science processes and (ii) data science practices. Data science processes include the steps taken in order to achieve full understanding of data science procedures, including formulating questions, collecting data, analyzing data (visuals and models), and communicating results. The “Data Science Process Workflow” as shown in , is an adaptation from Grolemund and Wickham (Citation2016). We also looked at the GAISE K-12 standards to identify data science processes that closely aligned with the R data exploration workflow from Grolemund and Wickham (Citation2016) to create the “Data Science Process Workflow” for our Data Detectives Program. Data science practices shown in involve (i) identifying data patterns, (ii) pursuing data surprises, (iii) reasoning about data relationships and (iv) making data predictions. The practices are an adaptation of Jiang and Kahn (Citation2019), sociocultural ten data wrangling practices for youth. The practices are chosen to describe the interactions participants would have with the results created using the tools specified in each activity.
Fig. 1 Data Science Process Workflow for Data Detectives Program adapted from workflow from Grolemund and Wickham (Citation2016).
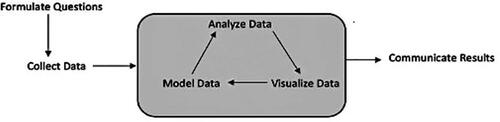
Table 1 Data science practices for data detectives program adapted from Jiang and Kahn (Citation2019).
3 Participants and Educational Program
3.1 Study Participants
Participants in this study included 11 male youth, ages 11–13, who all self-enrolled in the weekend enrichment program. All participants self-reported that they had some experience with blocked-based programming. The course was titled “Data Detectives,” and took place over eight consecutive Saturdays for 2.5 hr each session. The classroom included two interactive whiteboards on the front and back walls and six tables that accommodated five people with built-in monitors. Each participant was given a laptop provided to us, by request, from the weekend enrichment program. Each laptop came with the R software program already downloaded upon request by the instructors of the course. All work was collected through a learning management system in which participants uploaded their assignments and through the Google Suite of sharing tools. The authors, (former high school mathematics and computer science teachers) were the instructors for the course. We sent consent forms to fully inform parents and participants about the study. All participants consented for their information to be used in this study. We followed our approved Institutional Review Board protocol for this research study.
The learning goal for this program was for participants to develop data science skills using programming and nonprogramming activities. The first half of the course was an introduction to data science that aimed to enhance statistical thinking and help participants understand how data can be used to gain information. The last half of the course was dedicated to a final project in which participants identified existing, publicly available datasets which they analyzed using R. Participants then presented their projects in an expo-style format on the last day to which their parents and family were invited to attend.
3.2 Nonprogramming Activities
Activity 1: Google Trends. The students used Google Trends (trends.google.com) which provides an interface for users to explore and visualize data from public Google searches. As a class, we discussed the differences between bar graphs and line graphs and made predictions about how and why the data was represented using such visualizations. The graphs were displayed on monitors at their individual group tables and on the main monitor in the front of class.
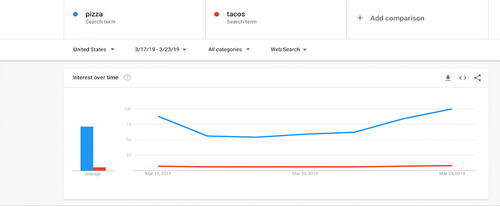
As a group, we explored line graph trends and axes by visualizing searches that contained the term, “pizza.” We then asked participants to predict what would happen if we added a second search term, “tacos.” Participants added the new topic to test their predictions and compared the graph trends for the two topics. They adjusted the timeline and provided us with insights for how adjusting an axis changed the results. For example, when participants switched the timeline to 7 days, increases were observed on certain days (). Participants interpreted the higher trends to be due to “most individuals ordering pizza on the weekend instead of Mondays.”
Fig. 2 An example of the whole group Google trend activity discussion comparing pizza and tacos over a 7-day period.
We encouraged participants to continue their inquiries. Participants then used Google Trends on their individual laptops. While it was an individual activity, we encouraged participants to work collaboratively. Participants chose two to four topics of their choice to search, make predictions, and compare trends. The students communicated their interpretations of relatable data visualizations with peers verbally and through writing in a Google document. The Google document served as a way for peers to provide feedback to each other about the predictions made, identify data surprises, and gain insights from each other’s visuals and assumptions.
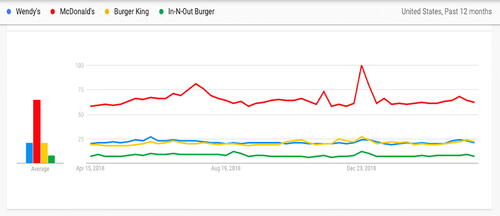
displays a participant’s example using Google trends to compare fast food restaurants. The participant stated “McDonalds is far more popular than Wendy’s or Burger King. In-N-Out is far less popular than any of them, because it is only available in very few states.” Here the participant interpreted the graphic accurately in terms of the popularity of fast-food restaurants. The participant additionally speculated that one of the restaurants was significantly less popular because of its regional status.
Fig. 3 An example of a participant’s Google trend activity comparing four fast-food restaurants.
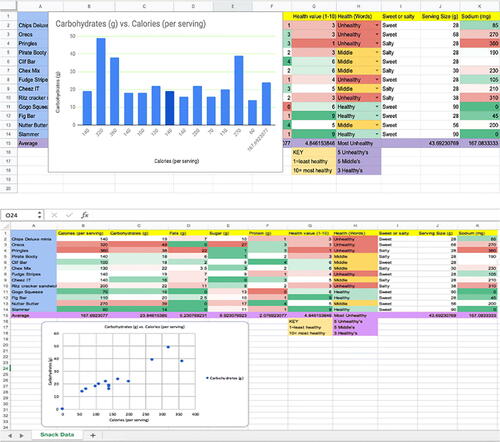
Activity 2: Snack Data. Another central whole group activity in the course involved participants selecting a food item from a basket of snacks we provided. As participants ate their snack, they read the nutrition facts and as a whole group came up with variables and categories that describe the snacks. They then recorded nutrition fact data for variables such as salty/sweet, calories, sodium, sugar, and healthy/in the middle/unhealthy on a class spreadsheet. As a group, we discussed how to use spreadsheets to input their data in a clean way, the difference between rows and columns on a spread sheet and explaining categorical versus numerical variables in data. The spreadsheet was displayed on monitors at their individual group tables and on the main monitor in the front of class. Once the spreadsheet was completed, instructors showed participants how to create various graphs such as bar charts and scatterplots (). After creating the graphs, participants were guided to ask questions about the data and discuss the differences between a statistical question and a nonstatistical question. Instructors then showed how to calculate the mean, median, and mode of a numerical distribution using spreadsheets. Lastly, instructors showed ways to summarize data and how different data visualizations can provide different summaries for data. Participants discussed insights, outliers, and claims being made on the data sample.
Fig. 4 Snack Data activity example of scatterplot and bar chart created with participants inputted data shared in spreadsheet.
3.3 Programming Activities
Activity 1: Introduction to R. In this activity, participants used R programming to reanalyze the snack data from the previous activity. Participants worked on their own laptops, but peer collaboration and support were encouraged. Participants were provided with an overview of R programming and a guide: R through Jupyter Notebook (Kluyver et al. Citation2016). In this activity, the R Jupyter notebooks served as an interface to modify, debug, and re-execute code on the given dataset. Because many participants did not have any experience with R or text-based programming in general, the notebooks contained much of the code for participants and only required them to make small modifications, such as inserting a file name, changing graph types, changing bin counts of a histogram, removing data points, and calculating correlation (). Participants’ use of R was scaffolded with extensive in-line comments. The main goal of this lesson was for participants to gain familiarity and comfort with R.
Fig. 5 Example of prebuilt code in the R Jupyter notebooks for the Introduction to R lesson.
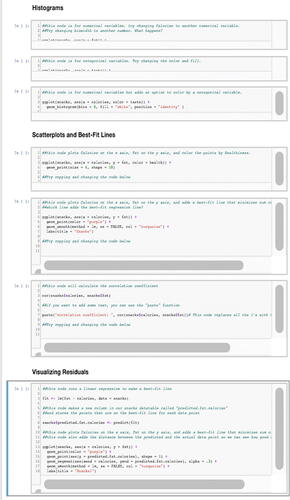
Participants downloaded the snack data by exporting a.csv file from Google Sheets and changing the path in the R notebook to load the data. As a class, we used R to create visualizations such as histograms to view the distribution of the data and scatterplots to visualize and calculate linear regressions. Participants also visualized residuals to highlight points which were poorly predicted by the linear regression. They summarized data numerically by calculating descriptive values, such as means and medians, and correlation coefficients. These activities were used as objects to ground discussions about how correlations can be used to understand the strength of the linear relationship between two variables. Instructors showed participants examples of linearly correlated variables with plausible causality. Participants communicated their own insights and claims with peers and instructors.
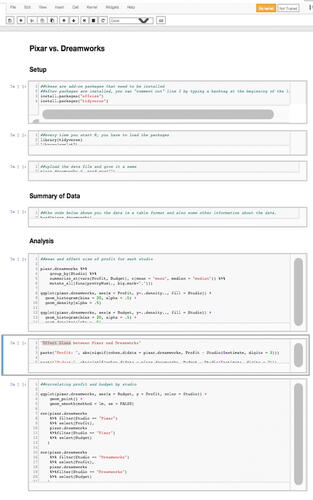
Activity 2: Pixar and Dreamworks. A follow-up activity using R involved participants conducting further analyses on a larger dataset of Pixar and Dreamworks movies that compared film budgets and profits. Again, for this activity the Jupyter notebooks served as an interface to modify, debug, and re-execute code on the given dataset and contained much of the commented code for participants (). Participants were prompted to identify at least three questions and describe findings they observed in the dataset. They experimented with various visualizations to summarize the dataset. Similar to their activity in the R Snack Data activity, participants summarized data numerically, calculating correlation coefficients and effect sizes to measure the strength of the relationship between two variables. Instructors then encouraged participants to run their scripts on the main screen for peers to observe and discuss.
Fig. 6 Example of prebuilt code in the R Jupyter notebooks for the Pixar and Dreamworks lesson.
3.4 Final Projects
In the final three weeks of the course, participants applied their skills to a dataset of their choice using R programming. Individually, participants created their own code for their final projects, modifying the R code from the previous programming activities. Instructors met with participants each week to discuss their visualizations, statistical analyses, and the narrative around what they discovered. Some participants presented their visualizations and findings using PowerPoint and others created posters alongside visualizations on their laptops. They presented their findings to their peers, instructors, and invited family members at the end of the program. These brief, informal presentations gave participants the opportunity to showcase their work, answer questions from their fellow classmates, family and friends, review the work of their peers, and provide and benefit from feedback. During presentations, each participant discussed the data they used, where the data was obtained, the process in choosing data visualizations and statistics to communicate the answers to the questions they created, the findings of the analysis, and suggestions for further analysis or exploration.
4 Results
We coded artifacts of participants’ work—Google document submissions, R code, poster boards—to evaluate the effectiveness of the course for participants’ engagement in data science practices and processes. shows the coding system that served as a guide to investigate participants’ work. The Process category codes (formulate questions, collect data, data analysis, and communicate) were adapted from the workflow in Grolemund and Wickham (Citation2016) as seen in . The Practice category codes (data patterns, reasoning about data relationships, pursuing data surprises, making data predictions) were adapted from Jiang and Kahn (Citation2019) as seen in . The knowledge codes were determined from the National Council of Mathematics Teacher (NCTM) standards for Data Analysis and Probability (National Council of Teachers of Mathematics (NCTM), Citation2000). Three of the NCTM standards state that students in grades 6–8 are expected to (i) discuss and understand the correspondence between datasets and their graphical representations especially histograms and scatterplots; (ii) make conjectures about possible relationships between two characteristics of a sample on the basis of scatterplots of the data and approximate lines of fit; and (iii) find, use, and interpret measures of center and spread. We translated these three standards into the three codes: plots, correlations, and effect size. We determined whether learners were able to choose appropriate plots that matched with datasets, discuss whether two variables were correlated in a dataset, and to calculate center and spread but also use these calculations to make conjectures about the differences between the means of two populations using cohen’s d.
Table 2 Coding system used to evaluate participants work and reflective responses.
4.1 Pixar and Dreamworks Activity
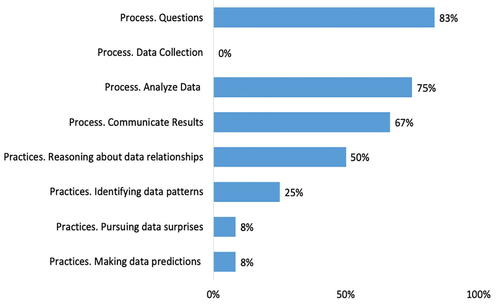
Using the categories (), we coded the Google document that participants submitted for the Pixar and Dreamworks activity to identify processes and practices. Participants (83%) proposed questions such as “Does Pixar average a greater amount of money(profit) than Dreamworks?” and “Does the release date [of a movie] have anything to do with profit?” (). Note that the Pixar and Dreamworks activity had no data collection because the dataset was provided to participants. 75% of participants were able to produce a visualization or the statistics to address their questions. 67% of participants communicated their findings through writing. While interpreting the data visualizations and calculations, participants engaged with at least one of the data sciences practices. Regarding practices, most participants engaged in reasoning about data relationships (50%), while some participants identified data patterns (25%), pursued data surprises (8%), and made data predictions (8%). An example of a participant’s reasoning about data relationships in reference to the question “Does the budget have anything to do with the overall revenue?” was “The movies with more money to spend gained more money overall. This may be because they could spend more on details, looks, actors, directors, producers, etc. This made the movies more appealing so maybe more people would buy the movies because of it being better all around.”
Fig. 7 Percentages of participants that engaged in data science practices and process in the Pixar and Dreamworks Activity.
4.2 Final Projects
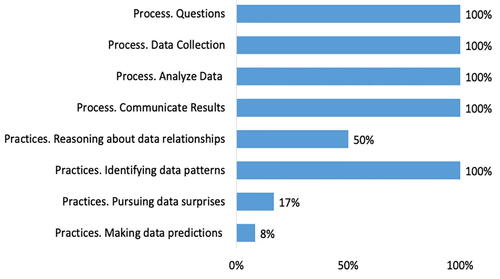
Using the coding system (), we coded the participants’ submitted final projects to identify the process and practices. For the final project, all participants engaged in all processes of data science, an increase from their participation in the Pixar versus Dreamworks activity (). By the final project, participants were able to formulate questions around topics of their own interest, analyze data related to their questions, provide appropriate visuals and calculations to support their investigations and communicate their findings through writing and verbally. Regarding practices, all participants engaged in identifying data patterns (100%), which was an increase from the previous activity (25%). However, participants did not engage as much in the practices of pursuing data surprises (17%), reasoning about data relationships (8%) and making data predictions (50%).
Fig. 8 Percentages of participants that engaged in data science practices and process in their Final Project.
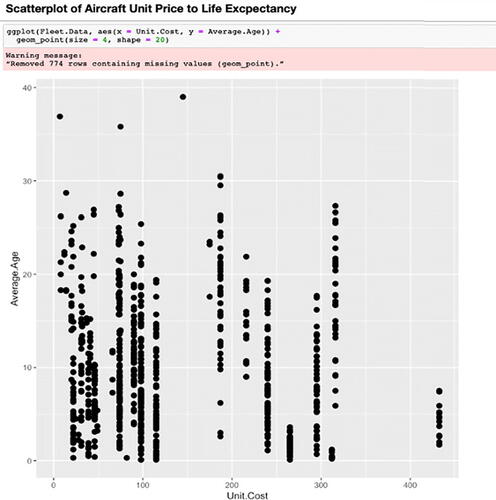
illustrates an example of a visualization used in a participant’s final project. Scatterplots were used to answer the question “Do more expensive aircraft last longer?” The participant wrote, “No, you can see that the more expensive aircraft, while bought less, last very little. I cannot figure out why airlines would want to buy an aircraft that they will remove from their fleet in very little time. One main reason that they might buy these aircraft is for the comfort, such as airlines that are known for cabin comfort, or fuel efficiency, as these aircraft are usually 2 aisle aircraft and therefore, need to carry more people on longer and more frequent routes.” The participant explained “In this scatterplot, you can see that most aircrafts that cost more don’t last as long, especially the ones over 400 million dollars. This is something I would not expect, as airlines would want their most expensive and fuel-efficient aircraft to last longer. However, airlines would still buy these planes because of their comfort, capacity, and fuel efficiency.” This participant provided reasoning about relationships observed in their data based on their questions. Overall, according to the coded results, participants’ work showed evidence of data practices including reasoning about data relationships, data surprises, and making data predictions.
Fig. 9 Example of one Participant’s Final Project Scatterplot.
4.3 Statistical Knowledge
Regarding statistical knowledge, participants understood effect size to be “used to determine how different two datasets are,” but could not explain or expand beyond the conceptual definition given (). Participants showed that they understood correlation to be a mutual relationship or association between two or more things. Many participants used the exact or similar terminology such as “connection” in the correct context when explaining correlations. For example, one participant stated, “When variables are correlated, it means they are connected in some way.” Another participant stated, “It means they have a connection between them.”
Fig. 10 Percentages of Participants that had a basic understanding of the statistics content covered.
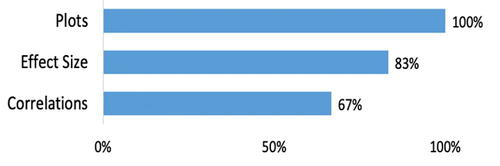
Participants also showed they understood how to choose a visual to display their data accurately and the importance of choosing an appropriate visual. For example, one participant wrote “The Scatterplot was good at showing correlations, the bar graph was good at showing how much of each thing there was, the histogram was showing what ranges were popular.” Overall, participants displayed a conceptual and pragmatic understanding of plots, effect size, and correlations.
4.3.1 Pre- and Post-surveys
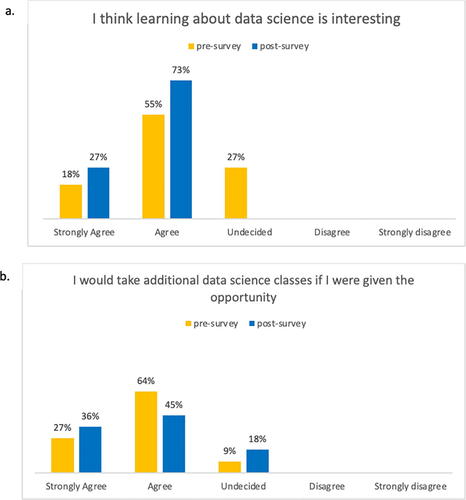
According to the pre- and post-surveys, by the end of the program, over half of the participants had a stronger interest in data science (). Although there was an increase in the number of participants agreeing to take another data science course if given the opportunity (27%), some were still undecided (18%, ).
Fig. 11 Pre- and post-surveys of participants attitudes toward data science.
5 Discussion
A data science program grounded in a constructionist (Papert Citation1980; Harel and Papert Citation1991), learner-centered design framework (Quintana et al. Citation1999) engaged participants in data science, programming, and statistics concepts. This extra-curricular program provided an opportunity for hands-on and interest-driven data science education. Because each activity required participants to produce an “object-to-think-with,” (Kafai Citation1995) such as code or a data visualization, participants could use their objects to refine their thinking. In the introductory activities, datasets were chosen to connect with participants’ daily lives; in the final project, participants chose their own datasets, allowing them to integrate data science with their personal interests. Similar to work conducted by Quintana and colleagues (Quintana et al. Citation1999), we focused on encouraging participants to persist in their projects by helping them find avenues of inquiry that were meaningful to them, and we focused on measuring and qualifying participants’ motivation, interest, and increased usage of data science process and practices to lay the foundation for future study.
Our results show that by participating in this designed curriculum that included programming and nonprogramming activities, these 11 male participants increased their engagement in several data science processes and practices, such as communicating results and identifying data patterns. However, there was no change in making data predictions or reasoning about data relationships. Moreover, some participants reasoned through their data but had some unaddressed misconceptions. We see evidence of this limited reasoning ability in the example final project (). The participant’s graph revealed that expensive airplanes did not last as long as cheaper airplanes, which caused confusion because, the participant did not consider that modern aircrafts are more expensive than older models due to inflation and increase in sophistication. In addition, the participant did not consider that more expensive aircrafts that are newer have not been used as long as the older models. These misconceptions can be attributed to participant’s age, lack of background knowledge and typical mistake novice learners make when interpreting visualizations. However, creating these types of educational programs provides experiences to engage deeper with visualizations to communicate better what is shown.
Due to the limited time as it relates to the final projects, there were few opportunities for feedback to provide minimal instruction about reasoning and reflection related to their explorations. In future redesigns of the curriculum, we will develop more activities for participants to practice reasoning and reflection when creating visualizations and making claims based on data. Moreover, while we used the coding system to evaluate the submitted work, assessment should extend beyond the deliverables themselves. Participants needed the opportunity to reflect on their own learning and their experiences throughout the entirety of the program.
Regarding learning statistical content, participants developed a conceptual understanding of these topics, but they lacked a deeper statistical understanding. However, the focus of the program was to provide participants an opportunity to participate in full data science cycles and engage in as many data science practices as possible. As a tradeoff, there was less of a focus on deeply understanding and more on performing the statistical procedures. As such, more opportunities to explore statistical content deeper and a more robust measurements of change in knowledge will be the focus of future studies to explore how participants can both engage in full data science cycles but also gain a statistical understanding.
Regarding participant’s attitudes toward data science, the survey results revealed that students were more interested in data science after participating in the enrichment program, but some students became undecided about taking more data science classes. This could be due to participants feeling overwhelmed with the amount of information provided in a short amount of time. The program may have felt quite daunting to participants, who had not been exposed to data science, text-based programming, and statistics concepts for data analyses. Gaining and communicating data insights can also be challenging as there are many ways to tell stories with a set of data. These options may have caused participants to have some misunderstandings when interpreting their data. Upon reflection, we could have constructed additional scaffolds and developed ways to help participants gain better data interpretation skills.
The final project required participants to find one dataset pertaining to a topic of interest (GAISE 3), create several different displays to tell the story behind the data (GAISE 4, 5), and present their work (GAISE 6). While we allotted four contact hours for participants to work on the final project, most of the time was spent looking for a dataset and cleaning the dataset so participants could work with it. Participants did not have the benefit of having the project span an entire semester to have time to revisit and improve upon it as their data science, statistical, and programming knowledge grew. We found that allowing participants to choose their own data increased interest and motivation for the final project.
As the field of data science continues to evolve, we anticipate this program will also adapt and grow to meet the ever-changing needs of younger learners. Changes to this program could include opportunities for participants to display their code to each other and provide peer feedback, add more opportunities for participants to work with multiple datasets in R, and feature more opportunities for creating data and allowing more space to interpret, compare, and discuss results. Additionally, we would like to design iterations of this course for a more diverse audience including participants with no previous programming experiences and those who are traditionally under-represented and under-served, particularly girls and students of color.
6 Conclusion
This program incorporated data science in a way to expose middle-school youth to using programming to explore, visualize and interpret data. In this study, we investigated how a constructionist, learner-centered designed data science educational program using the programming language R facilitated engagement with data science processes and practices. Participants engaged with statistical concepts and data science processes and practices using publicly available datasets. Our results suggest that by participating in this enrichment program, participants began to build a foundation of conceptual statistical knowledge, programming skills, and engaged in authentic data science processes and practices. We believe that our work presents a good starting point for educators, curriculum designers, and educational researchers to further explore how to engage K-12 students in statistics, programming, and data science skills in ways that are meaningful to students. Such research experiments centered on engagement and learning in data science will help educate youth in this highly valued and interdisciplinary field.
References
- Baumer, B. (2015), “A Data Science Course for Undergraduates: Thinking With Data,” The American Statistician, 69, 334–342. DOI: https://doi.org/10.1080/00031305.2015.1081105.
- Cleveland, W. S. (2014), “Data Science: An Action Plan for Expanding the Technical Areas of the Field of Statistics,” Statistical Analysis and Data Mining: The ASA Data Science Journal, 7, 414–417. DOI: https://doi.org/10.1002/sam.11239.
- Datta, S., and Nagabandi, V. (2017), “Integrating Data Science and R Programming at an Early Stage,” In 2017 IEEE 4th International Conference on Soft Computing & Machine Intelligence(ISCMI).
- Dryer, A., Walia, N., and Chattopadhyay, A. (2018), “A Middle-School Module for Introducing Data-Mining, Big-Data, Ethics and Privacy Using RapidMiner and a Hollywood Theme,” in Proceedings of the 49th ACM Technical Symposium on Computer Science Education – SIGCSE 18. DOI: https://doi.org/10.1145/3159450.3159553.
- Franklin, C., Kader, G., Mewborn, D., Moreno, J., Peck, R., Perry, M., and Scheaffer, R. (2007). Guidelines for assessment and instruction in statistics education (GAISE) report.
- Gould, R., Machado, S., Ong, C., Johnson, T., Molyneux, J., Nolen, S., Tangmunarunkit, H., Trusela, L., and Zanontian, L. (2016), “Teaching Data Science to Secondary Students the Mobilize Introduction to Data Science Curriculum,” in Promoting Understanding of Statistics about Society, ed. J. Engel, Proceedings of the IASE Roundtable Conference.
- Grolemund, G., and Wickham, H. (2016), “R For Data Science. OReilly Online Learning,” Available at https://www.oreilly.com/library/view/r-for-data/9781491910382/
- Hardin, J., Hoerl, R., Horton, N. J., Nolan, D., Baumer, B., Hall-Holt, O., Murrell, P., Peng, R., Roback, P., Temple Lang, D., and Ward, M. D. (2015), “Data Science in Statistics Curricula: Preparing Students to “Think with Data,” The American Statistician, 69, 343–353. DOI: https://doi.org/10.1080/00031305.2015.1077729.
- Harel, I., and Papert, S. (1991), Constructionism, Norwood, NJ: Ablex Pub. Corp.
- Heinemann, B. (2018), “Drafting a Data Science Curriculum for Secondary Schools,” in Proceedings of the 18th Koli Calling International Conference on Computing Education Research - Koli Calling 18. DOI: https://doi.org/10.1145/3279720.3279737.
- Jiang, S., and Kahn, J. (2019), “Data Wrangling Practices and Process in Modeling Family Migration Narratives with Big Data Visualization Technologies,” in International Conference on Computer Supported Collaborative Learning.
- Kafai, Y. B. (1995), Minds in Play: Computer Game Design as a Context for Children’s Learning, Mahwah, NJ: Erlbaum.
- Kluyver, T., Ragan-Kelley, B., Pérez, F., Granger, B., Bussonnier, M., Frederic, J., Kelley, K., Hamrick, J., Grout, J., Corlay, S., Ivanov, P., Avila, D., Abdalla, S., Willing, C., and The Jupyter Development Team (2016), “Jupyter Notebooks—A Publishing Format for Reproducible Computational Workflows,” in Positioning and Power in Academic Publishing: players, Agents and Agendas: proceedings of the 20th International Conference on Electronic Publishing, p. 87. Amsterdam: IOS Press.
- Lazar, N., and Franklin, C. (2015), “The Big Picture: Preparing Students for a Data-centric World,” CHANCE, 28, 43–45. DOI: https://doi.org/10.1080/09332480.2015.1120128.
- Lee, V. R., and Wilkerson, M. (2018), “Data use by Middle and Secondary Students in the Digital Age: A Status Report and Future Prospects,” Commissioned Paper for the National Academies of Sciences, Engineering, and Medicine, Board on Science Education, Committee on Science Investigations and Engineering Design for Grades 6–12. Washington, D.C.
- National Council of Teachers of Mathematics (NCTM). (2000), Principles and Standards for School Mathematics, Reston, VA: NCTM.
- Papert, S. (1980), Mindstorms. Children, Computers and Powerful Ideas, New York: Basic Books.
- Quintana, C., Eng, J., Carra, A., Wu, H., and Soloway, E. (1999), “Symphony: A Case Study in Extending Learner-Centered Design Through Process-Space Analysis,” In Human Factors in Computing Systems: CHI ’99 Conference Proceedings, Pittsburgh, PA: ACM Press.
- Satyanarayana, A. (2013), “Software Tools for Teaching Undergraduate Data Mining Course,” in American Society of Engineering Education Mid- Atlantic Fall Conference.
- Srikant, S., and Aggarwal, V. (2017), “Introducing Data Science to School Kids,” in Proceedings of the 2017 ACM SIGCSE Technical Symposium on Computer Science Education - SIGCSE 17.
- Statistical Thinking: The Bedrock of Data Science. (2013), HuffPost. Available at www.huffpost.com/entry/statistical-thinking-the-bedrock-of-data-science_b_3651121.
- Stephenson, C., Cooper, S., Owens, B. B., and Gal-Ezer, J. (2012), “The New CSTA K–12 Computer Science Standards,” in Proceedings of the 17th ACM Annual Conference on Innovation and Technology in Computer Science Education - ITiCSE 12.
- Thompson, J., and Wu, S. P. (2020), “The Use of Computer Programming in a Secondary Mathematics Class,” in Proceedings of ASEE Annual Conference.
- Wilensky, U. (2003), “Statistical Mechanics for Secondary School: The GasLab Multi-Agent Modeling Toolkit,” International Journal of Computers for Mathematical Learning, 8, 1–41. DOI: https://doi.org/10.1023/A:1025651502936.