 ?Mathematical formulae have been encoded as MathML and are displayed in this HTML version using MathJax in order to improve their display. Uncheck the box to turn MathJax off. This feature requires Javascript. Click on a formula to zoom.
Abstract
Statistical literacy is key in this heavily polarized information age for an informed and critical citizenry to make sense of arguments in the media and society. The responsibility of developing statistical literacy is often left to the K-12 mathematics curriculum. In this article, we discuss our investigation of K-8 students’ current opportunities to learn statistics created by state mathematics standards. We analyze the standards for alignment to the Guidelines for the Assessment and Instruction in Statistics Education (GAISE II) PreK-12 report and summarize the conceptual themes that emerged. We found that while states provide K-8 students opportunities to analyze and interpret data, they do not offer many opportunities for students to engage in formulating questions and collecting/considering data. We discuss the implications of the findings for policy makers and researchers and provide recommendations for policy makers and standards writers.
Introduction
Now, more than ever, people have access to data at their fingertips. They are presented with data visualizations through news outlets, social media, corporations, and politicians. Such visualizations can distill significant amounts of information and be challenging to interpret. For instance, the logarithmic representations of COVID-19 infection rates were misinterpreted by many, which may have contributed to lax feelings toward safety measures like social distancing and mask-wearing (Robson Citation2020). There have been many such instances in the pandemic that have highlighted issues with the statistical literacy of the citizenry. However, there is also hope during this time for statistical literacy. Real-time data is made publicly available by independent organizations at unprecedented rates, giving people agency over exploring the data themselves. Statistically literate citizens, particularly statisticians and data scientists, have used such data to push back on anecdotal arguments and provide more context to the data and their representations. Social media feeds are abuzz with such examples, such as animated representations that show the elements of “flattening the curve” while “raising the line” at the start of the COVID-19 pandemic in the U.S. (Barclay, Scott, and Animashaun Citation2020). We (the authors) do not see statistics as a savior that will solve all our current woes. However, we do see a statistically literate citizenry as crucial to sustaining democratic societies, starting with being critical consumers of data and data-based arguments. As was famously said by Kofi Annan, “Literacy unlocks the door to learning throughout life, is essential to development and health, and opens the way for democratic participation and active citizenship” (United Nations Citation2003). We consider statistical literacy as part of this literacy. Through the perspective that the K-12 public education system’s goal is to prepare children to become critical citizens (Westheimer and Kahne Citation2004) in their democratic society, we argue that developing children’s statistical literacy should be a part of their K-12 educational experience.
Typically, the role of statistics in the K-12 school curriculum is as a content domain embedded in the school mathematics curriculum (Ben-Zvi and Garfield Citation2008; National Council of Teachers of Mathematics (NCTM) Citation2000; National Governors Association Center for Best Practices [NGA Center] and Council of Chief State School Officers [CCSSO] 2010; Scheaffer and Jacobbe Citation2014). There have also been arguments for including statistics across the curriculum (Usiskin Citation2014), and in the science curriculum, given the Next Generation Science Standards (NGSS Lead States Citation2013). However, statistics has largely remained in the purview of mathematics curriculum. Recognizing the importance of emphasizing statistical literacy at the school level, the American Statistical Association (ASA) supported the creation of a report on the Guidelines for Instruction and Assessment in Statistics Education Pre-K-12 (GAISE; Franklin et al. Citation2007). The GAISE Pre-K-12 report was published around the time that the Common Core State Standards for Mathematics (CCSSM; NGA Center and CCSSO 2010) were being developed and seemed to have some impact on the grades 6–12 content standards. This is evidenced by the focus on a four-step investigative process for teaching statistics in the progression documents for the CCSSM (The Common Core Standards Writing Team Citation2011), as well as the emphasis on simulation. However, the CCSSM did not include a statistics strand in grades K-5, which was viewed by researchers as a misstep (Confrey Citation2010).
Despite the importance of students’ development of statistical literacy, there has been almost no study of how this is supported at the policy level. In particular, there have only been two studies done that center on the opportunities that students have to learn statistics in the mathematics curriculum standards (i.e., Dingman et al. Citation2013; Newton, Horvath, and Dietiker Citation2011). Many states have since revisited and changed their mathematics standards due to significant backlash to the CCSSM (Orrill Citation2016) creating a need for new investigation of the statistics content in state mathematics standards.
Research Goals and Questions
The overarching goal of this study is to investigate students’ opportunities to learn (OTL) statistics at a policy level (i.e., state mathematics standards) through the lens of the ASA’s recently updated Pre-K-12 Guidelines for Instruction and Assessment in Statistics Education (GAISE II; Bargagliotti et al. Citation2020). Specifically, we investigate the research question: What OTL statistics are created by state K-8 mathematics standards in the United States?
Background
Official Curriculum
Curriculum is a widely used term with a plethora of different meanings. In mathematics education, textbooks, standards, and policy documents are often grouped into a category of curriculum referred to as written curriculum, which impacts the enacted curriculum that students experience (Remillard Citation2000; Stein, Remillard, and Smith Citation2007; Stein and Smith Citation2010; Tarr et al. Citation2008). We draw from Remillard and Heck (Citation2014) definitions and framework for mathematics curriculum in the U.S., with a focus on official curriculum. Official curriculum is defined as the “curriculum that governing agencies [use to] authorize expectations for student learning or performance and, in some cases, the instructional or curricular resources, and pathways for learning to be employed” (p. 708). The key components of official curriculum are described as “(a) curricular aims and objectives, (b) content of consequential assessments, and (c) the designated curriculum” (p. 708). While content on consequential assessments and designated curriculum in the form of instructional materials such as textbooks are of great importance, we focus on the curricular aims and objectives component of official curriculum by studying the content standards for states in the U.S. in use as of the Fall of 2020.
Standards are important to consider because teacher and student accountability systems are based on standards, usually in the form of state standardized tests. Standards in education come from the desire to create equal educational opportunities for all students by creating a baseline of what students should be taught (McClure Citation2005). They also represent compromises “over what should count as legitimate knowledge, about what is appropriate pedagogy and evaluation, and ultimately about what norms and values should guide the schooling process itself” (Apple Citation1992, p. 415). Mathematics standards are particularly important to consider because of the emphasis placed on mathematics achievement at the national level by legislation such as No Child Left Behind, international comparison studies such as the Trends in International Mathematics and Science Study (TIMSS), and mathematics’ status as a gatekeeper (Martin, Gholson, and Leonard Citation2010). Because every state in the U.S. has authority over their own education system, the standards of what is considered mathematics in the school curriculum can differ from state to state, as there is no federal level official curriculum (Schmidt and McKnight Citation2012).
Though there is no federal level official curriculum, there have been several attempts at creating coherence across states in the mathematics curriculum. Most notably in 2009, 48 states signed on to implement the CCSSM (NGA Center and CCSSO 2010). This effort represents the first time in U.S. history that a majority of states committed to use the same set of standards and furthermore to tie common assessments to those standards (Goertz Citation2010). The introduction of what was considered by some to be a de facto national curriculum was highly publicized and politicized and continues to spark significant controversy. Several states have changed their stance on adopting the CCSSM, with some states dropping the standards all together and others choosing to modify them (Achieve Citation2017; Orrill Citation2016).
Guidelines for the Assessment and Instruction in Statistics Education
To help investigate state standard we draw upon the GAISE Pre-K-12 reports (Bargagliotti et al. Citation2020; Franklin et al. Citation2007), which are policy documents that come from the statistics education community and were written explicitly with the development of statistical literacy in school mathematics curriculum in mind. The GAISE reports are research based and the most recent GAISE II added consideration of data science in Pre-K-12. As a note, there is a GAISE College Report that will not be considered in this analysis (Carver et al. Citation2016). The GAISE II report incorporates a framework for statistical literacy, that is, structured hierarchically with three levels of development (A, B, and C) and is based around the statistical investigative cycle, which consists of four main elements: formulating statistical investigative questions, collecting/considering data, analyzing data, and interpreting results (see ). The levels of development do not necessarily align with particular grade levels (though there is the common association of A-Elementary, B-Middle School, C-High School), but state that a student should not progress to levels B or C without first developing an understanding of the four elements at the earlier level, independent of age.
Table 1 Summary of the elements of the statistical investigative cycle (Bargagliotti et al. Citation2020).
The general framework of GAISE II, including the statistical investigative process and developmental levels, has remained the same as the original framework offered in GAISE. Changes have been made to elaborate on aspects of the framework, update examples, and update language based on recent research. The authors provide highlights of these changes in the new report (see Bargagliotti et al. Citation2020, p. 2). One of the most notable changes in the new framework is the shift to include data science. Data science has not formally been written into required K-12 curricula in any state. However, that is changing in some locations—most notably California has allowed a course in data science to be considered a high school mathematics course (Los Angeles Unified School District n.d.). Furthermore, the current president of the ASA recently published an article about the importance of children learning data science starting in kindergarten (Martinez and LaLonde Citation2020). The recent inclusion of data science concepts in the K-8 educational sphere is a part of the ‘greater data science for all’ campaigns aimed at preparing students to use these skills in the workforce.
Opportunities to Learn: Statistics
The theoretical framework we are drawing upon for this study is opportunities to learn (OTL) developed by Schmidt and colleagues (Schmidt, Wang, and McKnight Citation2005; Schmidt and McKnight Citation2012).
Opportunity to learn is a commonsense idea-for a student to learn something such as how to add fractions, he or she must have had an opportunity to learn that topic. This can take place out of school or in school. It can be a chance experience or a planned learning experience in school. For our purposes, opportunity to learn is defined as those opportunities related to the coverage of content that happen because of planned instructional activities in school. (Schmidt and McKnight Citation2012, p. 11)
Drawing from this definition we concentrate on the opportunities for students to learn the concepts and practices associated with statistical literacy in U.S. state mathematics standards.
In our review of the literature, we came across only two previous studies of the OTL statistics in state mathematics standards in the U.S., which we briefly summarize here to create a basis for comparison to our results. Newton, Horvath, and Dietiker (Citation2011) studied the grade level expectations (GLEs) of the K-8 mathematics standards in 41 states. The GAISE framework served as the basis for their coding. The authors did not operationalize what counted as a GLE, but they coded each using the elements of a statistical investigation (i.e., formulate question, collect data, analyze data, interpret data). They found greater emphasis on analyzing and interpreting data than on formulating questions and collecting data. In particular, less than a third of states had students formulating questions. Though not a large emphasis, collecting data standards were written into all 41 states’ standards documents in at least one grade level. Within the data analysis element, states included more standards that prioritized different types of visual representations over numerical. At the interpret stage, states concentrated on standards that asked students to predict an outcome. The researchers also state that words in some standards with distinct statistical definitions were used interchangeably (e.g., “conclusions,” “predictions,” and “inferences”). Furthermore, they point to a lack of focus on statistical variability in the state standards.
Newton, Horvath, and Dietiker (Citation2011) also identified two types of GLEs: “Type I GLEs expect students to complete some process (e.g., construct a bar graph) and Type II GLEs expect students to evaluate some process (e.g., select the most appropriate representation for a given set of data)” (p. 122). The authors place more importance on Type II GLEs, as they require students to go beyond the immediacy of the data presented to them to draw conclusions and make predictions and prepare students to become “competent consumer[s] of statistical information” (Newton, Horvath, and Dietiker Citation2011, p. 157). Through their analysis, the researchers saw that most Type II GLEs appeared in the collect data and analyze data phases, and the number of occurrences by grade level increase as students enter middle grade levels. Overall, Newton, Horvath, and Dietiker (Citation2011) found that there were more Type I than Type II GLEs, meaning students are more often expected to complete statistical processes rather than evaluate them.
In 2013, Dingman, Teuscher, Newton, and Kasmer revisited mathematics standards in the United States to compare pre-CCSSM standards to the CCSSM. Although the scope of the 2013 comparison was larger than Newton, Horvath, and Dietiker’s (Citation2011) investigation and included all math standards, the researchers utilized the same approach to analyze the statistics standards in the CCSSM. The results were then compared to the findings from their 2011 study. The researchers found that the CCSSM placed more emphasis on analyzing data and less on interpreting results when contrasted with pre-CCSSM standards (Dingman et al. Citation2013). While both sets of standards included more Type I than Type II standards, the CCSSM included 50% Type II standards compared to 25% in the pre-CCSSM standards, meaning the CCSSM increased the opportunities for students to evaluate statistical processes.
Methodology
Data Sources and Collection
The data for this study are the official curriculum of states in the U.S. To find official curriculum we began by locating the mathematics content standards for each of the 50 states, Washington D.C., and the Department of Defense. States that used CCSSM verbatim for statistics-related standards were excluded from the data collection phase, but they were included in the analysis by weighting the CCSSM standards in later frequency analyses based on the number of states using identical standards. These states were identified in the following ways:
The link to the standards took the viewer directly to the CCSS website
The website stated that the CCSSM were adopted in full and were linked to those standards
If the website did not have a direct statement about CCSSM language, but the state had initially adopted the CCSSM (NGA Center and CCSSO 2010), statistics standards were compared to CCSSM side-by-side. If there were changes in verbiage (i.e., categories, standard language, additional standards, examples provided), the state’s standards were included in the data collection phase (e.g., Colorado). If changes made did not alter the meanings of any statistics standards, the state was excluded from the data collection.
State standards that were similar to the CCSSM, but different in one or more substantial ways, were included in the analysis (). The following 21 states’ statistics-related standards were indistinguishable from the CCSSM: California, Connecticut, Delaware, Hawaii, Idaho, Illinois, Iowa, Maryland, Michigan, Nevada, New Hampshire, New Jersey, New Mexico, Oregon, Rhode Island, Utah, Vermont, Washington, Wisconsin, Washington D.C., Department of Defense.
Identifying Learning Expectancies
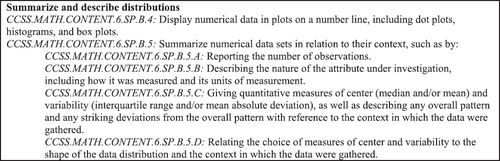
We operationalize OTL as those created through state curriculum standards. Because states use different notations and structures for their standards, we analyzed what we refer to as learning expectancies (LEs). LEs represent the lowest unit of standard designation that provides a unique OTL statistics within each official standards document. For example, Virginia’s standards only detail one level of standards, so each was taken as a unique LE. If we consider the CCSSM, each topic or cluster may include both standards and sub-standards. shows the “summarize and describe distributions” cluster, followed by two standards and four sub-standards. In this case, the standard CCSS.MATH.CONTENT.6.SPB.4 would be considered a LE because it is a standalone learning outcome. The standard CCSS.MATH.CONTENT.6.SPB.5 encompasses four sub-standards that elaborate on the parent-level standard. Because the sub-standards are meant to clarify the parent-level standard’s language, the sub-standards were considered LEs and the parent-level standard was not considered in the analysis on its own.
Fig. 1 Summarize and describe distribution cluster from the sixth-grade CCSSM.
In some cases, such as Alabama and Florida, sub-standards that were nested under parent-level standards provided additional unique learning outcomes, so both the parent-level and sub-standards were considered LEs in the analysis. Each set of state standards was independently reviewed by both members of the research team and then compared to ensure each unique LE was considered (see Supplementary Materials). Many states also provided supplemental materials to go along with the standards, which Remillard and Heck (Citation2014) refer to as designated curriculum; these materials vary drastically by state and are not part of the official curriculum, but instead provide further guidance as to how to teach the standards. Because of the variability in such materials and their supplemental nature as add-on versus being a part of the official curriculum, we did not include them in our analysis.
Drawing Boundaries of What Counts as Statistics
There are no clear-cut boundaries between what is statistics and what is mathematics; however, for the practical purposes of the analysis for this study, such boundaries had to be drawn. We chose to draw from the GAISE II report and the major differences between mathematics and statistics discussed in the literature (Cobb and Moore Citation1997; Groth Citation2013) to identify what we considered statistics standards. We began by including any LEs that were explicitly stated as statistics and probability standards. Based on GAISE II, we then excluded some probability standards that only focused on the mathematical aspects of theoretical probabilities. In the CCSSM, Statistics and Probability was replaced as a Measurement and Data strand in the K-5 standards. We included standards from this strand where appropriate.
Analytical Framework
In order to analyze the data in a way that is relevant to policy makers, statistics education researchers, and mathematics educators, as well as to connect to past research, we chose to use the GAISE II framework as our lens on the analysis, coding every LE for developmental level and element of the investigative process. A description of the four-step investigative process and its corresponding developmental levels were provided earlier in . To see the specific descriptions of the process elements and developmental levels we used to code the data, reference the GAISE II report (Bargagliotti et al. Citation2020, pp. 16–19). Similar to Newton, Horvath, and Dietiker (Citation2011), we used a binary coding (see ). None of the categories were considered mutually exclusive, so a LE could be classified as multiple process elements or developmental levels.
Table 2 Example of coding of CCSSM LEs based on the GAISE II Framework.
As a note, we used the GAISE II report (Bargagliotti et al. Citation2020) to determine where standards fell in the four different process elements, whereas previous studies (i.e., Dingman et al. Citation2013; Newton, Horvath, and Dietiker Citation2011) used the original GAISE PreK-12 report (Franklin et al. Citation2007). However, in reviewing the reports’ framework summary tables side-by-side, there were no significant differences in the elements’ characteristics between the two reports. Therefore, any comparisons between previous studies and this one will still reflect the same GAISE framework. We went beyond the previous studies by considering the developmental level of each standard. Because we are using the GAISE II report, we also wanted to specifically address the highlights of the new report as described by the authors to look for their presence in the standards. We focused on the first six highlighted recommendations that focus on shifts in content and excluded the last highlight that focuses on assessment, which is not within the scope of what content standards address. To accomplish this task, we did a second round of coding looking specifically for these elements, which we describe in detail in .
Table 3 Analytic Approaches to investigating the OTL relative to the highlights of the GAISE II report.
From our analysis of the LEs through the lens of the GAISE II framework, we noticed significant similarities between the LEs from each state by grade-level. To present a richer description of the OTL statistics formed by the standards, we did an additional analysis where we qualitatively coded the common content of the LEs by grade level. Because we found the CCSSM to be prevalent in so many states’ standards, we used the CCSSM LEs as our initial set of codes. For any state that had identical wording to the CCSSM those LEs were coded as the same. Many states had LEs very similar to the CCSSM, but with slight word changes or the inclusion or exclusion of examples, which we coded as similar. Some states took one CCSSM LE and broke it into several different LEs. In those cases, we counted the LEs all together as the state having a similar LE to the CCSSM. There were also many LEs that differed from the CCSSM, which we initially coded as different. After identifying all the same, similar, and different LEs, we did another round of coding looking only at the different LEs by grade. In this round of coding, we looked for commonalities in the content of the different LEs to identify common learning expectancies across states outside of the CCSSM LEs. For each grade, at least five states (about 10% of all states) had to have a similar content LE for that LE to be considered a “common LE.” For example, in fourth grade the only LE in the CCSSM is about using line graphs to display measurement data of fractional units; however, nine different states have an LE that involves creating and/or interpreting bar graphs in addition to line graphs. You can see our complete analysis in the supplementary materials including LEs that were unique to states. It is also important to note that several states have similar LEs to the CCSSM, but that predate it or never signed onto the CCSSM (Minnesota, Virginia, Texas, Alaska, and Nebraska) meaning that they did not modify the CCSSM.
Lastly, we decided not to pursue an analysis of Type I (complete) versus Type II (evaluate) LEs, like previous studies, because an initial coding round resulted in mostly Type I LEs. Additionally, our focus was on using the updated GAISE framework as an analytic lens and Type I and II LEs were not present within this framework.
Findings
In an effort to answer our research question, What OTL statistics are created by state K-8 mathematics standards in the United States?, we have separated our analysis of learning expectancies (LEs) into multiple sections. We begin with a broad overview of the descriptive statistics on the number of overall LEs in grades K-8 by state, followed by a breakdown of number of LEs by grade level across all states. Next, we dig into grade-level commonalities that emerged related to the concepts that students are expected to learn. From there, we analyze the proportions of LEs related to the GAISE II statistical investigative process elements (i.e., formulate questions, collect and consider data, analyze data, and interpret results) and developmental levels (i.e., A, B, and C). We end by presenting our findings regarding the GAISE II highlighted changes.
Total LEs by State
In total, there are 1569 LEs across the 50 states, Washington D.C., and the Department of Defense (we will refer to these collectively as states for simplicity from here on). When we flattened the 21 states using the CCSSM to count as only one state, we identified 1009 LEs. However, unless explicitly stated, all analyses will focus on all 52 states. States average approximately 30 LEs total for grades K-8 (SD = 6.7) with a median of 28 LEs (see ). The 21 states that follow the CCSSM with fidelity have 28 LEs for grades K-8. States range from a low of 15 LEs in Minnesota to a high of 47 LEs in Kentucky. However, the number of concepts covered in a single LE varies drastically from state to state. For instance, see Kentucky’s grade 3 LEs shown in . The issue of the conceptual grain size of the LEs is a limitation of this approach and is a challenge faced by any policy analysis across states due to the decentralized nature of the education system in the United States.
Fig. 2 Boxplots of the total number of K-8 LEs by state for all states (n = 52) and for states that are not CCSSM verbatim ().
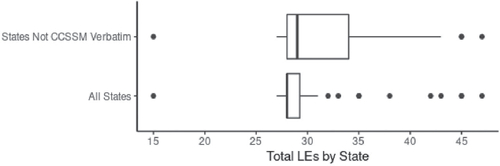
Table 4 Comparison of Kentucky Grade 3 LEs and comparative CCSSM Grade 3 LEs.
Total LEs by State and Grade Level
States also differ in the number of LEs incorporated in each grade level; in some cases, individual states have no LEs for a grade level and in others, states include as many as 13 LEs in a grade level (see ). The least number of LEs for each state are typically in first, fourth, and fifth grades. There is a substantial increase in number of LEs between elementary and middle school, likely due to the inclusion of a Statistics and Probability content strand in most states starting in grade six, as well as greater variability in the number of LEs included in each grade level.
Table 5 Descriptive statistics for the number of LEs in each state by grade level for all states (n = 52) and for states that are not CCSSM verbatim (n = 31) in parentheses when different.
Common LEs by Grade Level
There is no official federal curriculum in the U.S.; however, when we began looking at the LEs by grade, we found the CCSSM LEs capture most of the concepts that students might have an OTL. Therefore, using the CCSSM as our starting point, we describe the common LEs across states by grade to provide a richer picture of what OTL statistics students commonly have in the U.S. For grades K-5, there were 14 common LEs, five of which differed from the CCSSM (see ).
Table 6 A descriptive summary of the common LEs for grades K-5 with counts of the numbers of states that have the same wording (same), similar wording, or did not have the LE (absent).
There are some notable divergences from the common LEs in the K-5 grade band. One is Kentucky, which asks students to pose questions as early as first grade with, “Pose a question that can be answered by gathering data” and continues through the grade levels. Kentucky is also the only state to mention using technology for graphs in this grade band. These are notable divergences because of their alignment with the GAISE II. Virginia also stood out by introducing probability the earliest. Additionally, probability was not commonly present in LEs in this grade band, possibly due the removal of such standards at the elementary level in the CCSSM. Another notable addition is Montana, which includes in several LEs that data should be “within cultural contexts including those of Montana American Indians.” Montana is the only state that makes such contextual specification. It is further notable because of its focus on Indigenous peoples, which is a topic often avoided in K-12 curriculum. All unique LEs for the state can be seen in the supplementary materials.
In the 6–8 grade band, there is a considerable increase in the number of themes present with eight themes each in sixth and seventh grades and four in eighth grade (). We found less variation from the CCSSM at this grade band than we saw in grades K-5. Some notable exceptions are the inclusion of pie graphs by several states in the types of graphs used to analyze data.
Table 7 A descriptive summary of the common LEs for grades 6–8 with counts of the numbers of states that have the same wording (same), similar wording, or did not have the LE (absent).
Opportunities to Learn Statistics in Relation to GAISE II Statistical Investigative Process Elements
In considering the OTL statistics relative to the statistical investigative process, there is a substantial difference between the presence of each element in the total number of K-8 LEs (n = 1569): 81.3% of LEs are coded as analyze, 47.1% are coded as interpret, 32.3% are coded as collect and consider, and only 6.4% are coded as formulate question. This is consistent with findings from studies of written curriculum (Weiland Citation2019; Bargagliotti Citation2012; Jones et al. Citation2015; Jones and Jacobbe Citation2014). It is also important to note that almost 56% of the LEs are coded with two or more elements.
GAISE II Statistical Investigative Process by State and Grade Level
The least number of LEs per state occurs in the elementary school grade levels. For instance, grade one students encounter statistics through approximately one LE per state, but typically gain exposure to three out of four process elements (i.e., formulate question, analyze, and interpret elements) through that LE. The other elementary grade levels include an average of two LEs per state (see ) that give students opportunities to learn how to collect and analyze data. As students enter the middle grade levels, the number of OTL statistics considerably increases based on the large increase of the number of LEs, as does the emphasis on analysis and interpretation. Seventh grade includes the greatest number of collect (M = 3.87, SD = 1.19) and interpret (M = 4.85, SD = 1.83) LEs per state. Only grade six LEs include all four elements across most states (n = 44). Interestingly, formulate question is evenly distributed between elementary and middle school grade levels, but still averages out to one LE overall per state for grade K-8.
GAISE II Statistical Investigative Process Overlap
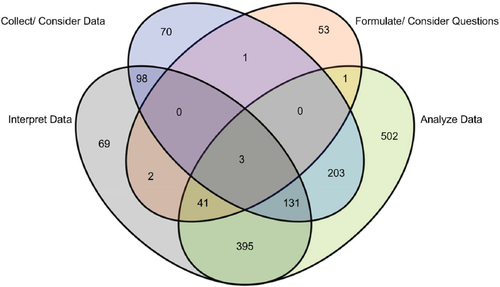
An important aspect of the statistical investigative process is that the elements are all interlinked, making it important for students to experience the elements in combination, so such linkages are made explicit. Almost 56% of the total LEs (n = 1569) link multiple statistical process elements (see supplemental materials for detailed breakdown). The statistical process element most often included in LEs is analyze across all grade levels, with 1276 occurrences. Of these analyze occurrences, 774 overlap with one or more process elements (60.7%). However, the element with the greatest percentage of overlap with the others is interpret (90.7%), with 670 of the 739 interpret occurrences overlapping with other elements. In comparison, 48 formulate question LEs were linked with other elements, accounting for 47.5% of formulate question LEs. shows the number of total LEs for each connection between the four elements of the investigative process. Additionally, only three LEs cover all four elements of the investigative process and all three appear in Indiana’s LEs. Indiana also links the greatest percentage of process elements (74.1%), whereas Texas connects the least percentage (21.1%).
Fig. 3 Venn Diagram of the total number of LEs for each possible connection between the four elements of the statistical investigative process. Note the areas are not proportional to the counts.
Currently, all grade levels have overlap between the process elements, with grade one as the greatest proportion – 80.6% of the LEs share at least two process elements. Though most states include one first grade LE, this one LE incorporates the elements of formulate question, analyze, and interpret. In grade five, only 15.9% of LEs overlap these elements, with most LEs focusing solely on the analyze element. In Kindergarten, grade two, and grade three, the most common combination is between the collect and analyze elements. Grades four through eight have the most overlap between the analyze and interpret elements; overall, LEs that link analyze and interpret account for 36.3% of all the 1569 LEs for statistics.
Opportunities to Learn Statistics in Relation to GAISE II Developmental Levels
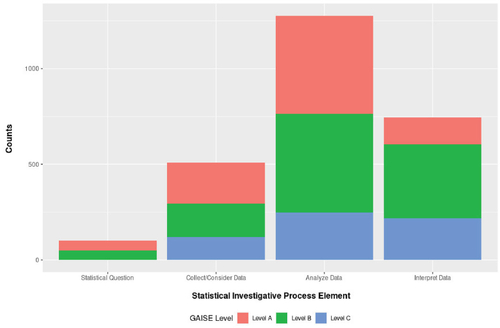
Approximately 38% of all 1569 LEs are at Developmental Level A, 44% are at Level B, 18% are at Level C, and 1% have a developmental level that is unclear, typically due to vague wording. Level A LEs are clustered in the elementary grade levels; most of these LEs occur in grades two (19.22%) and three (19.56%). The majority of the LEs at Level B are in sixth grade, and seventh grade contains most of the Level C LEs. Generally, as the LEs progress from grade to grade, the developmental levels follow suit. By seventh grade, there are no LEs at Level A. This progression is consistent with the GAISE II report and supports the move to Level C LEs in high school. Because formulate question LEs are concentrated in grades one and six, they are mainly split between Levels A and B. Analyze LEs are also evenly split between Levels A and B (see ). Collect LEs are most prevalent at the lowest Level A, but are notably present in Levels B and C. Interpret LEs are mostly situated at Level B, which may mean that teachers will expect students to interpret data at a developmentally higher level than they have been prepared for.
Fig. 4 Stacked bar graph of total LEs for each statistical investigative process element by GAISE developmental level ().
Highlights of the GAISE II Report Represented in the OTL Statistics Presented in the LEs
In relation to the first new highlight of the GAISE II report, there are 101 question-related LEs across the 1569 LEs and almost half are associated with at least one other process element. Of the 875 LEs that link at least two elements, question-related LEs make up 48 of them, but this accounts for almost half of the formulate question LEs. However, almost all question-related LEs are concentrated into only two grade levels (Grades 1 and 6), which makes students’ opportunities to formulate questions uneven across grade levels. Although 199 LEs reference the word “question,” 98 of these LEs did not rise to the level of the GAISE II framework’s definition of the formulate question element. Other LEs include asking and answering questions that focus on other process elements (e.g., Ask and answer questions about the total number of data points in organized data). LEs that reference questions that are not statistical in nature do not specify the type of question the student should be asking or answering (e.g., Use data shown in a line plot to answer questions). These LEs utilize vague language that may be interpreted in a non-statistical way.
The recommendation for the deliberate inclusion of variable types other than categorical and quantitative in the GAISE II framework has not been incorporated into state LEs yet. A search for these added variables resulted in two LEs that reference “pictorial” representations in Alabama, but focus was on the traditional pictograph. In addition, the terms “data cleaning” and “structuring” are not mentioned in state LEs. However, 106 LEs across 50 out of the 52 states mention organizing data, and these LEs are spread throughout all K-8 grade levels.
The recommendation for the consideration of multivariate data is also not yet taken up in the standards. There are 90 LEs that include the word “variable,” but an additional search for “multivariate” or “three” or more variables did not yield any results. As a result, students may not be exposed to multivariate data in grades K-8 and will not have the OTL how to manipulate multiple variables in one set of data. This may also limit their ability to understand data visualizations that incorporate multiple variables that are common in media today.
Probability taken up in the LEs can be described by the CCSSM LEs, which were discussed earlier. In total, there are 154 LEs that include the term “probability” or “probabilities.” Of these LEs, only one LE in Virginia is at an elementary grade level. These LEs ask students to find, approximate, or predict probability; develop a probability model; and compare theoretical probability to experimental probability. Additionally, 15 of these LEs ask students to use “random digits” to approximate probabilities. A total of 92 LEs mention “simulate” or “simulation” in the middle grade levels, which are used for experimental probabilities. Lastly, while no state uses the term “uncertainty,” Nebraska’s LEs include one LE that mentions “certain” in probabilistic language.
The incorporation of technology into statistics is present in some LEs, but overall, it is relatively absent. A search for “technology,” “spreadsheet,” “simulate,” “tool,” and “calculator” gave 101 unique results spread across all states except Nebraska, Virginia, and Wyoming. The state with the largest focus on technology LEs is Minnesota, the only state that last updated their LEs before the CCSSM were developed, with 7 out of 15 LEs referencing some form of technology. The focus of the 101 LEs across the states is on organizing and creating appropriate visualizations for a dataset, as well as using simulations to generate multiple random samples to make predictions about populations. Again, the only state that deviates from this is Minnesota—the emphasis of their technology standards is on organizing and displaying data, as well as using spreadsheet features to randomize data and find measures of central tendency. With the exception of four results, all technology-oriented LEs exist in the middle grade levels. This, in combination with large influx of LEs in middle school, may limit students’ ability to learn and appropriately use technology to manipulate and analyze data. Additional searches of “CAS,” “app,” “computer,” “software,” and “program” yielded no results.
Communicating statistical arguments and results to others is an important aspect of statistical literacy but is not commonly present in the LEs. Of the 739 interpret LEs, there is no explicit mention of communicating information to others. A word search for the terms “communicate,” “report,” “present,” “people,” “others,” and “verbal” gave 25 applicable results; two LEs appeared in the search for people, but not in the context of communicating information. The LEs that appeared in this search used vague language for communication; for example, one LE states, “reporting the number of observations” (Arkansas, Grade 6). The LE does not specify how the student will report the observations or to whom. It is possible that some of these LEs may involve communication with individuals other than the student’s teacher, but it is not explicitly stated. This de-emphasis on communication may be because of the mathematical process standards most states include. In these process standards, students are asked to construct arguments, critique others’ reasoning, and communicate mathematical ideas and reasoning.
Discussion
Overall, current OTL statistics in state standards documents have been significantly impacted by the development and adoption of the CCSSM. Themes that emerged through our analysis of the CCSSM LEs were mostly consistent with those found in other states, despite some states’ rewriting of their standards in the past five years. This finding is consistent with the analysis done of the CCSSM standards broadly by Achieve (Citation2017). Most changes we found involved a separation of larger LEs into smaller, more discrete LEs, as well as word changes that often did not change the meaning or scope of the LE. As a result of these smaller LEs, some states offered less links between statistical investigative process elements, but did provide educators with more succinct, targeted LEs in each state.
Though LE content has been heavily influenced by the CCSSM, we found different structures for organizing LEs throughout the different states included in our analysis. Most states followed a format that first listed a content strand, which encompassed content clusters. These clusters included standards and if necessary, sub-standards to delve into the concept or skill. As stated above, some states broke down CCSSM standards into smaller ones. Alabama incorporated multiple instances where the top-level standard and the sub-standards below it discussed different aspects of a concept or skill, requiring an analysis of each, whereas other states treated sub-standards as extensions of the top-level standard. Pennsylvania included “eligible content” below their standards. The “eligible content” differs slightly from sub-standards because the same ones may appear under multiple standards. By doing this, the standards writers in Pennsylvania aimed to highlight the relationship between different LEs. While each of these formatting methods has their strengths and rationales, they create inconsistent grain-size OTL statistics within state standards documents.
Across all states, with the exception of Kentucky, we found a lack of formulate question LEs. While only three states did not include question LEs, most states relegated this element of the statistical investigative process to one or two grades in K-8. This missing component in the standards documents may leave students at a disadvantage when attempting to identify situations with variability and to critically analyze data with a statistical question in mind. As questioning is a key guiding element in the investigative process, it is also important to determine appropriate data to collect, as well data gathering strategies to aid in answering the question posed (Wild and Pfannkuch Citation1999). Unfortunately, our analysis revealed that only Kentucky and Indiana purposefully connected the formulate question and collect elements, showing an area in need of more coherence.
A component that has been written into the standards for 11 out of the 31 non-CCSSM states analyzed is the circle graph or pie chart visualization. This type of data display is discouraged by statisticians as it can be difficult to identify how sectors differ in size and can be difficult to read if too many items are represented in the same chart. Instead, practitioners recommend the use of bar graphs to display the types of data that would be displayed in a circle graph. Despite this, even states like Nebraska and Virginia who have recently updated their standards have still incorporated circle graphs within LEs. Circle graphs are still a commonly used data visualization in the media and work force so it is understandable that students should have opportunities to interpret circle graphs and critique why they are problematic. However, based on calls from the discipline of statistics, policymakers should reconsider asking students to spend time making circle graphs.
One area of reflection post-CCSSM adoption should be around the lack of a statistics content strand at the elementary level. It may be that OTL statistics were reduced because there was no purposeful inclusion of this strand. In fact, states with formal statistics strands like Probability and Statistics, Data Analysis, and Data and Statistics had, on average, 5 more LEs per state in the elementary grade band than those that only included a measurement strand. A specified statistics content strand could provide more meaningful experiences with the statistical investigative process, enabling students to advance from Developmental Level A to B and ultimately C. This, however, is at odds with the Achieve (Citation2017) report, which argues for a greater emphasis on arithmetic to prepare students for further mathematics study.
Another important consideration is the combination of all four elements of the statistical investigative process. While each element serves its own purpose, if one is approached in isolation or another is completely removed from LEs, students may not understand the element’s relationship with the others. As it stands, only 56% of LEs link more than one process element, with most linkages between the analyze and interpret elements. With the sparse number of question LEs, students have limited exposure to the impact of questioning on the other three elements and the iterative process of asking and answering questions. Although collect LEs are already often connected with the analyze and interpret elements, the collect element only makes up 32% of the overall LEs across the 52 states. A deliberate inclusion of this element will prepare students to understand how to collect and consider data to answer the question posed and to determine the different ways those data can be analyzed and then interpreted. This step may also invite students to critically evaluate informal datasets and pose their own investigative questions. Thus, a reconsideration of the structure or wording of LEs may create more opportunities for students to interact with the whole statistical investigative process in a multitude of ways.
It could be possible that states have deliberately chosen to separate the four process elements to ensure teachers provide an adequate focus on each. Even so, an average of only one grade level out of nine across all 52 states offered LEs with all four process elements. Many K-8 grade levels across the states included LEs with either two (40%) or three (35%) process elements. A limitation of this study is that we did not explore how separate LEs may have been clustered in each grade level within the states to signal to teachers that these LEs should be taught in unison. However, a separation of the process elements and an inconsistency with the number of process elements covered in the LEs may not translate into OTL statistics with the elements connected.
An analysis of the GAISE II highlights also showed a need for more emphasis on different variable types, multivariate datasets, technology integration, and communication of statistical reasoning to others within K-8 standards documents. Exposure to these components will help students expand their understanding of the nature of variability, the ways to manipulate data, and how to articulate their statistical thinking to others. Although Achieve (Citation2017) asserts that LEs are appropriately represented in the 6–8 grade band and are in line with the NAEP, these added concepts will also help prepare students to engage with statistical analyses at the high school and college levels and in their everyday lives.
Another area that has yet to be incorporated into states’ standards documents is data science, including the skills of structuring and cleaning data, working with alternate data types and multivariate datasets, and the deliberate inclusion of different types of technology. Specifically referenced in GAISE II, data science is a burgeoning field and provides students with opportunities to enrich their understanding of and improve their analytical skills with data. As data science and data science education continue to grow, it is important that policymakers begin incorporating standards that include concepts and practices from data science, so students have opportunities to learn skills that are important for developing their data literacy and to prepare for the workforce.
Conclusions
In concluding we start by offering the following recommendations for future standards revisions based on our findings in relation to suggestions from the GAISE II report (Bargagliotti et al. Citation2020) and from NCTM in their Catalyzing Change series (National Council of Teachers of Mathematics (NCTM) Citation2020a, Citation2020b).
Standards for formulating questions and/or using statistical questions to guide investigations need to be included consistently across grade levels and explicitly connected to all elements of the investigative process to build students’ understanding of statistical inquiry consistent with the discipline.
Multivariate datasets and nontraditional variables such as pictures need to be explicitly incorporated into standards, so students have opportunities to make sense of data like those typically present in the media today and consistent with the emerging field of data science.
Standards that create opportunities for students to experience all the elements of the statistical investigative process should be included at all grade levels.
Standards should be included that create opportunities for students to experience and make sense of the messiness of raw data. This should include practices for data cleaning, structuring, and preparing for analysis. These are important aspects of statistical inquiry and are also central in data science.
The explicit use of technology to carry out statistical practices should be incorporated into the official curriculum, including standards, to make clear which concepts or skills students should be learning with technology versus by hand, which is commonly the default in mathematics education. Furthermore, these decisions should be based on developmental research from the learning sciences and mathematics education.
The creation of circle graphs should be excluded from learning expectancies as this is a practice discouraged by statisticians. Instead LEs should focus on interpreting circle graphs and interrogating their flaws.
Standards writers should use the GAISE II report as part of their guiding documents to make revisions and also consider including teachers and university faculty with experience in teaching statistics and statistics education in the writing process.
We would also like to suggest that policy makers consider the role of context in their creation of standards. In our findings, we found that Montana revised many of their standards to include explicit direction to consider concepts “within cultural contexts, including those of Montana American Indians” (Montana Department of Public Instruction Citation2011, p. 16). This is based on, “constitutional mandate to provide instruction that includes the distinct and unique heritage and contemporary contributions of American Indians in a culturally responsive manner” (Montana Department of Public Instruction Citation2011, p. 3). We commend such moves as Indigenous ways of knowing are often excluded from the mathematics curriculum. Furthermore, because of the central role of context in statistical practice (Wild and Pfannkuch Citation1999), it is crucial to consider meaningful contexts in the teaching of statistics (Weiland Citation2017; Cobb and Moore Citation1997). Furthermore, past research has found the consideration of context in mathematics curriculum to be superficial (Weiland Citation2019). Given the increasingly complex data representations presented in society and need for statistically literate citizenry, it is important for students to have experiences using statistics to make sense of cultural and sociopolitical contexts. Official curriculum, such as state standards, could be a driving force for helping to create such opportunities to learn for students like the example provided by Montana.
We would also like to encourage researchers to interrogate other types of official curriculum associated with state curriculum standards. For example, many states include unpacking documents or supplemental materials that are meant to support teachers and bridge the state standards with written and enacted curriculum of the classroom. Such materials were beyond the scope of this study but could provide a clearer picture of the opportunities for students to learn statistics created by official curriculum.
Furthermore, from a research perspective, we know very little about the impact of statistics standards on the enacted curriculum of the classroom that students experience and the understandings and attunement to practices students develop. We can make inferences from mathematics education research, but statistics is a distinct discipline from mathematics, despite its position in the school mathematics curriculum; this also leads to differences in recommendations for teaching (Cobb and Moore Citation1997). Research into the influence of standards on students’ experiences and learning of statistics is important to inform standards writers, as much of the guidance is currently provided either from changes occurring in the discipline or recommendations from research on student learning, without considering the connection between standards and student learning. The linkage between the elements of curriculum described by Remillard and Heck (Citation2014) need to be investigated in the context of statistics. Such research is necessary to better understand students’ opportunities to learn statistics in the K-8 mathematics curriculum. Creating opportunities for students to develop their statistical literacy is crucial for preparing students to be critical citizens of tomorrow and upholding the pillars of democracy.
Disclosure Statement
There are no known conflicts of interest in this work.
References
- Achieve. (2017), Strong Standards: A Review of Changes to State Standards since the Common Core. Washington, DC: Achieve.
- Apple, M. W. (1992), “Do the Standards Go far Enough? Power, Policy, and Practice in Mathematics Education,” Journal for Research in Mathematics Education, 23, 412. DOI: https://doi.org/10.2307/749562.
- Barclay, E., Scott, D., and Animashaun, C. (2020). “Coronavirus USA Chart: Flattening the Curve and “Raising the Line” of Hospital Capacity.” Vox, April 7. https://www.vox.com/2020/4/7/21201260/coronavirus-usa-chart-mask-shortage-ventilators-flatten-the-curve
- Bargagliotti, A., Franklin, C., Arnold, P., Gould, R., Johnson, S., Perez, L., and Spangler, D. (2020), Pre-K-12 Guidelines for Assessment and Instruction in Statistics Education II (GAISE II) (2nd ed.). American Statistical Association, https://www.amstat.org/education/guidelines-for-assessment-and-instruction-in-statistics-education-(gaise)-reports.
- Bargagliotti, A. E. (2012), “How Well do the NSF Funded Elementary Mathematics Curricula Align with the GAISE Report Recommendations,” Journal of Statistics Education, 20, 1–26.
- Ben-Zvi, D., and Garfield, J. (2008), “Introducing the Emerging Discipline of Statistics Education,” School Science and Mathematics, 108, 355–361. DOI: https://doi.org/10.1111/j.1949-8594.2008.tb17850.x.
- Carver, R., Everson, M., Gabrosek, J., Horton, N., Lock, R., Mocko, M., … and Wood, B. (2016). Guidelines for Assessment and Instruction in Statistics Education (GAISE) College Report 2016. American Statistical Association. https://www.amstat.org/docs/default-source/amstat-documents/gaisecollege_full.pdf
- Cobb, G. W., and Moore, D. S. (1997), “Mathematics, Statistics, and Teaching,” The American Mathematical Monthly, 104, 801–823. DOI: https://doi.org/10.1080/00029890.1997.11990723.
- Confrey, J. (2010), “‘Both and’—Equity and Mathematics: A Response to Martin, Gholson, and Leonard,” Journal of Urban Mathematics Education, 3, 25–33.
- Dingman, S., Teuscher, D., Newton, J. A., and Kasmer, L. (2013), “Common Mathematics Standards in the United States: A Comparison of K–8 State and Common Core Standards,” The Elementary School Journal, 113, 541–564. DOI: https://doi.org/10.1086/669939.
- Franklin, C., Kader, G., Mewborn, D., Moreno, J., Peck, R., Perry, M., and Scheaffer, R. (2007), Guidelines for Assessment and Instruction in Statistics Education (GAISE) Report: A Pre-K–12 Curriculum Framework. American Statistical Association, https://www.amstat.org/education/guidelines-for-assessment-and-instruction-in-statistics-education-(gaise)-reports.
- Goertz, M. E. (2010), “National Standards: Lessons from the Past, Directions for the Future.” In Mathematics Curriculum: Issues, Trends, and Future Direction, 72nd Yearbook, eds. B. Reys, R. Reys, and R. Rheta, pp. 51–64. Reston, VA: National Council of Teachers of Mathematics.
- Groth, R. E. (2013), “Characterizing Key Developmental Understandings and Pedagogically Powerful Ideas within a Statistical Knowledge for Teaching Framework,” Mathematical Thinking and Learning, 15, 121–145. DOI: https://doi.org/10.1080/10986065.2013.770718.
- Jones, D. L., and Jacobbe, T. (2014), “An Analysis of the Statistical Content in Textbooks for Prospective Elementary Teachers,” Journal of Statistics Education, 22, 1–18.
- Jones, D. L., Brown, M., Dunkle, A., Hixon, L., Yoder, N., and Silbernick, Z. (2015), “The Statistical Content of Elementary School Mathematics Textbooks,” Journal of Statistics Education, 23, 1–22.
- Los Angeles Unified School District. (n.d.), MOBILIZE. Available at https://achieve.lausd.net/Page/6764. Accessed July 8, 2021
- Martin, D. B., Gholson, M. L., and Leonard, J. (2010), “Mathematics as Gatekeeper: Power and Privilege in the Production of Knowledge,” Journal of Urban Mathematics Education, 3, 12–24.
- Martinez, W., and LaLonde, D. (2020), “Data Science for Everyone Starts in Kindergarten: Strategies and Initiatives from the American Statistical Association,” Harvard Data Science Review, 2. DOI: https://doi.org/10.1162/99608f92.7a9f2f4d.
- McClure, P. (2005). “Where Standards Come From,” Theory Into Practice, 44(1), 4–10. DOI: https://doi.org/10.1207/s15430421tip4401_2.
- Montana Department of Public Instruction. (2011), Montana Content Standards for Mathematics. http://opi.mt.gov/LinkClick.aspx?fileticket=5YWhUY9cbKU%3d&portalid=182
- National Council of Teachers of Mathematics (NCTM). (2000), Principles and Standards for School Mathematics. Reston, VA: National Council of Teachers of Mathematics, Inc.
- National Council of Teachers of Mathematics (NCTM). (2020a), Catalyzing Change in Early Childhood and Elementary Mathematics: Initiating Critical Conversations. Reston, VA: National Council of Teachers of Mathematics.
- National Council of Teachers of Mathematics (NCTM). (2020b), Catalyzing Change in Middle School Mathematics: Initiating Critical Conversations. Reston, VA: National Council of Teachers of Mathematics.
- National Governors Association Center for Best Practices [NGA Center] and Council of Chief State School Officers [CCSSO]. (2010), Common Core State Standards for Mathematics. Authors. http://www.corestandards.org/assets/CCSSI_Math%20Standards.pdf
- Newton, J., Horvath, A., and Dietiker, L. (2011), “The Statistical Process: A View Across the K-8 State Standards.” In Variability is the Rule: A Companion Analysis of K-8 State Mathematics Standards, pp. 119–159. Charlotte, NC: Information Age Publishing.
- NGSS Lead States. (2013), Next Generation Science Standards: For States, by States. Washington DC: The National Academies Press.
- Orrill, C. H. (2016), “The Process Is Just Messy: A Historical Perspective on Adoption of Innovations,” The Mathematics Educator, 25, 71–94.
- Remillard, J. (2000), “Can Curriculum Materials Support Teachers’ Learning? Two Fourth-Grade Teachers’ Use of a New Mathematics Text,” The Elementary School Journal, 100, 331–350. DOI: https://doi.org/10.1086/499645.
- Remillard, J., and Heck, D. J. (2014), “Conceptualizing the Curriculum Enactment Process in Mathematics Education,” ZDM, 46, 705–718. DOI: https://doi.org/10.1007/s11858-014-0600-4.
- Robson, D. (2020). “Exponential Growth Bias: The Numerical Error Behind Covid-19.” BBC, August 12. https://www.bbc.com/future/article/20200812-exponential-growth-bias-the-numerical-error-behind-covid-19
- Scheaffer, R. L., and Jacobbe, T. (2014), “Statistics Education in the K-12 Schools of the United States: A Brief History,” Journal of Statistics Education, 22. https://doi.org/https://doi.org/10.1080/10691898.2014.11889705
- Schmidt, W. H., and McKnight, C. C. (2012), Inequality for All: The Challenge of Unequal Opportunity in American Schools. New York, NY: Teachers College Press.
- Schmidt, W. H., Wang, H. C., and McKnight, C. C. (2005), “Curriculum Coherence: An Examination of US Mathematics and Science Content Standards from an International Perspective,” Journal of Curriculum Studies, 37, 525–559. DOI: https://doi.org/10.1080/0022027042000294682.
- Stein, M., and Smith, M. (2010), “The Influence of Curriculum on Students’ Learning.” In Mathematics Curriculum: Issues, Trends, and Future Direction, 72nd Yearbook, eds. B. Reys, R. Reys, and R. Rubenstien, pp. 351–362). Reston, VA: National Council of Teachers of Mathematics.
- Stein, M., Remillard, J., and Smith, M. (2007), “How Curriculum Influences Student Learning.” In Second Handbook of Research on Mathematics Teaching and Learning, eds. F. K. Lester, pp. 319–369. Charlotte, NC: Information Age Publishing.
- Tarr, J. E., Reys, R. E., Reys, B. J., Chávez, Ó., Shih, J., and Osterlind, S. J. (2008), “The Impact of Middle-Grades Mathematics Curricula and the Classroom Learning Environment on Student Achievement,” Journal for Research in Mathematics Education, 39, 247–280.
- The Common Core Standards Writing Team. (2011), Progressions for the Common Core State Standards in Mathematics (Draft): 6–8 Statistics and Probability.
- United Nations. (2003), Literacy Prerequisite for Reaching Global Anti-Poverty Goals Says Secretary-General in Literacy Day Message [Press Release], May 9. https://www.un.org/press/en/2003/sgsm8849.doc.htm
- Usiskin, Z. (2014), “On the Relationships Between Statistics and Other Subjects in the K-12 Curriculum.” Sustainability in Statistics Education. CHANGE, Flagstaff, AZ, https://doi.org/10.1080/09332480.2015.1099361.
- Weiland, T. (2017), “Problematizing Statistical Literacy: An Intersection of Critical and Statistical Literacies,” Educational Studies in Mathematics, 96, 33–47. DOI: https://doi.org/10.1007/s10649-017-9764-5.
- Weiland, T. (2019), “The Contextualized Situations Constructed as Appropriate for the Use of Statistics by School Mathematics Texts,” Statistics Education Research Journal, 18, 18–38. https://iase-web.org/documents/SERJ/SERJ18(2)_Weiland.pdf?1576862349 DOI: https://doi.org/10.52041/serj.v18i2.138.
- Westheimer, J., and Kahne, J. (2004), “What Kind of Citizen? The Politics of Educating for Democracy,” American Educational Research Journal, 41, 237–269. DOI: https://doi.org/10.3102/00028312041002237.
- Wild, C. J., and Pfannkuch, M. (1999), “Statistical Thinking in Empirical Enquiry,” International Statistical Review, 67, 223–248. DOI: https://doi.org/10.1111/j.1751-5823.1999.tb00442.x.