 ?Mathematical formulae have been encoded as MathML and are displayed in this HTML version using MathJax in order to improve their display. Uncheck the box to turn MathJax off. This feature requires Javascript. Click on a formula to zoom.
Abstract
There have been significant developments in the field of statistics education over the past decade that have improved outcomes for all students. However, there remains relatively little research on the best practices for teaching statistics to students with disabilities. This article describes a conceptual visual approach to teaching a college level general education statistics course aimed at addressing the needs of students with disabilities and other struggling students. The conceptual visual components were employed using the technology tool TinkerPlots. The approach is informed by the recommendations of the GAISE report as well as research on Universal Design and Cognitive Load Theory. With support from the NSF (HRD-1128948), the approach was pilot tested at a college that exclusively serves students with LD, ADHD, and autism to gather preliminary evidence of its effectiveness in teaching statistics concepts to that population. The results of this research and the emergent recommendations to help students with disabilities gain access to statistics are described in this article. Supplementary materials for this article are available online.
1 Introduction
Statistical literacy is an essential component of virtually every STEM field. The authors consider statistical literacy as the understanding of the basic language of statistics and interpretation of statistical graphs and analyses. Today’s scientists are increasingly expected to be expert consumers and producers of data. This requires an understanding of statistical concepts, collecting data, analyzing a dataset, and accurately interpreting those analyses. These skills are not merely important in order to pass the statistics courses that are often gate keepers in scientific academic programs but are essential parts of the daily work of most scientists, engineers, network administrators, project managers, entrepreneurs, and others working across all sectors of society.
Statistical literacy has become a critical component of our daily lives prompting the Common Core State Standards for Mathematics (National Governors Association Center for Best Practices, Council of Chief State School Officers Citation2010) to introduce basic statistical concepts to students as early as kindergarten. Unfortunately, most adults tend to misinterpret statistical information (Konold Citation1995; Gigerenzer et al. Citation2007; von Roten and de Roten Citation2013) and often rely on shortcuts or heuristics, rather than sound statistical reasoning (Kahneman Citation2011). Given these findings one would be correct in deducing that students struggle in traditional statistics courses, often having trouble with reasoning about aggregate data (Castro Sotos et al. Citation2007). Furthermore, there has been a longstanding recognition that statistics education is difficult and in need of reform (Garfield Citation1995; Tishkovskaya and Lancaster Citation2012).
The past two decades have seen the rise of a reform movement in K-12 mathematics education largely guided by standards established by the National Council of Teachers of Mathematics (National Council of Teachers of Mathematics Citation1989, Citation2000). At the same time the field of statistics education began its own reform agenda. A report in 1992, known as the Cobb report (Cobb Citation1992) set in motion reforms in statistics education. The creation of the Guidelines for Assessment and Instruction in Statistics Education (GAISE) reports (Aliaga et al. Citation2005; GAISE College Report ASA Revision Committee Citation2016) helped to further define the field at both the K-12 and Postsecondary levels and an agenda to promote universal statistical literacy was established (Cobb Citation2013).
The American Statistical Association commissioned the updated GAISE college report 2016) by a committee of eleven statisticians from higher education. Their recommendations include both instructional and assessment guidelines for college statistics for teaching consumers and producers of statistics. The report provides six key recommendations: emphasize statistical thinking and literacy, use real data, emphasize conceptual understanding, use active learning, analyze data using technology, and support learning with assessments.
Despite these advances, we still have relatively little information about how best to teach statistics to students with disabilities and other student populations that typically underperform in statistics. Many traditional approaches for remedial math and statistics education rely on direct instruction approaches that do not align with the GAISE recommendations (Kirschner et al. Citation2006). Recent work in this area explores ways to support diverse learners using a more constructivist approach to education, however, much of this work is still nascent (Wagler and Lesser Citation2011; Aridor and Ben-Zvi Citation2018; Stone, Kay, and Reynolds Citation2019). This pilot study therefore, aimed to answer the question: Can an intervention that is guided by the GAISE report recommendations and designed to be accessible to students with disabilities lead to an improved understanding of college-level statistics concepts for that population compared to traditional approaches?
TinkerPlots (Konold and Miller Citation2005), was used as the primary tool for exploring and visualizing data in this study. While TinkerPlots was originally intended for use at the middle school level, several research studies on the use of TinkerPlots as an educational tool have found it successful at furthering the understanding of statistical concepts among students at all levels. For example, research has shown that a modeling and simulation approach using TinkerPlots can improve students’ reasoning about data and statistical inference (Noll and Kirin Citation2017; Noll et al. Citation2021).The software is simple and intuitive enough for elementary school students to navigate and understand (Paparistodemou and Meletiou-Mavrotheris Citation2008) yet is powerful enough to be of value to educators (Hammerman and Rubin Citation2004; Hall Citation2008) as well as undergraduate and graduate students (Lee and Hollebrands Citation2008; Lesh Citation2010).
The authors work at Landmark College, a college that exclusively serves a population of students with Learning Disabilities (LD), Attention Deficit Hyperactivity Disorder (ADHD), and/or autism. With support from a grant from the National Science Foundation (HRD-1128948), the authors piloted a conceptual approach developed in line with the recommendations of the GAISE report to meet the needs of this student population with guidance from research on Universal Design and Cognitive Load Theory. This work aimed to establish a proof-of-concept for the use of this conceptual approach using TinkerPlots to support students with disabilities in statistics courses. The approach and the results of piloting the approach are described herein.
1.1 Learning Disabilities
The National Center for Learning Disabilities (NCLD) estimates that as much as 1 in every 5 students in the United States has significant attention or learning difficulties (Horowitz, Rawe, and Whittaker Citation2017). At the postsecondary level, the United States Government Accountability Office (Citation2009) reports that the number of undergraduate students with disabilities had continued to increase over the prior decade reaching a total of 11% of the postsecondary student population. The same report estimates that about one third of students with disabilities have a diagnosis of LD, ADHD, and/or autism with numbers in all three categories continuing to rise. A 2014 national survey of college freshmen at baccalaureate granting institutions indicates that 3.3% of the student population report having an LD, 5.9% report having ADHD, and 0.7% report having autism (Eagan et al. Citation2014). A more recent survey conducted in 2018 indicates that these numbers have increased to 3.9% for LD, 7.4% for ADHD, and 0.9% for autism (Stolzenberg et al. Citation2019).
While in theory students with LD, ADHD, and autism belong to three distinct diagnostic categories, in practice the lines between these categories are somewhat arbitrary and highly overlapping. Comorbidity (having more than one diagnosis) across these conditions is high (Mayes and Calhoun Citation2006) and is more the norm rather than the exception (Willcutt Citation2014). The overlap between ADHD and LD has long been recognized (Mayes, Calhoun, and Crowell Citation2000). Several studies point to common genetic influences for LD and ADHD (Greven et al. Citation2012, Citation2014; Willcutt Citation2014). Similar overlap has also been noted between LD and autism (Barnard et al. Citation2008) with some suggesting that they may be part of a broader spectrum of a single condition (O’Brien and Pearson Citation2004).The association between ADHD and autism has been more controversial (Leitner Citation2014). However, extensive research indicates a large overlap between the two (Gargaro et al. Citation2011; Zablotsky, Bramlett, and Blumberg Citation2017) with evidence of a common genetic basis (Ronald et al. Citation2008; Lichtenstein et al. Citation2010; Rommelse et al. Citation2010).
Given this strong overlap between the diagnostic categories, any sample focusing on a “pure” single diagnostic category would exclude a large portion of individuals with that diagnosis and would be of limited ecological validity. Conversely, studies that ignore relevant comorbid conditions introduce significant threats to the internal validity of their work. Due to the large overlap between LD, ADHD, and autism in terms of functional impairment, genetic influence, and clinical diagnosis, the sample for this study includes participants from all three diagnostic categories.
Learners with these diagnoses often have overlapping functional limitations that lead to a breakdown in learning for them in the traditional classroom. Executive function (EF) challenges and areas of functional difficulty overlap across all three diagnostic conditions, and indeed to a large extent underlying many of the functional difficulties faced by students in all three diagnostic categories. EF challenges include difficulty with activation, maintaining focus, sustaining effort, regulating emotions, memory, and initiating action (Brown Citation2006). These limitations include difficulty with language or information processing (Geurts and Embrechts Citation2008), difficulty with social interactions (Semrud-Clikeman and Schafer Citation2000; Mikami, Miller, and Lerner Citation2019), and executive function difficulties such as poor organization, time management, and emotion regulation (Meltzer Citation2018; Vaidya et al. Citation2020).
1.2 Universal Design
At the author’s college, instructional philosophies used to meet the needs of students with a range of disabilities are guided by the principles of Universal Design (Mcguire, Scott, and Shaw Citation2006; CAST Citation2011). Universal Design is a philosophy that encourages anticipation of the diversity of needs within a classroom within the initial design. By contrast, traditional curricula are often built and tested with a mostly neurotypical student population and are eventually “retrofitted” using accommodations to meet the needs of students with disabilities. This latter approach is often expensive and rarely effective (Rose and Meyer Citation2002). Universal Design on the other hand encourages anticipating diversity within the classroom and designing the curriculum from the ground up to meet the needs of all students (Rose, Meyer, and Hitchcock Citation2005).
Universal Design for Learning (UDL), one of the leading approaches to implementing Universal Design in educational settings, focuses on maximizing the engagement of three types of brain networks necessary for learning: the recognition network, the strategic network, and the affective network (Rose and Meyer Citation2002):
The recognition network is responsible for information processing. Students with disabilities, particularly those with language-based learning disabilities such as dyslexia can struggle to acquire information that is delivered through text or verbally. Therefore, it is critical to provide students with options in how they can acquire new information to allow all students equal access to the content.
The strategic network addresses issues of planning and performance. Students with EF challenges can benefit from supports that target this network by allowing alternate means of knowledge expression, and by providing metacognitive support structures.
The affective network plays a critical role in learning and affects many struggling learners who disengage in the math classroom. Students disengage for many reasons and in different ways; these are not seen as faults, but rather mismatches in learning and instructional approaches.
The goal of UDL is to ensure that content is interesting and relevant to students, and that students have the tools necessary to manage frustration and sustain effort as they work through challenging content. Providing such external structure and concrete support helps create a better match for students to increase engagement.
The UDL guidelines (CAST Citation2011) have been used to guide modifications made to the statistics course described here to provide accessibility to students with disabilities. This included ensuring that content was compatible with assistive technologies (such as screen readers) and was presented to students using multiple formats and modalities thereby allowing multiple means for accessing the content. Attention was given to content formatting and graphic organizers as appropriate. Students were given options for multiple ways of expressing their knowledge and were provided with executive function supports to help them structure their time and progress. Additionally, the team focused on student motivation by using examples and datasets that made the content personally relevant to students. Finally, the use of the TinkerPlots software allowed for an alternate means of acquiring knowledge, expressing knowledge, and engagement thereby supporting all three brain networks targeted by the UDL guidelines. A more detailed view of the supports provided to students in the classroom is outlined in the Approach section.
1.3 Cognitive Load Theory and Instructional Practice
Cognitive Load Theory (CLT) posits that when learners overload their working memory during problem solving or processing instructional information, learning is impacted (Ayres and Paas Citation2012). Working memory has been described as “conscious cognitive processing” and while estimates of its capacity vary, some place that limit at two or fewer novel elements (Paas, Renkl, and Sweller Citation2003). Instructional design created to reduce cognitive load is focused on reducing demands on working memory. Freeing up such resources often includes many aspects of UDL, and can include supports such as providing worked examples, limiting the number of details that require attention, and presenting information using concrete manipulatives.
Paas, Renkl, and Sweller (Citation2003, p. 1) shared that “[i]nformation varies on a continuum from low to high in element interactivity” and that learning and cognitive load are critically tied to the level of interactivity. CLT predicts that cognitive load processing for contextualized word problems can be quite high as students struggle with language processing, symbolic decoding, conceptual understanding, and computational fluency. Cognitive loads for such context heavy problems can be especially high for students with disabilities that impair their language processing, number sense, or ability to maintain focus. As a result, some researchers have found that students with disabilities can have a difficult time engaging with and benefiting from some of the reform curricula (Baxter, Woodward, and Olson Citation2001; Woodward and Montague Citation2002).
Despite these challenges, context heavy curricula and student-centered instructional approaches can be beneficial in engaging students and developing their conceptual understanding. Bottge and colleagues found that students with learning disabilities in mathematics can develop a deeper conceptual understanding using reform curricula but only if they receive significant additional support (2007). The need for additional support is not surprising given the significant literature linking LDs to task specific working memory deficits (Schuchardt, Maehler, and Hasselhorn Citation2008). For example, there is strong evidence for high working memory demands on individuals with dyslexia during both verbal and text language-based tasks (Smith-Spark et al. Citation2003). Dyscalculia is identified as a specific learning disorder that affects one’s ability to learn number sense, arithmetic, calculation, and some mathematical reasoning (American Psychiatric Association 2013). Significant evidence links working memory and dyscalculia although it is not clear whether dyscalculia imposes higher working memory demands or working memory limitations lead to weaknesses in mathematics (Raghubar, Barnes, and Hecht Citation2010). Research looking at executive function related disabilities such as ADHD and autism similarly show an impact on working memory (Goldberg et al. Citation2005).
A critical component to the approach described in this article is the development of students’ conceptual understanding without the high demands on working memory associated with real world and context heavy problems. In other words, we used an approach that could develop students’ conceptual understanding while minimizing or eliminating the need for symbolic decoding, verbal and written language processing, and computational fluency. The approach therefore, reduces the load imposed by computational processing and symbolic decoding by decoupling those aspects of the content from the conceptual approach to solving the problems. The language processing and abstract representation loads are reduced through the use of technologies that focus on simple visual representations and virtual manipulatives.
2 Methods
In order to demonstrate the potential of the UDL and CLT informed instructional approach in improving statistical literacy and outcomes for students with disabilities, funding was secured from the NSF’s Research in Disabilities Education program (HRD-1128948) to pilot the approach. This section first outlines the instructional approach followed by descriptions of the design, participants, and instruments. The results of this pilot study which collected data over three semesters from students at a college that exclusively serves students with LD, ADHD, and autism are then reported.
2.1 Instructional Approach
The introductory statistics course at the authors’ college exclusively serves students with diagnosed specific learning disabilities, attention deficit/hyperactivity disorder (ADHD), and autism and is designed to meet the diverse needs of this population. The course uses Microsoft Excel (standard package and “add-ons”), web applications and simulations, and assistive technology to present statistics to nonmathematics majors who may be in another STEM curriculum or liberal arts curriculum. Through a supportive learning environment, faculty teaching introductory statistics weave skills and strategy development with gaining conceptual understanding of and experience in statistics. The faculty of record has been teaching at Landmark College for more than 20 years and participated in course modifications.
Modifications to the statistics course were guided by the UDL and GAISE guidelines along with current research in the field of statistics education and CLT. Weekly meetings were held with the faculty of record and the grant team. Examples and discussion items focused on real datasets that are relevant to the student population comprising this project’s participant pool. Students were often required to find and use online data that interested them. Content focused primarily on developing sound statistical reasoning and a deep conceptual understanding of the statistical content while de-emphasizing procedural knowledge. Classroom discussions focused on active participation by classroom students as a community of learners and were structured to de-emphasize the role of the instructor.
Content delivery included the use of technological tools and simulations to improve students’ conceptual understanding and to enhance their ability to visualize statistical data and concepts. This was done primarily through the tool TinkerPlots which was used extensively in the intervention classroom but not the control classroom. Finally, assessments and feedback (beyond the experimental measurement instruments) focused on conceptual understanding and provided ongoing feedback to students and the instructor. The grant team conducted informal observations of these statistics sections.
2.2 Guidelines
The grant team including the faculty of record worked together to create the guidelines below and revise the curriculum. The grant team included the chair of the mathematics department, a faculty member with over two decades of experience teaching math and statistics to students with disabilities, and a researcher at the college whose work focuses on teaching STEM to students with disabilities. While the existing statistics curriculum was aimed at supporting students with disabilities, it focused on a more traditional approach that frontloaded new terminology and procedural fluency. This team revised the curriculum to better align with the GAISE recommendations with guidance from UDL and the following guidelines:
Students should begin exploring real data as soon as possible.
Students should explore interesting and/or personally relevant data.
Students should be encouraged to create representations of the data that work best for themselves.
Students should be encouraged to formulate intuitive, informal, conclusions based on their exploration of the data.
Formal statistical tools and representations should be introduced later to help refine their interpretations of the data.
These guidelines emerged from a series of discussions between the team members on how best to adapt the GAISE recommendations in a manner that allowed students flexibility in the way they receive and express knowledge, while not adding complexity.
2.2.1 Students Should Begin Exploring Real Data as Soon as Possible
All lessons were structured to allow students to engage with data as a first step to exploring new statistical concepts. This typically involved giving students access to datasets using TinkerPlots to allow them to explore the data visually without any heavy cognitive loads due to language processing, symbolic decoding, or computational demands. Datasets were selected from those available within Tinkerplots and other popular online datasets of interest to students such as ski season snowfall in the local area (www.snowpak.com/vermont/mount-snow/snow) and popular game statistics (leagueofgraphs.com). One of the first datasets helped students visually examine wage data for male and female employees. Other data were collected from scientific observations of real events including Old Faithful eruption times and fish measurements (see ). Students explored the visual aspects of sorting the data and answered basic questions to understand the visual display. Students shared their representations and ideas about their understanding of their selected visual display with the class.
Fig. 1 Unstructured data points from a dataset of lake caught fish.
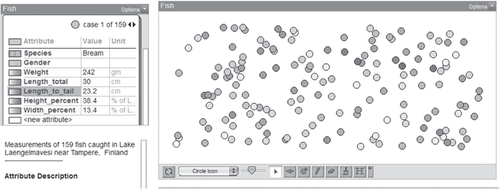
This process allowed students to understand how the data were represented visually in Tinkerplots and made the correspondence between individual sources of data and aggregate representations more concrete for students. This step is critical to allow students to understand the WHY of statistical analysis before being exposed to the HOW.
2.2.2 Students Should Explore Interesting and/or Personally Relevant Data
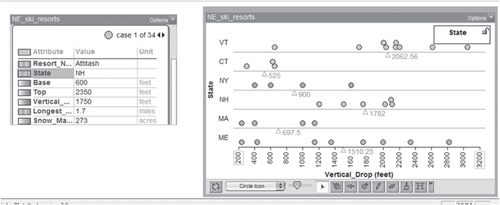
Datasets were selected with the interests and background of the students in mind. This allowed students to engage quickly with the data as they generally had a personal frame of reference to draw from, thereby reducing the associated cognitive load. These datasets included data collected from or by the students themselves or data on topics that the students expressed interest in. Students were encouraged to engage with several datasets that were personally interesting to them, such as sets on cats, Vermont and New Hampshire Ski resorts, and other sets that were created in class (see ). Class data ranged from height, to study time, to other student generated questions. Students were guided in class by the instructor and encouraged to visually explore the structure of the data and to generate data guided questions.
Fig. 2 Dataset comparing ski resorts in the Northeast region.
2.2.3 Students Should Be Encouraged to Create Representations of the Data That Work Best for Themselves
As students explored new datasets, they were encouraged to explore novel ways of visualizing the data. This allowed them to identify representations that worked particularly well for them rather than relying on the standard set of graphs and charts typically used in statistics classrooms. The dynamic nature of the TinkerPlots software facilitated students’ ability to quickly and easily create custom representations. Based on the realistic and personal datasets, students were asked to generate a variety of visual displays of the data using TinkerPlots. These representations at times resembled “play,” where students were quickly moving data around via the drag-and-drop feature of the software to create instantaneous new visual descriptions. Creating multiple views allowed students to analyze the merits of various representations in answering guiding questions posed by the class and the instructor. The representations were reviewed in later sections with a more refined statistical lens.
2.2.4 Students Should Be Encouraged to Reach Intuitive, Informal, Conclusions Based on Their Exploration of the Data
Student exploration of the data was guided by questions posed by the students themselves and by the instructor. Students were encouraged to attempt to respond to the questions solely based on their custom visual representations of the data prior to using any inferential tools. This allowed them to develop an intuitive understanding of the data and motivated the need for inferential statistical tools to provide a more precise and impartial measure of their intuitive interpretations. In class discussions, students were asked questions such as
WAGE DATA: Do these data suggest that one group earns more than another? If you consider education levels does that still hold?
OLYMPICS DATA: Of all the gold-medal times and distances in all these events, which one stands out to you as the greatest accomplishment for its time? Explain your choice.
Student prior intuitions were challenged if they were not supported by the visually represented data. This allowed students to shift focus away from prior misconceptions to more evidence-based conclusions grounded in visual representations created based on each individual student’s preference. This step is crucial in helping students understand the need for inferential statistics and the discrepancy between data supported and non-data supported intuitions.
2.2.5 Formal Statistical Tools and Representations Should Be Built on Students’ Informal Interpretations of the Data
Students were eventually taught formal statistical tools and representations. Students at this point would understand the need for these tools and already have a conceptual sense of the function of these tools based on their informal analysis of the data. Furthermore, by already having an intuitive sense of what the results of analysis should look like, students were in a better position to be able to interpret the data and to identify errors in their analysis. By separating the cognitive load associated with developing conceptual understanding from that associated with the application and interpretation of statistical tools and representations, the content becomes more accessible to struggling learners.
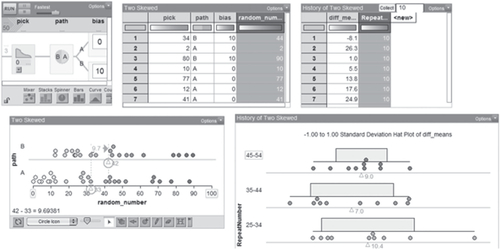
Given that TinkerPlots is a statistical visualization tool, students were transitioned to Microsoft Excel for hypothesis testing and other statistical computations. They continued to use the visualization and analysis tools from TinkerPlots in conjunction with Excel to interpret results. For example, students generated new datasets using TinkerPlots’ sampler (see ) to explore the nature of samples collected from populations as they worked on understanding the central limit theorem. Students would collect samples of various sizes from two populations and represent them using their own custom visualizations. This allowed them to visually observe the nature and distribution of the samples as they were being collected and to get a sense for the stability of the sample means based on sample size and the overall variability of the underlying population. The students would then run t-tests on these samples to get a sense of how p-values changed as they visually saw the means of the two samples stabilize. This helped students develop a deep understanding of the underlying processes without the cognitive loads imposed by language processing, symbolic decoding, and high-level abstraction.
Fig. 3 Dynamic visual representation of a comparison between two samples collected from the same population.
2.3 Design
This study used a quasi-experimental design. Data were collected across three semesters from control and intervention classrooms. All classrooms were sections of introductory statistics taught by the same instructor. Control classrooms were taught using the college’s traditional introductory statistics course which closely follows a traditional introductory statistics textbook. This course, however, incorporates several pedagogical support elements commonly used at Landmark College to teach students with disabilities. These elements are in line with the principles of UDL and include supports such as the use of manipulatives, multi-modal instruction, and scaffolded problem solving. In particular, this included standard lectures, homework, and examinations. The intervention classrooms followed the same progression of topics as the control classrooms but used the approach described in the preceding section. In both classes the same traditional assessments were given for grade calculations.
Data were collected from one control and one intervention classroom in two of the three semesters. These sections were offered on the same days by the same instructor in the same classroom in consecutive time slots. Assignment of which section received the intervention was counterbalanced across the semesters to ensure fidelity of implementation. In addition, data were collected from a single intervention classroom in the third semester but no control classroom was available for data collection during that semester.
2.4 Participants
A total of 68 students were enrolled in the five control and intervention classrooms at the beginning of each semester (40 intervention, 28 control). Students were informed of the research study at the beginning of each semester and were asked to give their informed consent to participate in the testing. Twenty participants in the intervention condition (females 9, males
11) and 19 participants in the control condition (females
8, males
11) participated in the data collection that was conducted at the end of each semester. Attrition was due to many factors including not completing assessments, withdrawing from the course, and withdrawing from the college. Institutional data are not available, but the anecdotal experiences of the authors suggests that the attrition (both in intervention and control groups) was in alignment with prior semesters. In other campus research that we have conducted it is common for students to complete the pretest, but not follow up with the posttest.
In terms of diagnosis, 8 of the 19 (42%) participants in the control condition and 9 of the 20 (45%) participants in the intervention condition self-reported an ADHD only diagnosis, 6 of the 19 (32%) control and 0 of the 20 (0%) intervention self-reported an LD only diagnosis, 1 of the 19 (5%) control and 4 of the 20 (20%) intervention self-reported an autism only diagnosis, 1 of the 19 (5%) control and 6 of the 20 (30%) intervention self-reported more than one diagnosis, and finally 3 of the 19 (16%) control and 1 of the 20 (5%) intervention participants chose not to report their diagnoses. With respect to race, 3 of the 19 (16%) participants in the control condition and 4 of the 20 (20%) participants in the intervention condition reported being of nonwhite or mixed heritage. All participants with the exception of a single intervention condition participant reported that English was their native language. In addition, none of the participants reported having previously taken a statistics course.
2.5 Instruments
Students were asked to voluntarily fill in an instrument developed by the research team (which included the faculty of record). Students were asked to anonymously self-report demographics including sex, race, and disability status. Students were also asked whether they had previously taken statistics and questions about their interest in mathematics, STEM, and statistics.
In addition to the aforementioned questions, students were asked to complete a test composed of seven items designed to assess students’ understanding of key concepts in statistics. These were multiple choice items created in a manner similar to the distractor driven assessment items developed by the American Association for the Advancement of Science’s Project 2061 (Herrmann-Abell and DeBoer Citation2014) but used a unique two-tiered response approach. To develop these items, the project team identified key concepts in statistics that they wanted to measure. The team then created items that required understanding of the underlying concept to correctly answer and used common misconceptions of those concepts to develop four distractor responses. However, unlike the project 2061 items, our assessment required students to not only select the correct response but also to select the correct explanation for that response from a second tier of distractor driven multiple choice items (see Appendix A, supplementary materials). Only correct answers that also included the correct explanation were marked as correct. This approach allowed for a reasonably large-scale assessment of conceptual understanding while minimizing the chance that students could respond correctly by chance. In addition, these items can be analyzed to identify whether any particular common misinterpretations of statistical concepts were prevalent in the sample, however, this analysis is beyond the scope of the current article. The data were used to assess the intervention teaching approach over the standard model rather than looking at individual student improvements.
3 Results
The results reported below are based on a statistical analysis of the data collected by the project using the aforementioned instrument. The outcome of interest for this study was determining whether the intervention improved conceptual understanding of key statistical concepts for students with disabilities over the standard approach. On average, students in the intervention condition correctly answered 2.3 () of the seven conceptual understanding questions whereas the students in the control condition on average correctly answered 1.84 (
) of those questions. A t-test comparing the difference in means failed to reach the level of statistical significance, t(37)
1.15, p = 0.26. In addition, due to the small sample size and potential for a violation of the assumption of normality, a Mann-Whitney Test was conducted and revealed similar results, U = 146.5, p = 0.215. We also conducted an analysis of performance on individual test items from the conceptual assessment, see for a summary of the results. Items 1, 3, and 4 showed sizeable effects with the difference on item 3 reaching the level of statistical significance despite the small sample size.
Table 1 Summary of Control versus Intervention group performance on conceptual assessment items.
Given the pilot nature of this work, and the high variability observed among students in this population, the collected sample size only provides enough power for the detection of fairly large effect sizes. To better ascertain the impact of this intervention on students’ conceptual understanding, Cohen’s d was used to determine the effect size of the intervention with d = 0.37. While not a large effect, 0.37 is close to the average effect size of 0.4 that is typically observed in educational interventions, a field in which 0.4 is considered an effect of medium size (Cumming and Calin-Jageman Citation2017). The observed power of the current study to detect an effect of this size was computed using the software package G*Power 3.1 (Faul et al. Citation2009) and was determined to be 0.20 indicating that there is an 80% chance of a Type II error occurring in the performed t-test. To increase the power to 0.95, thereby reducing the chance of a Type II error to 5%, the sample size in future assessments of this intervention would need to be increased to 380 total participants.
The size of the sample precluded any meaningful analysis of subsets of the full sample population. Our other tests revealed that there were no significant differences observed between the two groups’ reported interest in STEM, comfort with statistics, or facility with mathematics. In addition, we conducted a post hoc analysis of students’ grades in the control and experimental classrooms. These grades were based on primarily computational midterm and final assessments that were the same in both the control and intervention classrooms and included anonymized data from all 66 participants who received a final grade. On average, students in the intervention condition had a GPA of 3.26 () whereas the students in the control condition on average had a GPA of 3.30 (
). A t-test comparing the difference in means showed no significant difference between the two groups (t < 1).
4 Discussion
Little attention has been paid to meeting the needs of students with disabilities in the statistics classroom, particularly at the postsecondary level. Instructional approaches that are effective for students with disabilities are likely to not only benefit that population of students but also other statistics learners as well. Several technological and pedagogical innovations created to meet the learning needs of students at the margins have made their way into the mainstream classroom. It is our hope that the approach described in this article can improve teaching practices for all students taking introductory statistics.
provides a view of the areas where students may have particularly benefited using this approach. Item 1 presented students with a basic test of central tendency and while students overall performed best on this item there were still a significant number of students, particularly in the control group who could not perform simple group comparisons based on central tendencies. Item 3 showed a significant difference between the two groups and in fact no student in the control condition answered this item correctly. The item probed students’ ability to attend to group variance when considering the significance of differences in means. Finally, Item 4 probed students’ ability to take sample size into consideration when making group comparisons and while it failed to reach the level of statistical significance there were twice as many students in the intervention condition who accurately responded to this item compared to the control condition. Together these data indicates that the intervention may have increased students’ ability to attend to central tendency, group variability, and group size when making group comparisons but likely had little to no impact on their ability to judge a lack of group difference, skewed data, biased samples, or the strength of linear relationships.
Calls for the reevaluation of college algebra as entrance requirements (Cullinane and Treisman Citation2010) and the use of developmental courses such at Intermediate Algebra (AMATYC Citation2014) question how best to teach introductory statistics courses to students in liberal studies majors. The students represented in the data were not required to demonstrate mastery or completion of college algebra prior to undertaking the statistics course. This pilot shows promise for a path to teaching the core concepts of college level statistics without the barriers inherent in the use of symbolic representations and specialized language and tools.
The approach included several UDL designs and considerations for reducing cognitive load, namely allowing students to display data using a range of accessible, usable, and intuitive visualizations. The gains demonstrated suggest that this approach including reducing cognitive load may be beneficial for these students. As mentioned earlier many of the reform curricula approaches increase the cognitive demand for students with disabilities. However, the software’s visually presented information may pose certain challenges for some types of learning profiles. For example, students with a traumatic brain injury that impacts their visual processing, and some learners with autism who struggle with visual-spatial processing may not be served well by this type of approach. This avenue of study requires more development and testing.
Many of the challenges commonly faced by students with these disabilities are not unlike those faced by other populations of students that typically struggle with statistics content. For example, both students with dyslexia (a common form of LD) and English Language Learners (ELL) struggle with an increased cognitive processing load, overloading working memory, when tackling language heavy problems albeit for different etiologies (Lundberg Citation2002). Therefore, interventions that are effective in improving the performance of students with disabilities may help the performance of other struggling populations of students.
There are several limitations of this study. First and foremost, the small sample does not provide sufficient power for the detection of the observed effect. This, unfortunately, is a common challenge when working with special populations. Further development and testing are needed of the proposed approach; however, the current data with an effect size of 0.37 has provided enough support to establish a proof of concept. Such pilot work provides preliminary evidence that can be leveraged to support a larger study with sufficient power to adequately test the proposed intervention. This study did not focus on student preferences or self-reported level of learning and comprehension, instead relying on less subjective measures. However, informally, students largely expressed a preference for the intervention approach. Additionally, the instructor adopted the guidelines outlined here for teaching beyond this study. Future iterations of this work will more formally explore this source of data.
Research on statistics education for students with disabilities at the postsecondary level is quite challenging and those doing work in this area can benefit from considering some design elements that can help address some of these challenges. Methodological challenges related to small sample size, within group variability, and high attrition rates all point toward adopting a within subjects repeated measures design rather than a between groups design when working with this population. While a within subjects design limits the external validity of the data, it provides more power and is a better means of piloting data when large samples are impractical. Furthermore, while the assessment used in this study hasn’t been formally validated, our experience highlights the need for assessments that are more broadly accessible and better able to assess comprehension of statistics concepts for students with disabilities. A further limitation is that the intervention group may have developed greater familiarity with the use of visual representations of data thereby leading to different performance on the assessments, however, both groups had extensive experience reading graphs and no students expressed difficulty in understanding the visual representations.
The approach described here is only made possible due to technological advances in terms of both hardware and software. Technology that is affordable, easy to use, and has sufficient computational power is now easily available to meet the computational needs of an introductory statistics classroom. However, there is room for significant improvement in terms of introductory statistics software. Software development in the field has primarily focused on the professional statistician but little attention has been paid to supporting the statistical exploration and comprehension of the struggling novice user. TinkerPlots is a great piece of software that has shown promise in supporting college students with disabilities learning statistics, but it is primarily intended for a younger audience and does not provide the tools necessary for some of the more advanced topics. There have been other promising tools such as Minitab Express and StatCrunch, but neither provides the intuitive use and low cognitive load of TinkerPlots. In addition, the easy availability of mobile devices holds the potential to allow students to not only see statistics but to touch and directly manipulate statistics in a manner that may significantly improve student comprehension. Software development along these lines combined with a pedagogical approach similar to the one described in this article holds the potential to make statistics accessible to the majority of college students.
Supplemental Material
Download PDF (340 KB)Supplementary Materials
Supplementary materials include all items used in the two-tiered assessment of key statistics concepts described in the Instruments section.
Additional information
Funding
References
- American Psychiatric Association (APA) (2013), Diagnostic and Statistical Manual of Mental Disorders (DSM-5) (5th ed.), Washington DC: American Psychiatric Association Publishing.
- Aliaga, M., Cobb, G., Cuff, C., Garfield, J., Gould, R., Lock, R., Moore, T., Rossman, A., Stephenson, B., Utts, J., Velleman, P., and Witmer, J. (2005), GAISE College Report. American Statistical Association. Available at http://www.amstat.org/education/gaise.
- AMATYC (2014), “Position on the Appropriate Use of Intermediate Algebra as a Prerequisite Course - American Mathematical Association of Two-Year Colleges.” Available at https://amatyc.site-ym.com/page/PositionInterAlg?.
- Aridor, K., and Ben-Zvi, D. (2018), “Statistical Modeling to Promote Students’ Aggregate Reasoning with Sample and Sampling,” ZDM, 50, 1165–1181.
- Ayres, P., and Paas, F. (2012), “Cognitive Load Theory: New Directions and Challenges,” Applied Cognitive Psychology, 26, 827–832. DOI: https://doi.org/10.1002/acp.2882.
- Barnard, L., Muldoon, K., Hasan, R., O’Brien, G., and Stewart, M. (2008), “Profiling Executive Dysfunction in Adults with Autism and Comorbid Learning Disability,” Autism: The International Journal of Research and Practice, 12, 125–141. DOI: https://doi.org/10.1177/1362361307088486.
- Baxter, J. A., Woodward, J., and Olson, D. (2001), “Effects of Reform-based Mathematics Instruction on Low Achievers in Five Third-Grade Classrooms,” The Elementary School Journal, 101, 529–547.
- Bottge, B. A., Rueda, E., LaRoque, P. T., Serlin, R. C., and Kwon, J. (2007), “Integrating Reform-Oriented Math Instruction in Special Education Settings,” Learning Disabilities Research & Practice, 22, 96–109. DOI: https://doi.org/10.1111/j.1540-5826.2007.00234.x.
- Brown, T. E. (2006), Attention Deficit Disorder: The Unfocused Mind in Children and Adults, London: Yale University Press.
- CAST (2011), Universal Design for Learning Guidelines version 2.0, Wakefield, MA: Author, Available at https://udlguidelines.cast.org/binaries/content/assets/udlguidelines/udlg-v2-0/udlg_graphicorganizer_v2-0.pdf.
- Castro Sotos, A. E., Vanhoof, S., Van den Noortgate, W., and Onghena, P. (2007), “Students’ Misconceptions of Statistical Inference: A Review of the Empirical Evidence from Research on Statistics Education,” Educational Research Review, 2, 98–113. DOI: https://doi.org/10.1016/j.edurev.2007.04.001.
- Cobb, G. (1992), “Teaching Statistics,” Heeding the Call for Change: Suggestions for Curricular Action, 22, 3–43.
- Cobb, G. (2013), “What Might a Twenty-year-old Conference Tell us about the Future of Our Profession?” Journal of Statistics Education, 21, 1–17. Available at http://jse.amstat.org/v21n2/cobb.pdf.
- Cullinane, J., and Treisman, P. U. (2010), “Improving Developmental Mathematics Education in Community Colleges: A Prospectus and Early Progress Report on the Statway Initiative,” An NCPR working paper. National Center for Postsecondary Research.
- Cumming, G., and Calin-Jageman, R. (2017), Introduction to the new statistics: Estimation, Open Science, and Beyond, New York: Routledge.
- Eagan, K., Stolzenberg, E. B., Ramirez, J. J., Aragon, M. C., Suchard, M. R., and Hurtado, S. (2014), The American Freshman: National Norms Fall 2014, Los Angeles: Higher Education Research Institute, UCLA. Available at https://www.heri.ucla.edu/monographs/TheAmericanFreshman2014.pdf.
- Faul, F., Erdfelder, E., Buchner, A., and Lang, A. G. (2009), “Statistical Power Analyses Using G* Power 3.1: Tests for Correlation and Regression Analyses,” Behavior Research Methods, 41, 1149–1160.
- GAISE College Report ASA Revision Committee. (2016), “Guidelines for Assessment and Instruction in Statistics Education College Report 2016,” Available at http://www.amstat.org/education/gaise.
- Garfield, J. (1995), “How Students Learn Statistics,” International Statistical Review/Revue Internationale de Statistique, 63, 25–34. DOI: https://doi.org/10.2307/1403775.
- Gargaro, B. A., Rinehart, N. J., Bradshaw, J. L., Tonge, B. J., and Sheppard, D. M. (2011), “Autism and ADHD: How Far have We come in the Comorbidity Debate?” Neuroscience and Biobehavioral Reviews, 35, 1081–1088. DOI: https://doi.org/10.1016/j.neubiorev.2010.11.002.
- Geurts, H. M., and Embrechts, M. (2008), “Language Profiles in ASD, SLI, and ADHD,” Journal of Autism and Developmental Disorders, 38, 1931–1943. DOI: https://doi.org/10.1007/s10803-008-0587-1.
- Gigerenzer, G., Gaissmaier, W., Kurz-Milcke, E., Schwartz, L. M., and Woloshin, S. (2007), “Helping Doctors and Patients Make Sense of Health Statistics,” Psychological Science in the Public Interest, 8, 53–96. DOI: https://doi.org/10.1111/j.1539-6053.2008.00033.x.
- Goldberg, M. C., Mostofsky, S. H., Cutting, L. E., Mahone, E. M., Astor, B. C., Denckla, M. B., and Landa, R. J. (2005), “Subtle Executive Impairment in Children with Autism and Children with ADHD,” Journal of Autism and Developmental Disorders, 35, 279–293. DOI: https://doi.org/10.1007/s10803-005-3291-4.
- Government Accountability Office (2009), Higher Education and Disability: Education Needs a Coordinated Approach to Improve Its Assistance to Schools in Supporting Students (GAO-10-33). Available at http://www.gao.gov/products/GAO-10-33.
- Greven, C. U., Kovas, Y., Willcutt, E. G., Petrill, S. A., and Plomin, R. (2014), “Evidence for Shared Genetic Risk between ADHD Symptoms and Reduced Mathematics Ability: A Twin Study,” Journal of Child Psychology and Psychiatry, and Allied Disciplines, 55, 39–48. DOI: https://doi.org/10.1111/jcpp.12090.
- Greven, C. U., Rijsdijk, F. V., Asherson, P., and Plomin, R. (2012), “A Longitudinal Twin Study on the Association between ADHD Symptoms and Reading,” Journal of Child Psychology and Psychiatry, and Allied Disciplines, 53, 234–242. DOI: https://doi.org/10.1111/j.1469-7610.2011.02445.x.
- Hall, J. (2008), “Using Census at School and Tinkerplots to support Ontario Elementary Teachers’ Statistics Teaching and Learning,” in Joint ICMI/IASE Study: Teaching Statistics in School Mathematics. ICMI/IASE. Available at https://www.stat.auckland.ac.nz/∼iase/publications/rt08/T6P4_Hall.pdf.
- Hammerman, J. K., and Rubin, A. (2004), “Strategies for Managing Statistical Complexity with New Software Tools,” Statistics Education Research Journal, 3, 17–41. Available at https://www.terc.edu/publications/strategies-for-managing-statistical-complexity-with-new-software-tools/.
- Herrmann-Abell, C. F., and DeBoer, G. E. (2014), “Developing and Using Distractor-Driven Multiple-Choice Assessments Aligned to Ideas about Energy forms, Transformation, Transfer, and Conservation,” in Teaching and Learning of Energy in K–12 Education, eds. R. F. Chen, A. Eisenkraft, D. Fortus, J. Krajcik, K. Neumann, J. Nordine, and A. Scheff, pp. 103–133, Cham: Springer.
- Horowitz, S. H., Rawe, J., and Whittaker, M. C. (2017), The State of Learning Disabilities: Understanding the 1 in 5, New York: National Center for Learning Disabilities.
- Kahneman, D. (2011), Thinking, Fast and Slow, New York: Farrar, Straus and Giroux.
- Kirschner, P. A., Sweller, J., and Clark, R. E. (2006), “Why Minimal Guidance During Instruction Does not Work: An Analysis of the Failure of Constructivist, Discovery, Problem-based, Experiential, and Inquiry-based Teaching,” Educational Psychologist, 41(2), 75–86.
- Konold, C. (1995), “Issues in Assessing Conceptual Understanding in Probability and Statistics,” Journal of Statistics Education, 3, 1–9. DOI: https://doi.org/10.1080/10691898.1995.11910479.
- Konold, C., and Miller, C. D. (2005), TinkerPlots: Dynamic Data Exploration, Emeryville, CA: Key Curriculum Press.
- Lee, H., and Hollebrands, K. (2008), “Preparing to Teach Mathematics with Technology: An Integrated Approach to Developing Technological Pedagogical Content Knowledge,” Contemporary Issues in Technology and Teacher Education, 8, 326–341.
- Leitner, Y. (2014), “The Co-occurrence of Autism and Attention Deficit Hyperactivity Disorder in Children – What do we know?” Frontiers in Human Neuroscience, 8, 268. DOI: https://doi.org/10.3389/fnhum.2014.00268.
- Lesh, R. (2010), “Tools, Researchable Issues & Conjectures for Investigating What it Means to Understand Statistics (or Other Topics) Meaningfully,” Journal of Mathematical Modelling and Application, 1, 16–48.
- Lichtenstein, P., Carlström, E., Råstam, M., Gillberg, C., and Anckarsäter, H. (2010), “The Genetics of Autism Spectrum Disorders and Related Neuropsychiatric Disorders in Childhood,” The American Journal of Psychiatry, 167, 1357–1363. DOI: https://doi.org/10.1176/appi.ajp.2010.10020223.
- Lundberg, I. (2002), “Second Language Learning and Reading with the Additional Load of Dyslexia,” Annals of Dyslexia, 52, 165–187.
- Mayes, S. D., Calhoun, S. L., and Crowell, E. W. (2000), “Learning Disabilities and ADHD Overlapping Spectrumn Disorders,” Journal of Learning Disabilities, 33, 417–424. DOI: https://doi.org/10.1177/002221940003300502.
- Mayes, S. D., and Calhoun, S. L. (2006), “Frequency of Reading, Math, and Writing Disabilities in Children with Clinical Disorders,” Learning and Individual Differences, 16, 145–157. DOI: https://doi.org/10.1016/j.lindif.2005.07.004.
- Mcguire, J. M., Scott, S. S., and Shaw, S. F. (2006), “Universal Design and its Applications in Educational Environments,” Remedial and Special Education, 27, 166–175. DOI: https://doi.org/10.1177/07419325060270030501.
- Meltzer, L. (2018), Executive Function in Education: From Theory to Practice, New York: Guilford Publications.
- Mikami, A. Y., Miller, M., and Lerner, M. D. (2019), “Social Functioning in Youth with Attention-Deficit/Hyperactivity Disorder and Autism Spectrum Disorder: Transdiagnostic Commonalities and Differences,” Clinical Psychology Review, 68, 54–70.
- National Council of Teachers of Mathematics (1989), Curriculum and Evaluation Standards for School Mathematics, Reston, VA: NCTM.
- National Council of Teachers of Mathematics (2000), Principles and Standards for School Mathematics, Reston, VA: NCTM.
- National Governors Association Center for Best Practices, Council of Chief State School Officers (2010), Common Core State Standards for Mathematics, Washington, D.C.: National Governors Association Center for Best Practices, Council of Chief State School Officers.
- Noll, J., and Kirin, D. (2017), “TinkerPlots Model Construction Approaches for Comparing Two Groups: Student Perspectives,” Statistics Education Research Journal, 16, 213–243. Available at https://iase-web.org/documents/SERJ/SERJ16(2)_Noll.pdf.
- Noll, J., Kirin, D., Clement, K., and Dolor, J. (2021), “Revealing Students’ Stories as they Construct and Use a Statistical Model in TinkerPlots to Conduct a Randomization Test for Comparing Two Groups,” Mathematical Thinking and Learning, 1–20. Available at https://www.tandfonline.com/doi/abs/101080/10986065.2021.1922858.
- O’Brien, G., and Pearson, J. (2004), “Autism and Learning Disability,” Autism, 8, 125–140. DOI: https://doi.org/10.1177/1362361304042718.
- Paas, F., Renkl, A., and Sweller, J. (2003), “Cognitive Load Theory and Instructional Design: Recent Developments,” Educational Psychologist, 38, 1–4. DOI: https://doi.org/10.1207/S15326985EP3801_1.
- Paparistodemou, E., and Meletiou-Mavrotheris, M. (2008), “Developing Young Students’ Informal Inference Skills in Data Analysis,” Statistics Education Research Journal, 7, 83–106. Available at https://iase-web.org/documents/SERJ/SERJ7(2)_Paparistodemou.pdf?1402525008
- Raghubar, K. P., Barnes, M. A., and Hecht, S. A. (2010), “Working Memory and Mathematics: A Review of Developmental, Individual Difference, and Cognitive Approaches,” Learning and Individual Differences, 20, 110–122. DOI: https://doi.org/10.1016/j.lindif.2009.10.005.
- Rommelse, N. N. J., Franke, B., Geurts, H. M., Hartman, C. A., and Buitelaar, J. K. (2010), “Shared Heritability of Attention-Deficit/Hyperactivity Disorder and Autism Spectrum Disorder,” European Child & Adolescent Psychiatry, 19, 281–295. DOI: https://doi.org/10.1007/s00787-010-0092-x.
- Ronald, A., Simonoff, E., Kuntsi, J., Asherson, P., and Plomin, R. (2008), “Evidence for Overlapping Genetic Influences on Autistic and ADHD Behaviours in a Community Twin Sample,” Journal of Child Psychology and Psychiatry, 49, 535–542.
- Rose, D. H., and Meyer, A. (2002), Teaching Every Student in the Digital Age: Universal Design for Learning, Alexandria, VA: ASCD.
- Rose, D. H., Meyer, A., and Hitchcock, C. (2005), The Universally Designed Classroom: Accessible Curriculum and Digital Technologies, Cambridge, MA: Harvard Education Press.
- Schuchardt, K., Maehler, C., and Hasselhorn, M. (2008), “Working Memory Deficits in Children with Specific Learning Disorders,” Journal of Learning Disabilities, 41, 514–523. DOI: https://doi.org/10.1177/0022219408317856.
- Semrud-Clikeman, M., and Schafer, V. (2000), “Social and Emotional Competence in Children with ADHD and/or Learning Disabilities,” Journal of Psychotherapy in Independent Practice, 1, 3–19. DOI: https://doi.org/10.1300/J288v01n04_02.
- Smith-Spark, J., Fisk, J., Fawcett, A., and Nicolson, R. (2003), “Investigating the Central Executive in Adult Dyslexics: Evidence from Phonological and Visuospatial Working Memory Performance,” European Journal of Cognitive Psychology, 15, 567–587. DOI: https://doi.org/10.1080/09541440340000024.
- Stolzenberg, E. B., Eagan, K., Romo, E., Tamargo, E. J., Aragon, M. C., Luedke, M., and Kang, N. (2019), “The American Freshman: National Norms Fall 2018,” Available at https://www.heri.ucla.edu/monographs/TheAmericanFreshman2018.pdf.
- Stone, B. W., Kay, D., and Reynolds, A. (2019), “Teaching Visually Impaired College Students in Introductory Statistics,” Journal of Statistics Education, 27, 225–237. DOI: https://doi.org/10.1080/10691898.2019.1677199.
- Tishkovskaya, S., and Lancaster, G. A. (2012), “Statistical Education in the 21st Century: A Review of Challenges, Teaching Innovations and Strategies for Reform,” Journal of Statistics Education, 20. DOI: https://doi.org/10.1080/10691898.2012.11889641.
- Vaidya, C. J., You, X., Mostofsky, S., Pereira, F., Berl, M. M., and Kenworthy, L. (2020), “Data-Driven Identification of Subtypes of Executive Function Across Typical Development, Attention Deficit Hyperactivity Disorder, and Autism Spectrum Disorders,” Journal of Child Psychology and Psychiatry, and Allied Disciplines, 61, 51–61.
- von Roten, F. C., and de Roten, Y. (2013), “Statistics in Science and in Society: From a State-of-the-Art to a New Research Agenda,” Public Understanding of Science (Bristol, England), 22, 768–784. DOI: https://doi.org/10.1177/0963662513495769.
- Wagler, A. E., and Lesser, L. M. (2011), “Teaching Statistics to Culturally and Linguistically Diverse Students,” in Proceedings of the 2011 Joint Statistical Meetings, Section on Statistical Education, pp. 821–830.
- Willcutt, E. G. (2014), “Behavioral Genetic Approaches to Understand the Etiology of Comorbidity.” in Behavior Genetics of Psychopathology, eds. S. H. Rhee and A. Ronald, pp. 231–252, New York: Springer. DOI: https://doi.org/10.1007/978-1-4614-9509-3_8.
- Woodward, J., and Montague, M. (2002), “Meeting the Challenge of Mathematics Reform for Students with LD,” The Journal of Special Education, 36, 89–101. DOI: https://doi.org/10.1177/00224669020360020401.
- Zablotsky, B., Bramlett, M. D., and Blumberg, S. J. (2017), “The Co-occurrence of Autism Spectrum Disorder in Children with ADHD,” Journal of Attention Disorders, 24, 94–103. DOI: https://doi.org/10.1177/1087054717713638.