Abstract
Collaborative statisticians are instrumental to maintaining the rigor and reproducibility of multidisciplinary projects on which they collaborate. Clear, complete, well-annotated records of data, its revising, analysis, interpretation, and presentation are essential. Many students do not know how to systematically and consistently organize their digital files and cannot reliably replicate (or find!) work that may have been performed on a collaborative project. This article describes a newly developed and required one semester collaborative statistics course that includes the explicit teaching of project organization in lecture, emphasis of these skills on linked homework assignments, and their closely supervised practice through a mentored collaborative project with multidisciplinary researchers. The tripartite design provided exposure to project organization concepts during the course, encouraged straightforward implementation through homework assignments, and then challenged students with a real-world experience during a collaborative project. Supplementary materials for this article are available online.
1 Introduction
Rigor and reproducibility are critical components of research (Groves and Godlee Citation2012; McKiernan et al. Citation2016; Broman et al. Citation2017; National Institutes of Health Citation2017; National Academies of Sciences, Engineering, and Medicine Citation2018, Citation2019). In many settings, meaningful research requires a multidisciplinary team science approach with an applied statistician who can translate the research question and previously collected data into an analytic plan and dataset, and who can thoughtfully apply the appropriate statistical methods and translate them for dissemination to the domain scientific community. As a result, collaborative statisticians are instrumental to maintaining the rigor and reproducibility of multidisciplinary projects. Clear, complete, well-annotated records of data, its revising, analysis, interpretation, and presentation are essential. Suggested methods for reproducible collaborative research and good statistical practice, including statistical programming and version control, exist (Preece Citation1987; Nagler Citation1995; Peng, Dominici, and Zeger Citation2006; Peng Citation2011; Ball and Medeiros Citation2012; Kass et al. Citation2016; Toelch and Ostwald Citation2018; Dogucu and Cetinkaya-Rundel Citation2022). However, these methods are often not explicitly taught in statistics coursework.
Being organized would seem to be an essential life skill that has been mastered for current students. As such, a common assumption by faculty is that students enrolled in statistics programs already have organizational skills prior to matriculation or that they are included in another course. It has been surprising over the years to work with countless students and mentees on collaborative projects and experience first-hand the difficulties that poorly documented and unorganized project files can cause. Much to our dismay, many students do not know how to systematically and consistently organize their digital files, use version control, and cannot reliably replicate (or find!) work that they have contributed on a collaborative project. Examples of problems encountered relating to poor documentation from students include: missed deadlines or faculty redoing existing work due to inability to quickly pickup a collaborative project during academic breaks or when the student may not be available; multiple students transitioning on/off a project leaving no clear record of how their work was related to each deliverable and which deliverables were completed or were in-progress; incorrect reported results due to mistakes in documentation requiring another round of project quality control and possible confusion by the investigator; time-consuming deviations from the analytic plan due to poor record-keeping. Unaddressed, students may be unaware that these problems will have a detrimental impact on reproducibility of future research. Intervention is needed to ensure a research workforce trained in appropriate project organization, an important component of rigorous, reproducible research methods (Harris et al. Citation2018).
One-on-one mentoring of students participating in multidisciplinary collaborative projects provides critical professional guidance on project organization, but these opportunities often are limited by availability of faculty mentors and inconsistency of individual training (although recommendations for reproducible teaching exist, Dogucu and Cetinkaya-Rundel Citation2022). For the broadest reach, statistics core coursework should explicitly teach best practices for organizing projects, including electronic files.
This article describes the explicit teaching of project organization in lecture, emphasis of these skills on linked homework assignments, and their closely supervised practice through a mentored collaborative project in a newly developed and required one semester collaborative statistics course for graduate (master’s and doctoral) biostatistics students. Students take the course during their second year in the program. There are no pre-requisites, although students have generally had numerous statistical methods courses and at least one statistical programming course, and most have not had any previous multidisciplinary collaboration experience. We teach students an approach that assumes they will be the statistician expert in a multidisciplinary team that includes at a minimum, a domain (non-statistics) investigator who needs a statistical team scientist for their research. In a statistical collaboration, the statistician takes the lead on analyzing the data and presenting results in an interpretable way, with substantial interaction from the domain investigator. The goal of the course is to facilitate the application of statistics skills (both quantitative and interpersonal) on a multidisciplinary research project, including encouraging aspects of rigor and reproducibility relevant for a statistical collaboration.
2 Materials and Methods
2.1 Part 1: Lecture
Having organized files and good documentation are essential skills in real-life collaborative statistics work to help foster rigor and reproducibility of research. In our course we include one entire lecture (approximately 1.5 contact hours) devoted to concepts on project organization and good programming practice to guarantee that these concepts are presented to students during their time in the program. The lecture is interactive and uses examples of projects with poor organization, limited version control, and minimal documentation to spur initial discussion followed by explicit descriptions of how to organize project files, implement version control, and recommendations for good programming practice.
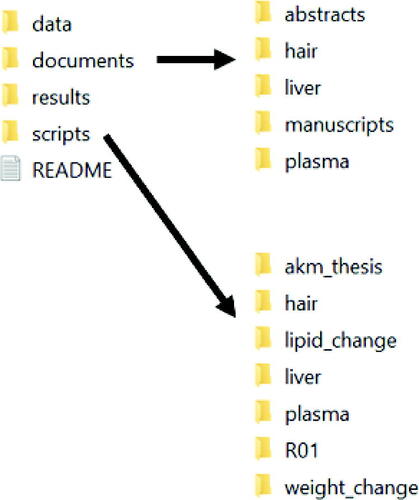
While recognizing that alternative structures may work in different situations, especially those for projects with extremely large datasets, complex pipelining of data, or a large data management and statistics team that needs to coordinate effort, we recommend a general strategy of creating the following folders for each statistical collaboration project: data, scripts, documents, and results.
The data folder stores all datasets associated with the project (including original, analytic datasets, format files, etc.). The data folder should have a subfolder where an original, raw, uneditable version of the data is archived and used for import into statistical software (similar to data and data_raw approach in R packages, Wickham, Bryan, and Barrett Citation2022). Projects with many different data sources can have a separate subfolder for each source. Complex projects that require many steps to create a final analytic dataset, including creation of derived/scored variables and/or requiring transformation of the data structure for the statistical methodology to be applied, may benefit from saving interim datasets. We recommend creating two final analytic datasets: (i) a full, reference version that contains all of the raw variables, the derived variables important for quality control, and the derived variables for analysis and (ii) a smaller version that contains just the relevant variables for analysis that is easier for investigators to work with. We find that students get confused about what qualifies as data so we suggest a strategy that defines data as anything that is read into statistical software. We also suggest that modified data (subsets, new derived variables, scoring of individual items for a construct total score, etc.) should be saved for future reference and reproducibility. An essential step toward reproducibility is the ability to replicate all descriptive and analytic results that are disseminated beyond the multidisciplinary research team (such as a manuscript or other product) with the final saved dataset.
The scripts folder stores all statistical programs/syntax/scripts/code (called “scripts” hereafter) used for the project (and statistical scripts should be used as much as possible when handling data!). As collaborative statisticians, much of the documentation of our work is included in statistical scripts tailored to each individual project. Script file names should explicitly describe what step in the research process the script is for and what the script is intended to do, from reading in the original data to creating the analytic dataset to summary statistics to multivariable modeling (see ). R Markdown files (typically a blend of code, study documentation, and presentation of results) should be stored here as well (Baumer et al. Citation2014; Dvorak et al. Citation2019; Allaire et al. Citation2022).
Fig. 1 Example of clearly labeled and ordered statistical scripts.
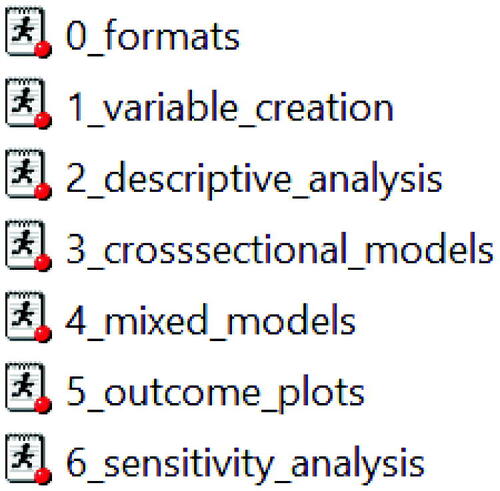
Always use good programming practice, which includes: informative script headers, readable code, use of comments, and creation of separate scripts for distinct parts of the project. (Lafler and Rosenbloom Citation2017; Marwick, Boettiger, and Mullen Citation2018; coding2share Citation2021; Google Citation2021; Vable, Diehl, and Glymour Citation2021). Since collaborative projects are unique combinations of data and investigation of research questions, it is imperative to comment before and after every programming step to explain why you are doing something (before) and explain the finding, especially if unexpected (after). When adding or removing observations or merging files, keep track of observations (at each level of the data, if appropriate) at each step to quickly determine if a mistake has led to unintentional data modifications.
The results folder stores all output from the scripts and any derived tables and figures. Spreadsheets, Word tables, RTF files, plots, figures, PDFs of output, all are stored in this folder. We suggest to students that if statistical scripts directly produced it or it was created from results derived from statistical scripts, the files should go in this folder. Collaborative statistics is unique in that there are different intended audiences for various aspects of the analysis results; subfolders can be used to distinguish the three types of results:
comprehensive: relevant to the statistics team to implement quality control, verify assumptions are met, investigate issues, model building steps, etc.
collaborator: streamlined findings shared with the domain investigator
circulation: final publication-ready results (Moore and Mehta Citation2022a, Citation2022b).
The documents folder stores all of the written documents for the project. There may be subfolders for references (statistical and/or domain), article or conference submissions, primary literature/scoring manuals for psychometric scales and other constructs, etc. Importantly, statisticians must document decisions and revised analytic plans during the course of the project. Again, collaborative statistics is unique in that statistical methods documents need to accommodate for three sets of audiences: statisticians, domain investigators, and the broader scientific community (through publication or other dissemination product).
In the root project folder, create a README file to orient someone to the electronic files or for processes that will be repeated throughout a study (e.g., specific data cleaning rules and scoring algorithm at multiple time points). We note that ideally the root project folder will be stored on a secure server and/or cloud location (such as a network drive, Git repository, OneDrive) that meets all project regulatory needs with access limited to approved team members while allowing for version control. The storage approach should provide privacy, back-up, and version control while enabling collaboration between team members. Appropriate consideration of version control is important for reproducible statistical collaboration (Toelch and Ostwald Citation2018; Beckman et al. Citation2021), although the strategy for implementation may vary by project type and scope, funder, and institution.
Consistent use of an organizational filing structure reduces confusion about where relevant files might be located. We provide this structure as general guidance and encourage adaption when needed. illustrates this organizational system in a project folder with numerous subprojects.
Fig. 2 Example project file organization for a large project with many subprojects.
2.2 Part 2: Homework
In our experience, just lecturing on these points is insufficient and students must be required to actually practice these file organization and documentation skills. In combination with the lecture, we assign a multipart homework assignment that builds on previous steps so that students greatly benefit by having organized scripts and files that they can find and refer back to (Appendix A, supplementary materials describes the assignment, Appendix B, supplementary materials provides an example rubric, data available at Mehta and Moore Citation2022). As a result, the homework illustrates the need for rigor and reproducibility in their own work. The homework mimics a real-life collaborative project where a domain investigator requests statistical collaboration on a research question(s), which has not yet been well articulated, and provides a messy longitudinal dataset in several spheres (demographics, types of laboratory tests). The data for each sphere are in different tabs of an Excel spreadsheet and are filled with content that will not read into statistical software such as highlighting, nonuniform formatting of columns and rows, and unclear unique identifiers. The first assignment is to review the data and think critically about the data and research question. The second assignment is to import the data and begin quality assessment, the third is to merge the data from domains into one file, and the fourth is to create the derived variables for the analysis. After the second assignment, a revised Excel spreadsheet is provided to students reflecting real-life experience of updated datasets based on conversation with the domain investigator. (For the course, conversation with the domain investigator is operationalized via small group discussion or discussion board conversations with classmates and we the faculty acting as the domain investigator.) The primary goal of this series of four assignments is to encourage students to think critically about the data received and the research question (not initially given). Then they need to transform the (terribly messy) raw data into a single analytic dataset that can answer the research question. Their work highlights the need for reproducible programming and organized files as the assignment progresses. Students unable to find the right files or appropriately target script sections to modify, must spend more time programming to complete the assignment than peers who implemented the recommendations provided in lecture. To further encourage appropriate documentation, statistical scripts are graded for good programming practice. An additional bonus of this approach is that students are impacted first-hand by their own poor documentation, whereas in practice, poor documentation often affects individuals who are downstream.
2.3 Part 3: Mentored Project
In our statistical collaboration course, one component of the course is participation in a real-life collaborative project that has one of the course instructors as the faculty mentor for the project. Clinical and translational investigators seeking statistics collaboration or who had limited funding for assistance volunteered collaborative projects for the course. Examples of projects include analysis of pilot data to inform future study design, statistical review of a grant application including power/sample size calculations, analysis of phase 1 (safety) clinical trial data, analysis of longitudinal and repeated measures data from an interventional study, among others. Statistical collaboration is not one-size-fits-all and in our course, we try to teach critical thinking, including adapting project organization and documentation to fit the needs of the project. We have found that even after we lecture and assign homework that requires organization and good documentation, many students have trouble transitioning these skills to a real-world setting and do not organize or document their work appropriately for the collaborative project. In response, we recommend setting up a shared project site on a network drive or other secure space that meets the appropriate regulatory needs, with the organization system described above. Then faculty mentors actively monitor students’ programming and documentation while they are engaged in the project. Correcting file misplacements, relabeling files for clarity, ensuring good programming practice, creating informative statistical analysis plans, revising methods and results sections all reinforce the idea that reproducibility of research hinges on systematic file placement and clear, comprehensive statistical scripts. In addition, statistical collaborations are commonly iterative and this back-and-forth experience provides further incentive to students for good project organization in order to reduce redundancy.
3 Results
The material presented reflects an evolution over three semesters of a statistical collaboration course taught at either the Masters or doctoral level. End of course evaluations consistently find that a majority of students (range: 61%–88%) think the course challenged and stimulated their thinking. While positive end of course evaluations are suggestive of appreciation of the content and delivery of course materials, the true benefit of the skills taught in our collaborative statistics course occurs when students begin working independently on collaborative research projects. Often this happens near graduation or after the student enters the workforce. We have heard anecdotally from graduating students that our course helped them demonstrate proficiency on skills tests that may be required for employment consideration. During subsequent professional interactions with former students, we have also heard that our course eases the transition from being a student concerned about academic success to full-time employee concerned with workplace productivity.
4 Discussion
Collaborative statisticians are integral to the success of multidisciplinary research projects and have an essential responsibility for rigor and reproducibility of the data-driven project conclusions. Comprehensive and organized project documentation, including version control, is an important facet of rigor and reproducibility. This systematic structure allows collaborative statisticians to easily transition projects, have work reproduced by another knowledgeable statistician, respond to reviewers or questions months or years after project completion, and provide understandable and implementable statistical scripts along with clean, useful analytic datasets to investigators, funders, or public repositories. Students often are not explicitly taught these basic skills in organization during their coursework, but they are critical to success as a collaborative statistician. Basic and easily implemented file organization, version control, and good statistical programming practice are key steps in ensuring rigor and reproducibility of analytic work. As part of a scaffolded pedagogical practice focused on rigor and reproducibility, we recommend directly teaching this material to students in a collaborative statistics class, practice through homework, and mentored real-life project work to ensure students leave their statistics programs with these skills ready for the workforce.
This tripartite framework follows pedagogical best practices for sequential learning by facilitating project organization skills that are key to rigor and reproducibility via (i) didactic lecture (ii) practice without the domain investigator but on an example motivated by real-life, and (iii) prospective hands-on application with a domain investigator and mentorship by statistics faculty (Ambrose Citation2010). The tripartite framework allows students to gradually build these skills with a faculty mentor, and to experience the consequences of not employing these skills before the pressures of the workforce. Our hope is that after completing the course, students can employ good project organization skills in a multidisciplinary research setting as a team scientist translating statistical findings into scientific domain conclusions while upholding rigor and reproducibility.
Author’s Contributions
Conceptualization: CCM, RHM; Writing-original draft: CCM, RHM; Writing-review and editing: CCM, RHM.
Supplemental Material
Download Zip (37.3 KB)Acknowledgments
We would like to thank all of the domain investigators who volunteered their research projects, time, and effort helping statistics students improve their statistical collaboration skills.
Supplementary Materials
Appendix A: Example Instructions for a Four-Part Homework Series Re-Enforcing Project Organization and Good Programming Practice.
Appendix B: Example Rubric for Part 3 of the Four-Part Homework Series Re-Enforcing Project Organization and Good Programming Practice.
4 Disclosure Statement
No conflicts of interest noted.
References
- Allaire, J., Xie, Y., McPherson, J., Luraschi, J., Ushey, K., Atkins, A., Wickham, H., Cheng, J., Chang, W., and Iannone, R. (2022), “rmarkdown: Dynamic Documents for R.” in R package version 2.14. Available at https://pkgs.rstudio.com/rmarkdown/.
- Ambrose, S. A. (2010), How Learning Works: Seven Research-Based Principles for Smart Teaching (1st ed.), San Francisco, CA: Jossey-Bass.
- Ball, R., and Medeiros, N. (2012), “Teaching Integrity in Empirical Research: A Protocol for Documenting Data Management and Analysis,” The Journal of Economic Education, 43, 182–189. DOI: 10.1080/00220485.2012.659647.
- Baumer, B., Cetinkaya-Rundel, M., Bray, A., Loi, L., and Horton, N. J. (2014), “R Markdown: Integrating A Reproducible Analysis Tool into Introductory Statistics,” Technology Innovations in Statitstics Education, 8. DOI: 10.5070/T581020118.
- Beckman, M. D., Çetinkaya-Rundel, M., Horton, N. J., Rundel, C. W., Sullivan, A. J., and Tackett, M. (2021), “Implementing Version Control With Git and GitHub as a Learning Objective in Statistics and Data Science Courses,” Journal of Statistics and Data Science Education, 29, S132–S144. DOI: 10.1080/10691898.2020.1848485.
- Broman, K., Cetinkaya-Rundel, M., Nussbaum, A., Paciorek, C., Peng, R., Turek, D., and Wickham, H. (2017), “Recommendations to Funding Agencies for Supporting Reproducible Research,” Available at https://www.amstat.org/asa/files/pdfs/POL-ReproducibleResearchRecommendations.pdf.
- coding2share (2021), “Reproducible Research Toolkit,” Available at https://coding2share.github.io/ReproducibilityToolkit/.
- Dogucu, M., and Cetinkaya-Rundel, M. (2022), “Tools and Recommendations for Reproducible Teaching,” Available at https://arxiv.org/pdf/2202.09504.pdf: arxiv.
- Dvorak, T., Halliday, S. D., O’Hara, M., and Swoboda, A. (2019), “Efficient Empiricism: Streamlining Teaching, Research, and Learning in Empirical Courses,” The Journal of Economic Education, 50, 242–257. DOI: 10.1080/00220485.2019.1618765.
- Google (2021), “Google’s R Style Guide,” available at https://google.github.io/styleguide/Rguide.html.
- Groves, T., and Godlee, F. (2012), “Open Science and Reproducible Research,” BMJ, 344, e4383. DOI: 10.1136/bmj.e4383.
- Harris, J. K., Johnson, K. J., Carothers, B. J., Combs, T. B., Luke, D. A., and Wang, X. (2018), “Use of Reproducible Research Practices in Public Health: A Survey of Public Health Analysts,” PLoS One, 13, e0202447. DOI: 10.1371/journal.pone.0202447.
- Kass, R. E., Caffo, B. S., Davidian, M., Meng, X. L., Yu, B., and Reid, N. (2016), “Ten Simple Rules for Effective Statistical Practice,” PLoS Computational Biology, 12, e1004961. DOI: 10.1371/journal.pcbi.1004961.
- Lafler, K. P., and Rosenbloom, M. (2017), “Best Practice Programming Techniques for SAS Users,” in SAS Global Forum Conference Proceedings, p. 175.
- Marwick, B., Boettiger, C., and Mullen, L. (2018), “Packaging Data Analytical Work Reproducibly Using R (And Friends),” The American Statistician, 72, 80–88. DOI: 10.1080/00031305.2017.1375986.
- McKiernan, E. C., Bourne, P. E., Brown, C. T., Buck, S., Kenall, A., Lin, J., McDougall, D., Nosek, B. A., Ram, K., Soderberg, C. K., Spies, J. R., Thaney, K., Updegrove, A., Woo, K. H., and Yarkoni, T. (2016), “How Open Science helps Researchers Succeed,” eLife, 5, e16800. DOI: 10.7554/eLife.16800.
- Mehta, C. C., and Moore, R. H. (2022), “Example Investigator Collected Data for Students Learning Statistics Collaboration Skills,” UNC Dataverse. 2022 Jan 26. DOI: 10.15139/S3/JKLBZF,.V1.
- Moore, R. H., and Mehta, C. C. (2022a), “The 3 C’s for Collaborative Statistics: Tiers of Effective Communication,” in 2022 Conference on Statistical Practice.
- Moore, R. H., and Mehta, C. C. (2022b), “The 3 Cs for Collaborative Statistics: Tiers of Effective Communication,” in Electronic Conference on Teaching Statistics 2022.
- Nagler, J. (1995), “Coding Style and Good Computing Practices,” PS: Political Science & Politics, 28, 488–492.
- National Academies of Sciences, Engineering, and Medicine (2018), Data Science for Undergraduates: Opportunities and Options, Washington, DC: The National Academies Press.
- National Academies of Sciences, Engineering, and Medicine (2019), Reproducibility and Replicability in Science, Washington, DC: The National Academies Press.
- National Institutes of Health (2017), “Rigor and Reproducibility: Principles and Guidelines for Reporting Preclinical Research,” Available at https://www.nih.gov/research-training/rigor-reproducibility/principles-guidelines-reporting-preclinical-research.
- Peng, R. D. (2011), “Reproducible Research in Computational Science,” Science, 334, 1226–1227. DOI: 10.1126/science.1213847.
- Peng, R. D., Dominici, F., and Zeger, S. L. (2006), “Reproducible Epidemiologic Research,” American Journal of Epidemiology, 163, 783–789. DOI: 10.1093/aje/kwj093.
- Preece, D. A. (1987), “Good Statistical Practice,” Journal of the Royal Statistical Society, 36, 397–408.
- Toelch, U., and Ostwald, D. (2018), “Digital Open Science-Teaching Digital Tools for Reproducible and Transparent Research,” PLoS Biology, 16, e2006022. DOI: 10.1371/journal.pbio.2006022.
- Vable, A. M., Diehl, S. F., and Glymour, M. M. (2021), “Code Review as a Simple Trick to Enhance Reproducibility, Accelerate Learning, and Improve the Quality of Your Team’s Research,” Am J Epidemiol, 190, 2172–2177. DOI: 10.1093/aje/kwab092.
- Wickham, H., Bryan, J., and Barrett, M. (2022), “Create Package Data,” usethis 2.1.5 [online].