Abstract
Data Analytics has grown dramatically in importance and in the level of business deployments in recent years. It is used across most functional areas and applications, some of the latter including market campaigns, detecting fraud, determining credit, identifying assembly line defects, health services and many others. Indeed, the realm of analytics has famously grown to include major league sports and even U.S. election campaigns. Universities have raced to include data analytics in their curricula as the need for data scientists has become more acute. Unfortunately, many data science courses in college curricula suffer from various deficiencies: some lack a hands-on component, others are insufficiently experiential, and yet others leave students with too few transferable skills. This article describes an experiential approach to teaching data analytics at the college level that uses an election simulation, MISSimulation.com—to communicate key data science concepts in a competitive setting. Many universities actively use the simulation, combined with analytic tools such as Tableau and Excel, to implement team competition. We explore key techniques used and knowledge learned during the typical teaching of a data analytics course using the simulation. We end with pedagogical review of data analytics skills transferred during the course and student feedback.
1 Introduction
Data Analytics represent a set of transformational techniques, models, and technologies that use software to extract useful, actionable insights from data to support organizational decisions. It ranges from basic descriptive and diagnostic analytics (what happened and why) to more complex predictive and prescriptive analytics (what will happen and what should we do). The field also stretches to Artificial Intelligence (AI)-based applications that can apply Machine Learning and human-like reasoning at scale to business tasks. Statista (Citation2021) estimates the global big data and business analytics market value at $168.8 billion in 2018 and forecast them to corporately reach $274.3 billion by 2022.
Research has found that the use of data analytics improves organizational performance through greater insights; and better foresight, preparation, and decision-making (Brynjolfsson, Hitt, and Kim Citation2011; Huang, Wang, and Huang Citation2020). This explains the explosion in recent years in the use of data analytics for descriptive, diagnostic, predictive and prescriptive purposes.
Higher education has responded by creating a wide variety of courses and curricula in data analytics (National Academies of Sciences 2018). These courses include introductory, survey-style courses, such as one taught at the University of Massachusetts (Yan and Davis Citation2019). This course—typical of many introductory courses—includes R Programming, data collection, exploratory data analysis and data visualization. More advanced courses introduce data mining and models such as neural networks, advanced statistical models, and decision trees (Saltz, Armour, and Sharda Citation2018). They also include courses covering data mining methodologies such as CRoss Industry Standard Process for Data Mining (CRISP-DM) as discussed by Jaggia et al. (Citation2020) and Jeyaraj (Citation2019), and how to move from business requirements to implementation of modeling results using cases (e.g., Hardin et al. Citation2015; Stanton and Stanton Citation2020).
One way that current curricula could be improved is by providing students with greater experiential learning. Some educators use case study analysis, others include work on static datasets, and yet others work with companies that have actual analytics problems they are willing to share with students. While the latter approach is often superior, such companies are few and far between for understandable reasons that include confidentiality of company data. This course, with its high-quality generated dataset can complement company datasets.
MISSimulation.com is a web-based election simulation developed by NorthernByte Systems Inc. It has been used by business analytics students in such universities as Eastern Oregon University, University of Manitoba, Drexel University, Southeastern University, Samford University, and others to learn the concepts of data analytics in a hands-on way, using realistic data. With the aid of such tools as Tableau and Excel, students manage an election campaign using supplied datasets about the electorate and the issues the electorate is interested in. They subsequently fashion targeted campaigns within set budgets using the data on electoral votes available in different areas, surveys of the population, and voter issue interest levels. Students play against the computer for practice and ultimately against each other (or the computer) to determine their score for this course component. In the process, they learn about many facets of analytics, including descriptive, diagnostic, predictive and prescriptive analytics.
The election simulation approach using MISSimulation.com, combined with tools like Tableau and Excel, provided students experiential learning of data analytics and decision modeling. At the conclusion of the course, students are better able to make data-based decisions that are less dependent on “gut-feeling” and more on what insights the data contains, using data-analytic approaches. This approach has proved very effective for teaching important concepts in a hands-on manner to our university’s data analytics students.
2 Data Analytics in Business School and University Curricula
Data analytics courses have been introduced into the curricula of many business schools over the last decade. As of mid-2021, the DataSciencePrograms.org (2021) website lists over 500 universities offering data science degrees at all levels, encompassing 980 different programs, with the MS Data Science degree being the most popular. As data scientists represent one of the fastest growing and in-demand professions, the take-up by students at the graduate and undergraduate levels has correspondingly increased.
US News and World Reports produces two categories and rankings of analytics programs, namely Data Analytics and Business Analytics (2021a, 2021b). Their top Data Analytics programs are almost exclusively located in Computer Science units (colleges or departments), while the Business Analytics programs are all sited in colleges of business. Additionally, in the College Transitions’ (Citation2022) independent ranking of analytics programs, over 90% of their top ranked data science and analytics programs are in Computer Science departments. However, data analytics courses are spreading to areas outside the traditional locations, such as medical schools and colleges of the arts. Giacomello and Preka (Citation2020) for example, demonstrated that students from the social sciences were able to successfully learn data science, including programming in Python to explore complex issues.
Lim and Heinrichs (Citation2021) created a marketing analytics course to conduct analyses on data for a hypothetical firm. They reported positive course evaluations and enhanced marketing analytics skills. Bulmer and Haladyn (Citation2011), Lesser et al. (Citation2013) and Kuiper and Sturdivant (Citation2015) also demonstrated the efficacy of simulation-based games and fun in statistics education.
Many approaches to teaching data analytics have been pursued in Business schools, such as
knowledge/content-based courses.
experiential/consulting courses.
experiential/data-based courses.
2.1 Knowledge/Content-Based Courses
These courses cover data analytics from a content perspective, and the scope can vary dramatically depending on what areas the professor chooses to focus upon. Arguably, this is the most popular model of course delivery, with the instructor teaching Data Science (2022) content using texts and software. Jaggia et al. (Citation2020) for example, describe a course based on the popular CRISP-DM methodology, to guide students through the systems lifecycle for data science-based business problems. Sometimes, courses may place greater emphasis on a particular sub-topic for example, databases. For instance, Wang and Wang (Citation2019) highlight the importance of database knowledge in analytics courses and propose an approach to incorporating database knowledge in analytics classes.
2.2 Experiential/Consulting Courses
Experiential learning is variously described as a form of learning where the learner not only learns conceptually and theoretically about a topic but directly contacts or applies concepts to a real work environment (Keeton and Tate Citation1978; Hyunjoo and Polidan Citation2018). Hyunjoo and Polidan in particular, propose experiential courses as being particularly effective in supplying students with appropriate skills that employers need. The consulting approach is often taken by many Business schools, who leverage their partnerships with different organizations to create projects where students can work on actual data science projects in those organizations. Speier-Pero and Schoenherr (Citation2020) describe one such project in a Master of Science in Business Analytics (MSBA) program, together with lessons learned and suggested best practices.
2.3 Experiential/Data-Based Courses
Another approach to experiential/data-based courses is des- cribed by Yazici (Citation2020). In this format, the students were given the responsibility for identifying and obtaining data for a research question of their choosing and then exploring and mining that data based on taught knowledge. Some other approaches here take advantage of data that is opportunistically available, such as from forum postings. Goh and Sun (Citation2015) for example, designed their course around social media analytics with a goal of analyzing and interpreting social media content. Their students analyzed forum postings from the Christchurch earthquake in New Zealand, and the Japanese earthquake and tsunami, in order to discover social insights.
Other approaches involve teaching data analytics from the perspective of a functional area. For example, Weirich, Tschakert, and Kozlowski (Citation2017) describe how accounting students used Audit Command Language (ACL) Analytics software to find fraudulent transactions injected into a sample of good transactions. This is used in auditing and forensic accounting classes to teach data analytics. It resulted in higher levels of student engagement in the learning process.
Renz and Hilbig (Citation2020) however identify the entry of EdTech companies into the data curriculum by providing platforms, for example, cloud, and specialized software, such as IBM’s Watson. Others, such as the software platform described in this article, offer both a cloud-based platform and simulation-based application to teach data analytics.
2.4 Face-to-Face vs Remote Teaching
Additionally, data analytics courses may be online or face-to-face as another dimension of instruction. Williams and Elmore (Citation2021) describe the difficulties faced by remote students in data analytics courses during the COVID-19 pandemic of 2020. They recommend building a class community, using multiple, small asynchronous pieces, and flexibility. However, the delivery method is not the focus of this paper, instead, the approaches to delivery and in particular, the experiential/data-based approach is the focus.
3 Using the Election Simulation in the Business Analytics Course
The data analytics course described in this section follows the experiential/data-based model of course delivery described previously. The key distinguishing aspect of the data-based element of the course, however, its use of simulation in addition to supplied data. The course reflects the balance between data-based and algorithm-based approaches suggested by Breiman (Citation2001).
This course is a graduate course in data analytics, located in the College of Business. The objectives of the course are (a) understanding data analytics concepts (b) mastering core skills of data collection, modeling, and analysis (c) learning data visualization, and (d) solving realistic problems across the entire solution life cycle using data analytics tools. The project was deemed exempt from human subjects oversight by the Drexel University IRB.
MISSimulation.com is a web-based, cloud-based election simulation developed by NorthernByte Systems Inc. The simulation supports “election candidates,” played by student teams vying to win an election by electoral votes or the Popular Vote. It supplies demographic and periodic polling data over an instructor-selected period to support teams making recurring campaign decisions. Teams (or individuals) manage an instructor-allocated campaign budget over the entire game that consists of several “Turns.” The simulation is data-intensive, with many datasets provided relating to voters and their preferences.
MISSimulation.com was selected for use in this course due to the realistic data environment provided within the simulation setting. It also allowed for cycles of decision making in a standardized competitive setting, allowing students to practice or play against the software or each other. The other attractive feature of the simulation is the rich and wide solution space, where multiple approaches can be used to gain victories.
We believe that the simulation was a marked improvement over past approaches to the course, which included static, one-pass case studies with no possibility of iterative decision-making and real company case studies of variable quality from term to term.
This objective for the simulation exercise is for each team to use data analytic tools to analyze the available data to make election campaign decisions to support their “candidate.” Specifically, the decisions include:
Purchasing datasets
Identifying locations to advertise in
Deciding the issues to campaign on
Deciding who to send campaign messages to
Formulating campaign spending for each round
In going beyond the deterministic Basic Level game to the Advanced Level game, students can include social media spending and raise more money over their fixed budget from corporations or the public. In addition, instructors can allow negative campaigning, initiate new surveys, and launch microblog campaigns. Such features introduce stochastic features to the simulation and add deeper levels of complexity.
Finally, instructors assign an identical budget for every team to cover campaigns and the cost of surveys. They then determine the number of “Turns” or game cycles. Teams run one campaign per Turn to target voters.
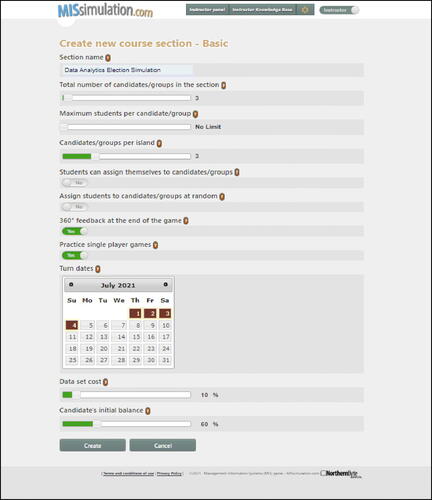
The last Turn precedes the final voter snapshot or election, determining the winner. A setup for a basic simulation election with three “candidates” is shown in .
Fig. 1 Instructor setup of an election simulation game with three candidates.
When the game is created, instructors can assign students to teams or allow self-selected teams. Each campaign or simulation game takes place on an Island and 3–4 teams (or candidates) per Island is preferred. Each team represents one candidate, and that term candidate will be used in the rest of the article as synonymous with team. Crucially, the system allows students to practice election simulations prior to the one that is graded. The players can execute broad brush actions in electoral areas that is, target all voters in an area (which is discouraged) or execute precisely tailored campaigns to target specific voters who feel strongly about the selected issues in the campaign.
In addition, the instructor must decide how many Turns to play the game over. Typically, an instructor may choose 4–7 Turns, meaning that the available campaign budget must be distributed over 4–7 decision points, making efficient budgeting a key element of the game. The instructor can also modify the cost of the datasets and the initial budgets of all candidates.
In essence therefore, this is a deeply analytical task, to spend assigned campaign funds as effectively as possible to win the election against other teams with the same objective.
Instruction preparation and planning is essential to provide the students with supports to ensure they do not get lost among the data. So, instructors provide “scaffolding” supports to ensure that the students use the right techniques at the right time. The first support is in team organization and ensuring that student teams have a balanced complement of skills in different areas, for example, statistics, programming, and business. This ensures synergistic, not duplicative team composition. Second and most important is that that several demonstrative practice runs take place prior to the game start, led by the instructor. This give students a firm grasp of the game’s fundamentals and different techniques that may be applied. Next, technical support is provided during the actual game, by teaching assistants when available and the instructor, when necessary, without compromising fairness. Usually, it is just to clarify certain Tableau or Excel functions. These scaffolding techniques ensured students did not get bogged down by mundane technical issues and could focus on critical thinking and a data-driven approach to competition.
3.1 Player Layout for the Simulation
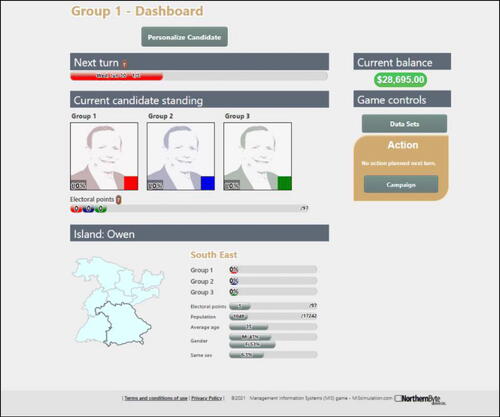
At the start of the simulation, each team can view:
The Electoral Points for all the candidates on the Island (“Owen” in this case)
The Popular Vote
The separate Areas on the island (including their populations, electoral votes, gender breakdowns, and average age etc.)
Their Competitiveness Index, showing how effective their efforts are.
Electoral votes or the Popular Vote attained by the end of the game are alternative metrics that may be selected by the course instructor as winning criteria. Each metric generally has different implications for election campaigns, just as they might so in reality. Whatever metric is selected, the instructor must make this known to all teams prior to commencing the actual simulation. In addition, the Popular vote option makes the simulation tool more widely acceptable and usable in countries that do not use the unique U.S. electoral vote-based system.
The details for the South–East Area are shown in for Group 1 at the start of the simulation. The displayed statistics are dynamically updated as the game progresses. In the South East, there are 5 electoral points available out of 97 total points and the population is 1048 of the island’s 17,242 total population. Other demographic breakdowns are also shown.
Fig. 2 Initial simulation layout at the start of a 3-candidate game.
3.2 Datasets
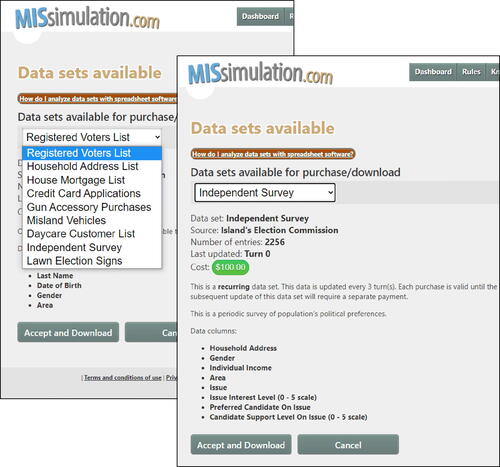
The heart of the simulation is analytics and the corresponding datasets that are available for each candidate. Some of the datasets are free, but others must be paid for by the candidate. Many datasets are issue-related for example, housing, guns, children, mortgages, or motor vehicles. These simulated datasets are downloadable as .csv files and therefore available for analytics using Excel, Tableau or other statistical or data visualization product selected by the instructor.
shows both the list of datasets and one key dataset in particular, The Independent Survey. The Independent Survey samples voters’ opinions on key issues of interest. This survey is cost-free, and students are encouraged to analyze it using various analytical tools to determine the nature of their election campaign and spending for the coming Turn. Every 3 Turns, a new survey is taken and becomes available to all teams.
Fig. 3 Downloading datasets during the game.
Once the Independent Survey file is downloaded (as a .csv file), students load it into their chosen analytics platform to make decisions about the: (a) issues to target (b) the areas to target, and (c) the demographics to target. In fact, all exchanges between MISSimulation and analytics tools take place in the form of .csv (text) files. From the simulation, various survey files can be downloaded, while market campaigns with lists of addresses can be uploaded to the simulation during each Turn.
Tableau has been the analytics tool of choice in this academic program, but other data science software or data visualization tools may be used as well. The two most popular choices outside of Tableau—which is taught in the class—are Excel and Python, based on most students having prior experience with them. One important point to mention is that each game is randomly generated data-wise in terms of demographics and issue interest, to avoid students learning to “game” the system over time.
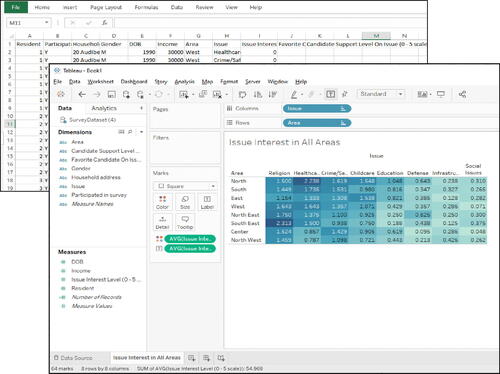
Of the eight areas on the Island, three (3) are selected for this Turn’s campaign based on their large numbers of electoral votes and financial constraints. They are the North West (21 Electoral Votes), South (18 EVs), and North (16EVs).
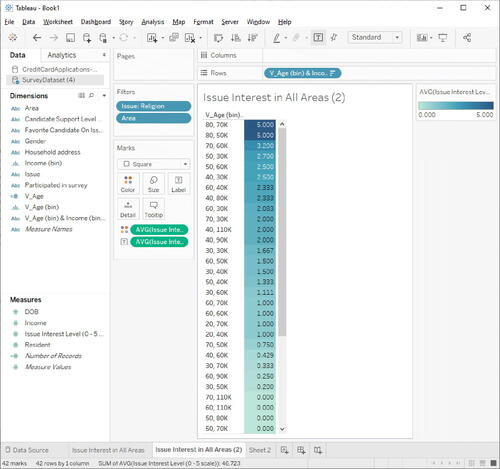
In this example, it becomes apparent that Religion, Healthcare, and Crime/Safety are the Issues with the strongest interest levels. However, given that each of the five campaigns must be based on one issue, Religion is chosen as the issue to campaign on, as shown in . The reason Religion is chosen is because it has the overall highest interest levels, as evidenced from its leftmost position (and darker columns) in the sorted Issue columns. It is #1 in the North West, #2 in the North, and #3 in the South.
Fig. 4 Issue interest in all areas on the island.
One possible next step in the analytic process is to:
Filter out issues other than Religion,
Filter out Areas other than the 3 selected, then:
Segment the survey population by features of interest. In this example, Age and Income are selected.
The idea behind this process is to identify at a fine-grained level, the Age and Income segments most desirable for targeting, based on Issue Interest. By stratifying Ages (10-year strata) and Incomes ($10 K strata), one possible segmentation scheme is shown in . They will be selected from the actual dataset, starting from “5” (Most interest in the issue) and working downwards. For example, the most desirable voter segment from the Independent Survey is the 80–90 year-old age group earning between $70,000 and $80,000.
Fig. 5 Targeted voter segments for the election campaign.
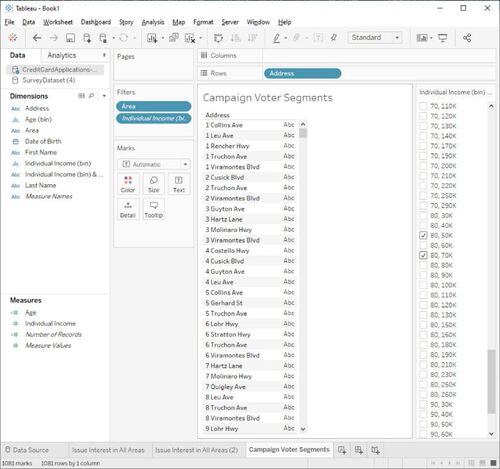
Once the most desirable voter segments have been identified, each team can download one of the previously shown datasets to select actual addresses that will receive campaign messages. Each address has one or more residents and costs $5 to be included in the campaign. Team decisions are then made about how many, and which specific addresses to be used for outreach. In this game, the decision is made to download the Credit Card Applications file, containing 10,641 addresses, at a cost of $850. Given the overall campaign budget of $28,695 to be spent over 5 Turns, we allocate $3695 for purchasing datasets, leaving $5000 per Turn. At $5/address, this implies roughly 1000 addresses.
The Credit Card Applications file includes (a) Voter Names (b) Date of Birth, (c) Area, (d) Address, and (e) Income. We filter by Area (South, North, Northwest), reducing target addresses to 4294. We then select Age and Income segments, remembering to use similar stratification to the sample survey. illustrates this process with the new dataset. Eight segments were selected, for a total of 1081 addresses and $5405 campaign spend.
Fig. 6 Actual voter addresses for the election campaign.
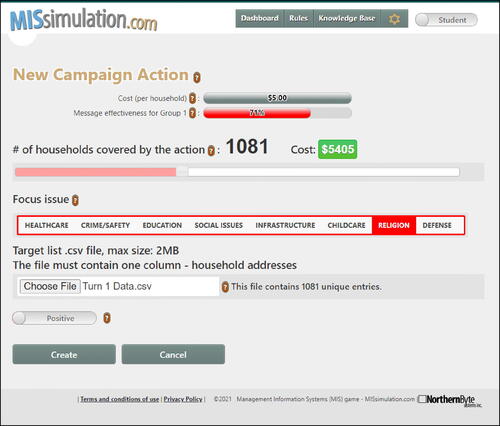
After exporting these addresses from Tableau as a .csv file, they are entered into the Campaign, focusing on Religion (see ).
Fig. 7 Loading campaign addresses for Turn 1.
Once all teams have uploaded their campaigns, the instructor executes the Turn from the Dashboard. Turns can also be set to execute automatically by a certain date and time. In , we see the results of the executed Turn (#1), given that the computer played for the other 2 candidates. An important point to note is that teams are unaware of their competitors’ actions until the instructor “Turns” or executes the game.
Fig. 8 Results of Turn 1 campaigns.
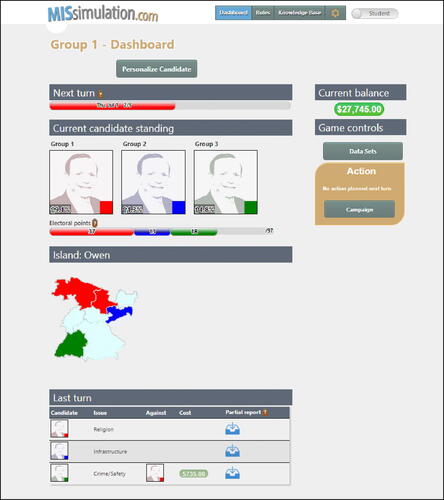
The results were good for our selected candidate, as shown in . The candidate captured the North and the Northwest for a total of 37 electoral votes, leaving Groups 2 and 3 with 13 and 18 electoral votes, respectively. At this point, one cycle is complete, and the cycle is performed again for the chosen number of Turns that is, 4 more for this game. Electoral points will vary with the normal back and forth of the game and strategies employed.
3.3 Assessing Student Performance
There are multiple ways that student performance in the course is assessed in addition to the candidate rankings at the end of the game. In past sections, students have presented their “story” of how the game played out for their team and the analytic techniques they used to play it. These provide additional visibility into the techniques employed by the individuals and teams and represents another metric that can be used for grading. Students learn that being able to communicate their analytic approaches and results are a key element of analytics knowledge. Third, the Professor has access to a Total Effectiveness index for each team that “collapses all quantitative performance indicators into a single number comparable across islands, course sections and campaign modes” (MISSimulation.com, 2021). These include precision of targeting, Electoral Votes, Popular Votes, and budget management.
3.4 Incorporating Inferential Statistics
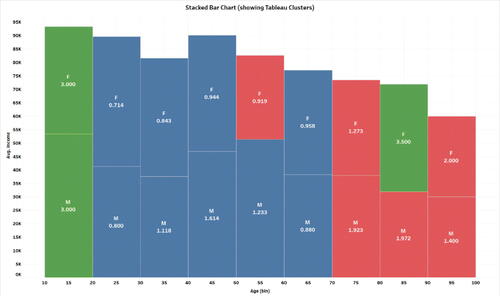
In the Advanced level of the simulation, inferential statistics for example, sampling distributions, confidence intervals, hypothesis tests, cluster analysis, and regression can all be incorporated into game play. The Basic level of the game was used in this article solely to streamline the narrative. So, for example, the candidate can initiate a new survey at any time in the Advanced Level game. Teams can also display the frequency distribution of voters across different age and income groups that potentially informs how campaign dollars are allocated. They can also develop regression functions to optimize campaign spend across various areas. In , an example cluster analysis (from another game) helped to identify the most productive clusters of target voters by gender, income, age, and interest level in one issue (childcare). In this case, the darker clusters are the most beneficial, with 18–20-year-olds earning incomes under $50,000 being the most attractive.
Fig. 9 Using a stacked bar chart for the simulation.
4 Discussion and Conclusions
This article has described an election simulation that forms the basis of a teaching module within a data analytics class. Based on competing teams, where the opponent could be either another team or the computer, MISSimulation.com from NorthernByte provides a curated data-rich environment where all students have the same measurement metric for success. This means that they receive the same amount of resources and face off against each other, with superior demonstrated analytical skills leading to group victory.
The student teams can use one or a mix of their preferred tool(s) for analytics for example, SAS, Tableau, Python, and/or Excel. At our institution, the election simulation is preceded by a survey of key concepts of data analytics and 4 weeks of instruction in Tableau to familiarize students with its capabilities. However, teams still have the option to use other tools if they choose.
While the solution method documented here involved segmentation of the electorate by issue interest, other approaches to decision making are possible. Segmentation by gender, location, marital status and size of households may also be used within developed models.
The simulation itself can be played over multiple days, or over a quarter or semester. In our format, we have a Turn taken every 4 days. With 5 Turns, the game is completed in 20 days (with a few days practice included) or just under 3 weeks. We have found students are engaged and excited at the prospect of competing against each other. The simulation provides an excellent platform—using realistic, voluminous, and fine-grained data—to actively learn descriptive, predictive, and prescriptive analytics.
Incorporating the simulation into the data analytics course provides extensive activity in the final three stages of Bloom’s Revised Taxonomy (Krathwohl and Anderson Citation2010), namely Analyze, Evaluate, and Create. The Analyze stage is a critical part of the election simulation. Options (e.g., Areas, Issues, Budgets) are appraised and compared as well as possible actions that may be taken by competitors. The Evaluate stage is also replete with activities including testing and experimenting with different alternative actions and reviewing their impacts. Finally, when building and finalizing their complete election campaign for a Turn, they are working within the Create component of Bloom’s extended taxonomy.
MISSimulation.com has been very well received by our students. Students have reported finding it easy to learn analytics concepts due to the stimulating and competitive campaign simulation. The only negative feedback received has stemmed from (rare) team dysfunction, issues found in other classes and not specific to the simulation. We have used it initially at the graduate level in analytics and DSS courses, with great success. We plan to extend its use to undergraduate classes. As the simulation represents a discrete course element that is not tested on final exams, those exams were not a useful direct metric to assess its efficacy. We have received positive feedback about the simulation and the class in general from students and other professors in follow-up courses. In subsequent data science projects, students appear to have benefited specifically from the experiential learning with realistic data. Some examples of student feedback follow below:
“I got more out of this class than out of any other online class I’ve ever taken.”
“This has been my favorite class so far. Great blend of interesting online tools, group work (which was made easier by the professor making sure there was equal participation), lectures and hands-on learning.”
“I love this class. The Tableau tool we are using has been taught so well compared to (another tool-based) class last winter.”
“I wish there were more courses for MBA students who wish to acquire analytics concentration for strategic use in their fields.”
“Class is very interactive, which is good. Simulation is very good tool for applying concepts. I am sure what I am learning in this class will be used extensively in my day-to-day work.”
Two faculty members from other universities using MISSimulation (and personally unknown to the author) also made their feedback available to the researcher via NorthernByte, as follows:
“The simulation was valuable for student engagement. It provided students with data and a context with which to practice skills in working with various software packages (Microsoft Excel and Tableau) and to hone their data analytics skills. The team aspect also allowed them to build their skills in working with others on a common project.”
“The MIS Simulation has become one of the favorite aspects of my course. It allows students the opportunity for hands-on, real-world experience in data analysis. They are able to understand the relationship between making data-driven decisions and success. A year or so ago, I ran into a former student at a store. He shared with me that the simulation was his favorite part of the course and that it actually helped him get a job when he graduated. As a professor, I couldn’t ask for better feedback than that.”
The pedagogical aspects of gaming and fun are addressed by the work of Bulmer and Haladyn (Citation2011), Lesser et al. (Citation2013) and Kuiper and Sturdivant (Citation2015). Lesser et al. (Citation2013) highlight fun as a helpful aid to student learning, noting that, “students often complain about hard homework, but these same students enjoy playing games that are challenging.” They thus view games, such as the one discussed here, as a means of stimulating student learning and enjoyment of the learning process.
Kuiper and Sturdivant (Citation2015) specifically view online games as providing a pathway to enhanced learning, like outlined in this article. Our simulation also resembles the fascinating online island simulation described in Bulmer and Haladyn (Citation2011). In their rich simulation, students can survey multiple issues among a simulated population on an island and pursue various hypotheses. MISSimulation is more constrained however, toward competing directly against other teams to win an election, in marked contrast to independent hypotheses pursued on the simulated island in Bulmer and Haladyn (Citation2011). In our experience with multiple pedagogies, direct competition is typically more engaging than independent work.
Is the use of the election simulation superior to consulting with an actual organization and its data? The students quoted above would likely say: “yes.” If multiple company projects are worked on by one class in one semester, then the instructor runs the risk of varying levels of difficulty among projects. Another issue might be variable quality of projects from semester to semester. A third drawback is that if a large class works on one company’s project and data, then you invariably have many students who do little, as there are typically too many individuals for the available work. The election simulation is more ideal because it allows for as many students as you have to work on a rich dataset with high quality data, allowing uncertainty to be modeled. You can also limit team size (typically to 3 or 4) so that all members must participate substantively. Last, the competitive setting is more appealing, dynamic and fun for students, with the added ability to receive rapid feedback from their decisions.
Higher-level functionality in MISSimulation.com will allow for future evolution of this course. The game was illustrated here at the Basic Level, but Intermediate and Advanced Levels are also available. In the Advanced Level of the game, much new functionality is available. Candidates can (a) practice negative campaigning (b) solicit corporate and residential contributions, which can increase their budgets (c) conduct their own surveys and (d) campaign via a microblogging platform. The net effect of these features is to allow for more stochastic elements; build greater complexity via additional variables into the game; and enable interactions on issues of ethics via the ability to campaign negatively. With these added features, more sophisticated analytic methods may be successfully introduced, contributing further to student learning.
Future research should explore the learning experience with the more advanced functionality in the simulation game and with pre- and post- course questions that specifically address data science knowledge and concepts acquired during the course.
Disclosure Statement
The author has no relationship with the publisher of MISSimulation.com other than as a user of the software in classes.
References
- Breiman, L. (2001), “Statistical Modeling: The Two Cultures,” Statistical Science, 16, 199–215. http://www.jstor.org/stable/2676681.
- Brynjolfsson, E., Hitt, L. M., and Kim, H. H. (2011), “Strength in Numbers: How Does Data-Driven Decision making Affect Firm Performance?,” April 22. DOI: 10.2139/ssrn.1819486.
- Bulmer, M., and Haladyn, J. (2011), “Life on an Island: A Simulated Population to Support Student Projects in Statistics,” Technology Innovations in Statistics Education, 5, 1–21. DOI: 10.5070/T551000187.
- College Transitions (2022), Available at https://www.collegetransitions.com/dataverse/top-colleges-data-science.
- Data Science Programs (2022), Available at https://www.datascienceprograms.org/.
- Giacomello, G., and Preka, O. (2020), “The “Social” Side of Big Data: Teaching BD Analytics to Political Science Students,” Big Data and Cognitive Computing, 4, 13. DOI: 10.3390/bdcc4020013.
- Goh, T. T., and Sun, P. (2015), “Teaching Social Media Analytics: An Assessment Based on Natural Disaster Postings,” Journal of Information Systems Education, 26, 27–36. Available at http://jise.org/Volume 26/n1/JISEv26n1p27.html.
- Hardin, J., Hoerl, R., Horton, N. J., Nolan, D., Baumer, B., Hall-Holt, O., Murrell, P., Peng, R., Roback, P., Lang, D. T., and Ward, M. D. (2015), “Data Science in Statistics Curricula: Preparing Students to ‘Think with Data,’” The American Statistician, 69, 343–353. DOI: 10.1080/00031305.2015.1077729.
- Huang, C.-K., Wang, T., and Huang, T.-Y. (2020), “Initial Evidence on the Impact of Big Data Implementation on Firm Performance,” Information Systems Frontiers, 22, 475–487. DOI: 10.1007/s10796-018-9872-5.
- Hyunjoo, O., and Polidan, M. (2018), “Retail Consulting Class: Experiential Learning Platform to Develop Future Retail Talents,” Journal of Marketing Education, 40, 31–46. DOI: 10.1177/0273475317743015.
- Jaggia, S., Kelly, A., Lertwachara, K., and Chen, L. (2020), “Applying the CRISP-DM Framework for Teaching Business Analytics,” Decision Sciences Journal of Innovative Education, 18, 612–634. DOI: 10.1111/dsji.12222.
- Jeyaraj, A. (2019), “Teaching Tip: Pedagogy for Business Analytics Courses,” Journal of Information Systems Education, 30, 67–83. Available at https://jise.org/Volume30/n2/JISEv30n2p67.html.
- Keeton, M. T., and Tate, P. J. (1978), “The Boom in Experiential Learning,” in Learning by Experience: What, Why, How, eds. M. T. Keeton and P. J. Tate, pp. 1–8, San Francisco, CA: Jossey-Bass.
- Krathwohl, D. R., and Anderson, L. W. (2010), “Merlin C. Wittrock and the Revision of Bloom’s Taxonomy,” Educational Psychologist, 45, 64–65. DOI: 10.1080/00461520903433562.
- Kuiper, S., and Sturdivant, R. X. (2015), “Using Online Game-Based Simulations to Strengthen Students’ Understanding of Practical Statistical Issues in Real-World Data Analysis,” The American Statistician, 69, 354–361. DOI: 10.1080/00031305.2015.1075421.
- Lesser, L. M., Wall, A. A., Carver, R. H., Pearl, D. K., Martin, N., Kuiper, S., Posner, M. A., Erickson, P., Liao, S.-M., Albert, J., and Weber, J. J. (2013), “Using Fun in the Statistics Classroom: An Exploratory Study of College Instructors’ Hesitations and Motivations,” Journal of Statistics Education, 21. DOI: 10.1080/10691898.2013.11889659.
- Lim, J.-S., and Heinrichs, J. H. (2021), “Developing Context-Relevant Project Experiences for Marketing Analytics Students,” Decision Sciences Journal of Innovative Education 19, 150–156. DOI: 10.1111/dsji.12234.
- National Academies of Sciences, Engineering and Medicine Consensus Report (2018), “Data Science for Undergraduates: Opportunities and Options,” Available at https://nas.edu/envisioningds.
- Renz, A., and Hilbig, R. (2020), “Prerequisites for Artificial Intelligence in Further Education: Identification of Drivers, Barriers, and Business Models of Educational Technology Companies,” International Journal of Educational Technology in Higher Education, 17, 1–21. DOI: 10.1186/s41239-020-00193-3.
- Saltz, J., Armour, F., and Sharda, R. (2018), “Data Science Roles and the Types of Data Science Programs,” Communications of the Association for Information Systems, 43, 615–624. DOI: 10.17705/1CAIS.04333.
- Speier-Pero, C., and Schoenherr, T. (2020), “Creating Impactful Student Learning in a Business Analytics Program through Leveraging Scholar-Practitioner Engagement,” Decision Sciences Journal of Innovative Education, 18, 59–89. DOI: 10.1111/dsji.12198.
- Stanton, W., and Stanton, A. (2020), “Helping Business Students Acquire the Skills Needed for a Career in Analytics: A Comprehensive Industry Assessment of Entry-Level Requirements,” Decision Sciences Journal of Innovative Education, 18, 138–165. DOI: 10.1111/dsji.12199.
- Statista (2021), “Revenue from Big Data and Business Analytics Worldwide from 2015 to 2022,” Available at https://www.statista.com/statistics/551501/worldwide-big-data-business-analytics-revenue/.
- US News and World Reports (2021a), “Best Business Analytics MBA Programs, Available at https://www.usnews.com/best-graduate-schools/top-business-schools/business-analytics-rankings.
- US News and World Reports (2021b), “Best Undergraduate Data Science Programs,” Available at https://www.usnews.com/best-colleges/rankings/computer-science/data-analytics-science.
- Wang, S., and Wang, H. (2019), “A Teaching Module of Database-Centric Online Analytical Process for MBA Business Analytics Programs,” Journal of Information Systems Education, 30, 19–26. Available at http://jise.org/Volume30/n1/JISEv30n1p19.html.
- Weirich, T. R., Tschakert, N., and Kozlowski, S. (2017), “Teaching Data Analytics using ACL,” Journal of Emerging Technologies in Accounting, 14, 83–89. DOI: 10.2308/jeta-51895.
- Williams, B., and Elmore, R. (2021), “Teaching Business Analytics during the COVID-19 Pandemic: A Tale of Two Courses,” Communications of the Association for Information Systems, 48, 32–39. DOI: 10.17705/1cais.04805.
- Yan, D., and Davis, G. E. (2019), “A First Course in Data Science,” Journal of Statistics Education, 27, 99–109. 1623136. DOI: 10.1080/10691898.2019.
- Yazici, H. (2020), “Project-Based Learning for Teaching Business Analytics in the Undergraduate Curriculum,” Decision Sciences Journal of Innovative Education, 18, 589–611. DOI: 10.1111/dsji.12219.