Abstract
According to decades of research in educational psychology, learning is a social process that is enhanced when it happens in contexts that are familiar and relevant. But because of the skyrocketing popularity of data science, today we often work with students coming from an abundance of academic concentrations, professional, and personal backgrounds. How can our teaching account for the existing multiplicity of interests and be inclusive of diverse cultural, socioeconomic, and professional backgrounds? Music is a convenient medium that can engage and include. Enter Playmeans, a novel web application (“app”) that enables students to perform unsupervised learning while exploring music. The flexible user interface lets a student select their favorite artist and acquire, in real time, the corresponding discography in a matter of seconds. The student then interacts with the acquired data by means of visualizing, clustering, and, most importantly, listening to music—all of which are happening within the novel Playmeans app. Supplementary materials for this article are available online.
1 Introduction
Data science, which might recently be viewed by some as a subarea of statistics, as a branch of computer science, or even as a transitional buzzword, has convincingly established its roots as a scientific discipline. And, as could be expected, the job market’s growing demand for data scientists is resulting in the popularity of data science in schools of higher education. Data science programs of many shapes and forms have been launched at a number of institutions, in both undergraduate and graduate programs, in recent years. As of this writing, a popular blog on data science maintained by Ryan Swanstrom reports 632 data science programs, of which 58 are bachelor’s programs, as listed on https://ryanswanstrom.com.
This growth in the popularity of data science, both in the marketplace and in institutions of higher education, has further mixed the already diverse student audience that statistics educators have been facing. Not surprisingly, diversity of student background and lack of preparation have been listed among the top challenges for data science instructors (Schwab-McCoy, Baker, and Gasper Citation2021). According to Rawlings-Goss et al. (Citation2018, p. 31) there is a need for “a more student-centered approach toward building curriculum which is engaging, accessible, and culturally relevant.” One of the key recommendations of a recent survey conducted by the National Academies of Sciences, Engineering, and Medicine (NASEM) is for data science programs to “focus on attracting students with varied backgrounds and degrees of preparation and preparing them for success in a variety of careers” (National Academies of Sciences, Engineering, and Medicine Citation2018, p. 64). At the same time, the survey stresses that “This need to prepare diverse students for various careers further increases the educational challenge” (National Academies of Sciences, Engineering, and Medicine Citation2018, p. 2).
When students from various walks of life are finding interest in data science, we as educators have an elevated responsibility to deliver content that appeals to and engages students in spite and because of such diversity. In a class filled with students from diverse cultural, socioeconomic, and professional backgrounds, finding practical applications is not sufficient. Those applications should, in addition, speak to all parties involved. Put differently, our teaching has to be not only engaging but also culturally, socioeconomically, and professionally inclusive.
But how can we achieve the above mentioned inclusiveness when the students are from so many walks of life? It already takes careful design and planning to accommodate the interests, motivations, and aspirations of students of relatively less diverse (professional) backgrounds. For example, in the author’s experience, tapping into the professional interests of students concentrating in accounting, finance, and marketing can already be demanding when such students are in the same class, although the noted subjects all fall under the same umbrella of “business” disciplines. Accommodating students coming from a wider spectrum of professional backgrounds—say, from such disciplines as humanities, arts, and social sciences in addition to the STEM fields—requires an even more judicious educational design and planning. Other aspects of diversity, such as of cultural and socioeconomic backgrounds, add yet another layer of complexity to the pedagogical challenge.
In this article, we propose that a convenient application area that can engage learners coming from diverse cultural, socioeconomic, and professional backgrounds—is music. We demonstrate the use of a novel web app built using the “shiny” package of R programming language, explain its relevance for students from rich cultural and professional backgrounds, and discuss some of its uses. The rest of this article is organized as follows: In the next section we discuss music as a medium to motivate students. In Section 3 we review the use of interactive apps for teaching statistics. Section 4 introduces the novel Playmeans web app (https://playfuldatascience.shinyapps.io/playmeans/), and Section 5 discusses its uses. The article is summarized and concluded in Section 6.
2 Active Learning through Music
Evidence of music exists throughout all of recorded history and across cultures (Miller Citation2000). According to Charles Darwin in The Descent of Man, and Selection in Relation to Sex, “As neither the enjoyment nor the capacity of producing musical notes are faculties of the least use to man in reference to his daily habits of life, they must be ranked amongst the most mysterious with which he is endowed” (Darwin Citation1889, pp. 569–570). There is evidence that the beginnings of music stretch back into the Upper Paleolithic (Kunej and Turk Citation2000) as shown by, among other artifacts, the discovered prehistoric variants of bone flutes found in the caves of Geissenklösterle in Germany, Isturitz in France, and other locations (Buisson Citation1990; Hahn and Münzel Citation1995; Kunej and Turk Citation2000). The ubiquity of “early” music is evidenced by its use among “stakeholders” as diverse as Plato’s Academy (Freeman Citation2000), the Catholic Church, Australian Aborigines, and Kalahari Bushmen (Dissanayake Citation2000).
Although various animals, including birds and whales, have a capacity to “sing,” they do not have the “richness of compassion and understanding” that we experience as humans (Freeman Citation2000, p. 412). Relatedly, music is particular to humans, as no other species has “either the capacity for shared rhythms or the semantics of music as it appears in humans” (Freeman Citation2000, pp. 411–412). In spite of the various cultural differences in music rituals, the appreciation is invariant of cultures, can develop without formal musical training, and has even been argued to be present before linguistic skills are developed (Leng and Shaw Citation1991; Trehub Citation2003; Sridharan et al. Citation2007). Some of infants’ first exposures to music are lullabies or other tunes that mothers sing for them (Fernald Citation1991). Such a form of music has been argued to constitute almost a separate “genre” common throughout cultures with features such as “simple pitch contours, repetition and narrow pitch range” (Trehub Citation2003, p. 671). The extent to which infants can perceive music has been shown to be comparable to those with years of informal exposure to music, giving evidence to conjecture that “the rudiments of music listening are gifts of nature rather than products of culture” (Trehub Citation2003, p. 670). It has been argued that certain attributes can be considered universal across various types of music and are likely tied to “biological factors controlling musical production and perception” (Brown and Jordania Citation2013, p. 236). Such universals include attributes such as unison choral singing in octaves, organization of music into phrases, and musical scales (Brown and Jordania Citation2013).
Music has been used to engage students of statistics through activities such as listening to statistical music and watching of statistical music videos (Zagerman Citation2018; Lawton and Taylor Citation2020). Another example of incorporating music in statistics education is through the engagement of students in providing inputs to questions (e.g., multiple choice) and then playing back songs with the student inputs incorporated (Lesser et al. Citation2019). Another pedagogical, engaging music-related activity relates to the Guitar Hero video game series—with students first playing the game and then analyzing performance statistics resulting from the game (Ramler and Chapman Citation2011). Our work with Playmeans adds on top of the existing interactive pedagogical tools aimed at engaging and including diverse student populations.
When it comes to engaging students with diverse cultural, socioeconomic, and professional interests, music has an important advantage worthy of emphasis in this work. In particular, one is inherently a “subject-matter expert” in their favorite music, in the sense that they are closely familiar with the sound and style of that music and have developed their unique “feel” when listening to it. Very importantly, such close familiarity with favorite music is invariant of students’ cultural, socioeconomic, and professional backgrounds. Consequently, introducing data science concepts—or any concepts, for that matter—in the context that the learner is closely familiar with can overcome the difficulties associated with the lack of knowledge of the otherwise unfamiliar subject matter. It is one’s close familiarity with their favorite music or, as noted by Gould (Citation2010, p. 299) in general, the “direct, first-hand experience with data” that makes music an advantageous medium for engagement and inclusion.
If music provides the medium or the subject matter for learning regardless of cultural, socioeconomic, and professional backgrounds, engaging with that medium meanwhile makes the process of learning lively and interactive. An important pillar in the constructivist theory of learning and development is that learning is constructed or “made” when, as a result of exploration and discovery, new information is experienced and connected to existing knowledge (Resnick Citation1989; Brooks and Brooks Citation1999; Alesandrini and Larson Citation2002; Richardson Citation2003). As a result of such a learning process, “meaning is constructed and reconstructed based on the previous experiences of the learner” (Alesandrini and Larson Citation2002, p. 118). But the internal construction of knowledge is not the only pillar of constructivist theory. Another important aspect of constructivist theory is that a learner is actively constructing the knowledge internally rather than passively receiving the already existing knowledge delivered externally (Phillips Citation1995). It is important to note that in classrooms that adopt the constructivist learning approach, students learn while working on an application, as they “explore various solutions and learn through discovery” (Alesandrini and Larson Citation2002, p. 118). As will become clear later in the article, our proposed interactive web app is inherently “constructivist.” Indeed, as will be demonstrated, because the app enables a student to analyze their favorite musician’s or band’s discography, they can connect new information (i.e., the results of the analysis) to the “expert” knowledge they already have related to their favorite music. In addition, students engage with the app actively, because the app is interactive and allows them to not only visually analyze data but also listen to the tracks directly within the app.
That the active and experiential learning benefits the instruction of quantitative material has been shown through a number of published studies. In their comprehensive meta-analysis of studies assessing active learning approaches, Freeman et al. (Citation2014) reviewed 225 studies comparing active learning and traditional lecture-based instruction in undergraduate science, technology, engineering, and mathematics (STEM) courses. Authors demonstrate that across the meta-analyzed studies there is evidence that active learning is beneficial for improving both examination scores and failure rates. Kvam (Citation2000) studied retention rates, comparing active, group-project-based learning with a control group in an introductory engineering statistics course. The author found that the retention of information is higher for students who engaged in group-work than for those who did not, and such improved retention was observed both in the short term (at the end of the course) and in the long term (eight months later). Similarly, Hakeem (Citation2001), studying the benefits of experiential learning, found evidence that students who engaged in a semester-long project involving data collection, analysis, and reporting performed better than those who didn’t, in a business statistics course. One vehicle for active and often game-like learning is the interactive web app discussed in the following section.
3 Interactive Web Applications for Statistics Education
A major pedagogical innovation that has become popular over the last two decades is the use of interactive web apps for teaching various statistical concepts. Some examples are the Rossman/Chance Applet Collection (http://www.rossmanchance.com/applets/), Statistics Online Computational Resource (http://www.SOCR.ucla.edu), and the probability and statistics tools of the Interactive interface as part of the Shodor Education Foundation (http://www.shodor.org/interactivate/), to name a few.
A relatively more recent technological innovation in statistics education is the use of R Shiny web apps (Chang et al. Citation2017). “shiny” is an R package that enables the R user to build interactive web applications directly in R. Those “responsive” applications can then be deployed on the cloud. Readers unacquainted with the package can get an introductory understanding by visiting the “Gallery” for some illustrative use cases (https://shiny.rstudio.com/gallery/), where they can both view fully functioning R Shiny applications (“Shiny User Showcase”) and familiarize themselves with different widgets, layouts, and other features of the package (“Shiny Demos”).
Since its inception R Shiny has become a popular tool for building web apps, including applications for statistics education. There have been numerous apps ranging from ones designed to tackle relatively introductory probabilistic or statistical concepts such as random variables and statistical distributions or correlation and regression (Doi et al. Citation2016) to ones that are intended for heavier duties such as clustering and classification and regression trees (Nijs Citation2021). Among the many advantages of incorporating R Shiny into teaching statistics are the interactive point-and-click features, the public access through the World Wide Web, and the visual appeal (Doi et al. Citation2016). A noteworthy convenience for instructors to consider incorporating R Shiny into statistics pedagogy is the fact that one will not need to invest time and effort in learning a completely new programming language to create the intended application. Indeed, because R Shiny is an R package, one can noticeably leverage their existing knowledge and experience of R coding to build R Shiny apps.
4 The Playmeans App
The Playmeans app (https://playfuldatascience.shinyapps.io/playmeans/) was designed at Babson College during the spring semester of 2020. Its main technical development began during that semester and was finalized in the fall of 2021. The app is written using R Shiny. In a nutshell Playmeans is an interactive web interface that performs exploratory data analysis through histograms and K-means (MacQueen Citation1967) clustering. The app enables the user to indicate their musician/band of interest and acquire data from Spotify data repositories. The data are acquired in real time using the “spotifyr” package (Thompson et al. Citation2019) that serves as an R “wrapper” for the public Spotify Application Programming Interface (API). The music of any musician or band (which will be referred to as “artist” from now on) that is presented in Spotify can be acquired and analyzed using Playmeans. The acquisition of data is as simple as typing in the exact name of the artist and requesting their music through a search bar. The names and descriptions of the variables that are displayed throughout the Playmeans app (acquired through Spotify public API) are presented in . Note that the descriptions of audio features are borrowed from the Spotify Web API reference guide (https://developer.spotify.com/documentation/web-api/reference//#/operations/get-several-audio-features).
Table 1 Data dictionary describing the variables displayed throughout the Playmeans app (acquired from Spotify public API).
4.1 Setup before Using the App
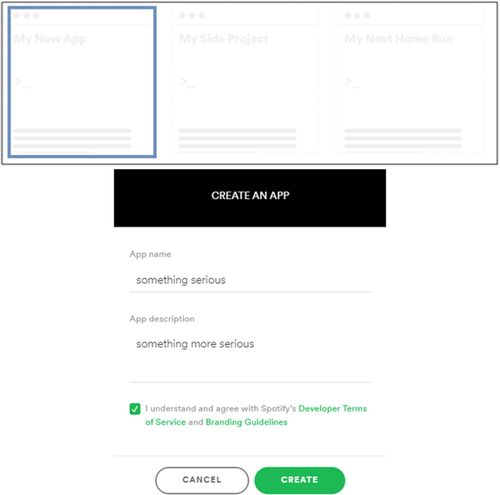
To log in to the app, students need to obtain unique login credentials from Spotify. In particular, they need to create a developer (aka a “Dev”) account with Spotify for the purposes of using the Web API. Then, students need to obtain two codes: (a) Client ID and (b) Client Secret. Detailed guidelines on how to do this are outlined by the author in instructions that can be found through the following link: https://bit.ly/3SADCwj (also available as part of the supplementary materials for this article). Note that it is assumed that at the time of creating the “Dev” account, students will already have a Spotify account. If that is not the case, students need to first create a Spotify account (through the link above), and only then set up their “Dev” account. Once a “Dev” account is created, students are asked to review and accept the terms under the Spotify Developer Terms of Service. Next, students need to hover the mouse over “My New App” (see the blue box in the top section of ), click on “Create an App” (that will show up upon hover) and fill in the required information as in (the app name and description below are for illustrative purposes).
Fig. 1 Setting up the Spotify “Dev” account.
Students will then be presented with the screen below, where they can see the Client ID. When they click on “SHOW CLIENT SECRET,” Spotify will display the Client Secret for their reference (). Students should save/write the Client ID and Client Secret somewhere handy so they can easily access them every time they need to log in to the Playmeans app. After successfully obtaining the Client ID and Client Secret, students will be ready to log in to the app ().
Fig. 2 Obtaining Client ID and Client Secret upon creating the Spotify “Dev” account. The ID and secret in this image are arbitrary and are for illustrative purposes only.
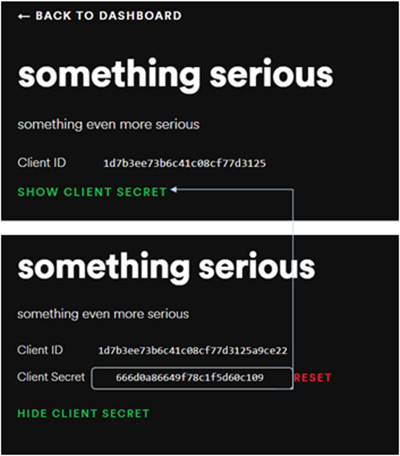
Fig. 3 Logging in to Playmeans.
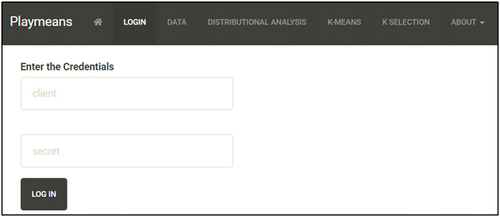
The app is organized into tabs. Students will need to enter the credentials obtained via Client ID and Client Secret using the Login tab. What follows below is a brief description of the main tabs of the app, after a student successfully logs in.
4.2 Data Tab
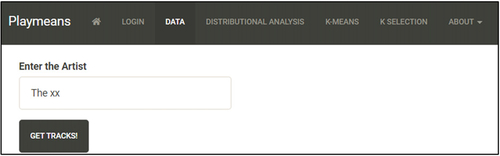
In this tab students enter the name of the artist they are interested in analyzing. In the illustrative image in , as an example, the English independent pop music band “The xx” is searched. It is important to note that although the search is not case sensitive, the name of the artist should be entered precisely, since Playmeans will not auto-correct or suggest alternative spellings of the artist in case the name is entered incorrectly. After entering the name, students should click “Get Tracks!” It is worth mentioning that here and throughout the rest of the app, action buttons should be clicked rather than activated using an Enter button on the keyboard.
Fig. 4 Searching for an artist.
Once the data are pulled from Spotify data repositories (in real time), the data will be populated in the same tab (). When the data are loaded, students are encouraged to start interacting with the data. In particular they should familiarize themselves with the data by hovering over the column names to learn their definitions or sorting the data as desired by clicking on the arrows next to column names. Students may also search the dataset to identify individual tracks and the associated numeric features. The purpose of this stage is to get comfortable with the structure of the data and the definition of the various fields. Note that students can download the data through the “Download” button that appears on the bottom left of the table ().
Fig. 5 Data loaded after being pulled from Spotify data repositories in real time. Hovering over the column names displays their definitions.
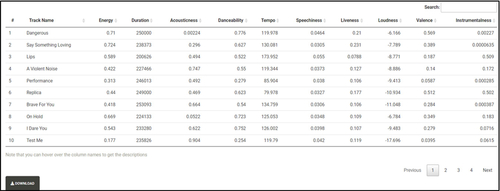
It is worth noting that before the data are displayed to the user, the following pre-processing takes place immediately after the data are pulled from the Spotify data repositories. First, albums appearing in alternative versions in addition to their most original or “base” version, including but not limited to alternative versions such as “deluxe,” “remastered,” “anniversary,” “enhanced,” “live,” etc., are identified, and only the “base” format of the album is retained, unless an album appears only in alternative versions (e.g., “remastered”) in which case the alternative versions are retained. Second, the same pre-processing applies to individual tracks. Finally, identification and removal of approximate duplicates in track names is performed using fuzzy matching with Levenshtein distance (Levenshtein Citation1966).
Another note that should be made here relates to the single-threaded nature of R and its implications for concurrent usage of the same R Shiny app. In particular, based on documentation provided by RStudio: “R is a single threaded application which means that a Shiny application cannot serve two different users at precisely the same time. This is not an issue in most cases because most computations only take tens or hundreds of milliseconds. As a result, a single R process can usually serve 5–30 requests/second.” (https://shiny.rstudio.com/articles/scaling-and-tuning.html) In our experience when testing Playmeans, we found that when artists are being searched within a second or two of each other by users numbering ten or more, the individual wait times within the Data tabs may be somewhat longer (nearing a minute in some cases). While in practice, in small classrooms students are unlikely to all be searching for artists at almost exactly the same time—instructors should be aware of this nuance especially when designing in-class activities.
4.3 Distributional Analysis Tab
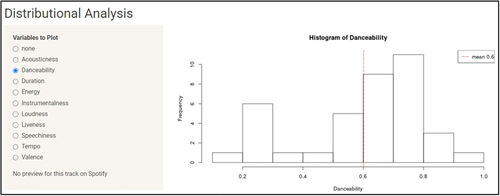
In this tab students are encouraged to gain further, deeper understanding of the structure of the data by exploring the distribution of the data by selecting the corresponding variable using the radio buttons from the left panel (e.g., “Danceability” in ). Importantly, they get to interact with the data by hovering the mouse over the histogram and clicking anywhere within the vertical bars. Such clicking plays a free, 30-second preview of the track that falls in the corresponding bin, assuming a preview is available from Spotify. This audiovisual interaction with the data is an excellent opportunity for students to confirm or validate through auditory means what they can learn by just looking at the histogram.
Fig. 6 Histograms of the various data fields are displayed upon selecting the radio buttons in the left panel. Hovering the mouse over each histogram and clicking anywhere within the vertical bars plays a free, 30-second preview of the track falling into the corresponding bin (unless a preview is unavailable from Spotify).
4.4 K-Means Tab
In this tab students cluster the data, using K-means clustering, along the 10 music-related fields that appeared in earlier tabs. To initiate clustering, students need to select the number of clusters (“k”) using the slider from the left panel and then click “Run K-Means.” To start clustering, students may select a value for “k” that best aligns with their knowledge of the selected artist’s musical repertoire. Put differently, a student’s first guess regarding the value of “k” may be based on their intuition as to how many different groups, broadly speaking, the artist’s tracks may fall into. Once the clustering takes place, two plots will appear in the tab: an Interactive Profile plot () and a Static Profile plot (). It is worth noting that before clustering, the data are standardized by subtracting from each variable its mean and dividing over its standard deviation. The clustering is performed using the “kmeans” function in R, based on the algorithm of Hartigan and Wong (Citation1979). Further, as part of the R implementation, 25 random sets of centroids (for the “nstart” attribute) are drawn, and the final results that get displayed are based on the best-performing configuration of centroids, that is, the configuration that for the selected value of (“k”) renders the smallest within-cluster variability.
Fig. 7 Interactive profile plot (a) with audio and Static Profile plot (b) without audio. The value of “k” is set using the slider within the tab. In both plots the horizontal axis corresponds to the variables that were used in clustering, and the vertical axis designates the cluster number. In plot (a) the sizes of “emojis” and in (b) the colors are based on the magnitudes of the centroids. In plot (a) hovering over the plot and clicking plays a free, 30-second preview of a track randomly selected from a cluster that was clicked (if a preview is available from Spotify).
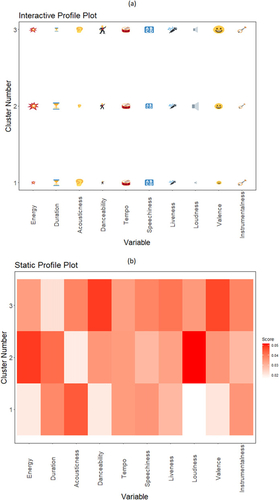
The Interactive Profile plot has as many rows as the number of clusters selected by the student (“k”), which is 3 in the illustrative image in . In that image, the numbers on the vertical axis correspond to the cluster number. Displayed on the horizontal axis of the plot are the 10 unique variables along which the clustering was performed. Note that in the Interactive Profile plot there is an icon (“emoji”) that corresponds to each variable found on the horizontal axis and that is displayed in the column corresponding to the variable. The size of each emoji is in based on the value of the centroid. Put differently, a large emoji for a given cluster (i.e., in a given row of the plot) indicates that the mean of the corresponding variable is larger for that cluster. As an example, when comparing average “Energy” of the tracks across the three clusters in , we can notice that the size of the emoji corresponding to energy for the second cluster (i.e., the middle line) is noticeably bigger than that of other two clusters. That indicates that the average energy level of tracks in the second cluster is higher than that of the other clusters (after standardization). It can also be noticed that despite relatively high average energy of tracks in that second cluster, the “Acousticness” of the tracks is noticeably smaller on average compared with the other clusters (after standardization).
When working on this tab, students get an opportunity to learn about the different clusters of tracks that represent their artist of interest. In particular, through the Interactive Profile plot students get to perceive that information visually, through an engaging plot involving lively “emojis” that correspond to otherwise technical variables. In addition, and as importantly as for the previous tab, students get an opportunity to physically interact with the output of K-means by hovering over the plot and clicking to listen to a free, 30-second preview of a track randomly drawn from the cluster (i.e., row) that was clicked. That way students confirm and validate whether what they visually perceive from the plot aligns with what they hear. Students should be encouraged to compare and contrast the various clusters according to the information provided on and see how the clusters resulting from the implementation of K-means fare against each other. Students are encouraged to repeat this clustering-seeing-listening process a few more times by selecting different values for “k” using the slider on the left panel and clicking “Run K-Means.” For students’ convenience, the tab also provides the Static Profile plot () which is a heatmap, equivalent to but with no interactivity/audio. Students should feel free to compare and contrast various musical attributes within a cluster and across clusters using the Static Plot in conjunction with the Interactive Plot ().
4.5 K Selection Tab
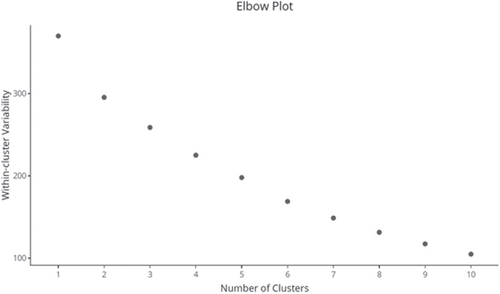
The purpose of this tab is to display, using an elbow plot () the drop in within-cluster sums of squares corresponding to various values of “k.” The tab gets populated when selected, assuming the previous tab (“K-Means”) has been used at least once for the artist in question—in other words, given K-means has been run at least once. Hovering over the plot displays the corresponding values of “k” and the within-cluster sums of squares. This “elbow” plot can be used to visually approximate a suitable number of clusters that one may ultimately select for K-means clustering.
Fig. 8 Elbow plot after performing K-means clustering with values of “k” ranging from 1 to 10. The horizontal and vertical axes correspond to the value of “k” and the within-cluster sums of squares, respectively.
4.6 About Tab
For questions or comments, as well as for a brief but informative user guide, users may consult the About tab. The user guide contains instructions on how to obtain the required credentials from Spotify to be able to access the app. In addition, the user guide outlines the features of each tab in the app.
5 Discussion
The unique value added to statistics instruction by Playmeans is based on the fact that through Playmeans, users can get custom music data on their artists of interest and analyze that data in a playful manner. These value propositions are worthy of some further elaboration. First, Playmeans does not impose a single (or a handful) of datasets to be analyzed. Instead, users have the complete freedom to specify the artist they are most interested in analyzing, and acquire their data as a result. As mentioned earlier, this unique feature carries the promise of engaging a much wider and diverse set of interests than is currently done using many existing instructional technologies. With the widespread proliferation of data science in both undergraduate and graduate programs, this feature carries in itself the promise of making data science not only engaging to a select few—ones whose interests would coincide with the subject matter of a dataset that could otherwise be imposed—but inclusive of everyone who has at least one artist they are interested in. Second, the way students interact with the Playmeans app and analyze the music of their chosen artist is done not only interactively but, importantly, also playfully. This added feature of playfulness comes from the way the interactive web interface has been intentionally designed. Just like it is a design consideration to turn a staircase that is adjacent to an escalator into a “piano” and encourage the commuters to take the “Piano Stairs,” thus, engaging in a physical activity (Peeters et al. Citation2013), Playmeans is an attempt to include and engage audience members through its unique design that promotes audiovisual interaction with data. The design of Playmeans rests on the idea of gamification, which is commonly defined as “the use of game design elements in non-game contexts” (Deterding et al. Citation2011, p. 9) and also, as “using game-based mechanics, esthetics and game thinking to engage people, motivate action, promote learning, and solve problems” (Kapp Citation2012, p. 10). Although Playmeans does not present itself as a game, the added playfulness at its core is in line with the growing gamification that one can find in numerous other apps, including educational apps such as Duolingo and BYJU’s.
As of this writing, no web apps dedicated to statistics education that were reviewed as part of this research had an embedded feature enabling the users to listen to music while performing their statistical analyses. Playmeans solves that problem by including 30-second audio snippets (previews) for tracks included in the data obtained from Spotify during the data acquisition. With the exception of tracks for which Spotify does not provide free previews, the users of Playmeans enjoy music as a matter of a simple click and directly within the app. What this means is that the technical results (e.g., histograms or centroids) displayed by Playmeans may be consumed through not only visual but also auditory means. This feature has the unique potential to enhance engagement with the app. Indeed, the auditory perception of the results of the various analyses can supplement the purely visual learning and thus provide for a richer and more meaningful user experience. The user experience is further enhanced with the inclusion of emojis corresponding to the various musical attributes, such as “danceability” and “instrumentalness” that are part of the data.
As noted earlier, one advantage of enabling students to acquire data about an artist of their choice is that they can then work with information they are knowledgeable about. Being “subject-matter experts” because they are accustomed to the music of the artist in question, students get the unique edge on validating what they see and what they hear from the app, using their prior knowledge. In the author’s view, no other domain gives such an opportunity to students. That being said, students should feel free—even be encouraged—to also use Playmeans to learn about the music of artists that they are not yet familiar with. In other words, Playmeans can be used to not only learn K-means by way of music but also to learn about music itself! In fact, one worthwhile in-class activity to engage students and bond them around music is to assign them to groups and then have each member use Playmeans to cluster the music of an artist whose music they have recently been interested in learning about, and then share the results with the rest of the group. Of course a similar activity can be assigned based on familiar artists.
What are the technical prerequisites necessary to engage with Playmeans? For that we first need to understand where in a curriculum Playmeans might find its home. In the institutions of higher education the app can be introduced either as part of a technically advanced course on statistics/data science/machine learning or in an introductory course on noted subjects. In the former case, the app can be used in conjunction with or on top of a more technical exposition of the K-means algorithm, in which case students would be expected to have an understanding of concepts such as centroids, Euclidean distance, total, within-cluster, and between-cluster variability (sums of squares). In the former case Playmeans can be used for a lively and fun introduction to the general concept of data clustering (and in fact for an introduction to histograms also) without prior knowledge of any advanced statistical concepts.
Note that the features of the app closely tie with the design principles for a high school data science course recently developed by the Charles A. Dana Center at The University of Texas at Austin (Citation2021). Indeed, Playmeans supports many of the principles, especially those related to “coherent and engaging experience for students” as outlined in the Charles A. Dana Center at The University of Texas at Austin (Citation2021) report (p. 8). Some of the Playmeans features supporting the aforementioned principles are the presentation of individualized active learning opportunities through relevant artist-related contexts, connection of data science to everyday experiences and aspirations by drawing on existing knowledge of and intuition about favorite artists, and real and interesting music-related datasets acquired real-time from Spotify. By using Playmeans, teachers can cultivate among students a sense of belonging by presenting “opportunities for students to share their personal backgrounds and interests, including cultural and societal values” and encourage “the connection between what is important in students’ lives and future aspirations, and what they are learning in data science.” (Charles A. Dana Center at The University of Texas at Austin Citation2021, p. 11). In light of the considerations made above, Playmeans may also come handy in an introductory high school course on data science.
The author implemented the app in an introductory course on quantitative methods taught at Babson College in the fall semester of 2021. The course covered introductory probability theory, statistical inference, regression model building, and simulation. Playmeans was introduced toward the end of the course to expose students to a machine learning algorithm (i.e., K-means) but in a way that was nontechnical, engaging, and, above all—inclusive of diverse cultural and professional backgrounds. It was designed around a homework assignment, which students had a week to complete. A version of that assignment can be found through the following link: https://bit.ly/3Md23xp (also available as part of the supplementary materials for this article).
Afterward, upon obtaining approval from Babson College Institutional Review Board, a survey was administered to collect student feedback. In particular, students were asked for their feedback in a form of an anonymous, brief written survey to assess their level of engagement and user experience. The reception of Playmeans was overwhelmingly positive. Students were noticeably enthusiastic about the opportunity to analyze their favorite music and eager to report on their findings. Around 91% of students who completed the assignment agreed or strongly agreed that the activity provided valuable experience working on a quantitative problem using data that they were personally interested in and/or knowledgeable about. Similarly, 91% of students who completed the activity agreed or strongly agreed that the activity provided an opportunity to improve their appreciation of exploratory data analysis. Importantly, around 94% of the respondents reported that compared with other activities and exercises performed throughout the semester, they found the Playmeans activity to be more (or much more) engaging and inclusive. Overall, around 94% of the respondents reported a desire to see similar activities as part of quantitative courses being taught.
6 Epilogue
The growing popularity of data science coupled with diverse backgrounds of students poses a unique challenge for creating an engaging and inclusive learning experience in classrooms. Students are engaged through examples that matter to them and to which they can relate to. Knowledge of or familiarity with the subject matter is of paramount importance as “Grounding data science instruction in substantive contextual examples (which will require the development of judgment and background in those areas) will help ensure that data scientists develop the capacity to pose and answer questions with data” (National Academies of Sciences, Engineering, and Medicine Citation2018, p. 29). But the diversity of backgrounds and interests present in classroom makes it challenging for the instructor to identify examples or contexts that may conveniently cater to individual students. Now more than ever, technical content taught in class should be engaging to a diverse audience that may include students with professional interests in humanities, arts, social sciences, and STEM fields, coming from diverse cultural and socioeconomic backgrounds—all in the same classroom. As the “universal language of mankind” (Longfellow Citation1835, p. 4) music is one powerful medium that can effectively address that challenge.
In this work the author proposed the Playmeans as a handy pedagogical tool that is grounded in music, is engaging, and is inclusive regardless of diverse cultural, socioeconomic, and professional backgrounds of its users. The novel, interactive interface allows students to specify the artists of their interest and acquire their musical data from Spotify in real time. Giving students the freedom to streamline the data to their personal interests rather than work on generic predefined data creates the fertile ground in which the subsequent exploration and analysis then take place. Familiarity with the artist being analyzed gives a student an “expert” knowledge of how the artist sounds, which eliminates the time that a student and/or the instructor would otherwise spend on a lesser known context or subject matter. Students are encouraged to work on the artists of their choosing, and that in turn produces engagement. A classroom may consist of students having different personal and professional interests, and coming from various cultural and socioeconomic backgrounds—but as long as a student is a fan of a certain artist, Playmeans gives them the opportunity to acquire and engage in the analysis of the corresponding data. The wide-ranging music offered by Spotify makes Playmeans a convenient tool to engage student fans of both Western and non-Western music. The availability of data for artists of non-Western musical tradition makes Playmeans fit when working with classrooms where the representation of students’ musical tastes may span across Western and non-Western traditions.
The audio-interactivity of the app gives students the opportunity (and pleasure) of hearing track snippets of the chosen artist and thus turning the otherwise visual engagement with the app into an audiovisual interaction. This opportunity to validate what they see with what they hear adds fun to the engagement and allows students to review the results of their data analyses not only with a critical eye but also with an acute ear. Indeed, through the audiovisual encounter with the data, students get to evaluate whether what they see on a statistical display is in line with what they can concurrently hear, which in turn relates to their existing knowledge regarding the sound (and feel) of the track.
As it has been noted, in addition to performing the exploratory data analyses implemented as part of Playmeans, students may also download the data through the “Download” button in the “Data” tab. Students can dig deeper into the downloaded data by performing analyses that are not implemented in the app. For instance, Principal Component Analysis (PCA), Factor Analysis, and Canonical Correlation Analysis may be some of the further exploratory techniques that students might attempt when working with data of individual artists or for comparing artist together. Of course the downloaded data also provides opportunity to try various data visualization techniques to shed further light on the music of students’ interest.
In spite of its potential to aid engagement and include students with diverse cultural, socioeconomic, and professional backgrounds, it should be understood that there will be students who will not use Playmeans the same way others would. The audio features of Playmeans, for example, will not be relevant to students with a hearing impairment, while the infographic representation emerging from clustering (along with other graphics) might be useful. A similar argument can be made regarding the visual elements of the app for students with a vision impairment. Despite being a pedagogical tool to aid inclusion and engagement, the relevance of Playmeans for students with a hearing or vision impairment should be taken with a grain of salt and warrants future investigation.
The author has successfully implemented Playmeans in an introductory undergraduate course in analytics, garnering overwhelmingly positive reception from students. Playmeans can flexibly be integrated as part of an in-class activity or as a homework assignment, and it can be incorporated into introductory as well as advanced courses. It is hoped that instructors of analytics and data science will find Playmeans useful in their teaching, engaging and including students with diverse professional and personal interests.
ujse_a_2138801_sm3138.docx
Download MS Word (458.9 KB)ujse_a_2138801_sm3137.docx
Download MS Word (331.2 KB)Acknowledgments
The author would like to thank the editor, the associate editor, and the two anonymous referees for the various comments during the review of the article. Those suggestions led to a noticeable improvement of the manuscript.
Supplementary Materials
The supplementary materials for this article consist of the instructions on how to obtain login credentials from Spotify and a version of an assignment on Playmeans.
References
- Alesandrini, K., and Larson, L. (2002), “Teachers Bridge to Constructivism,” The Clearing House: A Journal of Educational Strategies, Issues and Ideas, 75, 118–121. DOI: 10.1080/00098650209599249.
- Brooks, J. G., and Brooks, M. G. (1999), In Search of Understanding: The Case for Constructivist Classrooms, Alexandria, VA: Association for Supervision and Curriculum Development.
- Brown, S., and Jordania, J. (2013), “Universals in the World’s Musics,” Psychology of Music, 41, 229–248. DOI: 10.1177/0305735611425896.
- Buisson, D. (1990), “Les Flûtes Paléolithiques d’Isturitz (Pyrénées-Atlantiques),” Bulletin de la Société Préhistorique Française, 87, 420–433. DOI: 10.3406/bspf.1990.9925.
- Chang, W., Cheng, J., Allaire, J., Xie, Y., and McPherson, J. (2017), Shiny: Web Application Framework for R, R Package Version, 1, 2017.
- Charles A. Dana Center at The University of Texas at Austin (2021), Data Science Course Framework, Austin, TX: Author.
- Darwin, C. R. (1889), The Descent of Man, and Selection in Relation to Sex, New York. D Appleton and Company.
- Deterding, S., Dixon, D., Khaled, R., and Nacke, L. (2011), “From Game Design Elements to Gamefulness: Defining ‘gamification’,” in Proceedings of the 15th International Academic MindTrek Conference: Envisioning Future Media Environments, pp. 9–15. DOI: 10.1145/2181037.2181040.
- Dissanayake, E. (2000), “Antecedents of the Modern Arts in Early Mother-Infant Interaction,” in The Origins of Music, eds. N. L. Wallin, B. Merker, and S. Brown, p. 389–410, Cambrdige, MA: The MIT Press.
- Doi, J., Potter, G., Wong, J., Alcaraz, I., and Chi, P. (2016), “Web Application Teaching Tools for Statistics Using R and Shiny,” Technology Innovations in Statistics Education, 9, 1–33. Available at https://escholarship.org/uc/item/00d4q8cp DOI: 10.5070/T591027492.
- Fernald, A. (1991), “Prosody in Speech to Children: Prelinguistic and Linguistic Functions,” Annals of Child Development, 8, 43–80.
- Freeman, S., Eddy, S. L., McDonough, M., Smith, M. K., Okoroafor, N., Jordt, H., and Wenderoth, M. P. (2014), “Active Learning Increases Student Performance in Science, Engineering, and Mathematics,” Proceedings of the National Academy of Sciences of the United States of America, 111, 8410–8415. DOI: 10.1073/pnas.1319030111.
- Freeman, W. (2000), “A Neurobiological Role of Music in Social Bonding,” in The Origins of Music, eds. N. L. Wallin, B. Merker and S. Brown, pp. 411–424, Cambrdige, MA: The MIT Press.
- Gould, R. (2010), “Statistics and the Modern Student,” International Statistical Review, 78, 297–315. DOI: 10.1111/j.1751-5823.2010.00117.x.
- Hakeem, S. A. (2001), “Effect of Experiential Learning in Business Statistics,” Journal of Education for Business, 77, 95–98. DOI: 10.1080/08832320109599056.
- Hartigan, J. A., and Wong, M. A. (1979), “Algorithm AS 136: A k-means Clustering Algorithm,” Journal of the Royal Statistical Society, Series C, 28, 100–108. DOI: 10.2307/2346830.
- Hahn, J., and Münzel, S. (1995), “Knochenflöten aus den Aurignacien des Geissenklösterle bei Blaubeuren, Alb-Donau-Kreis,” Fundberichte Aus Baden-Würtemberg, 20, 1–12.
- Kapp, K. M. (2012), The Gamification of Learning and Instruction: Game-Based Methods and Strategies for Training and Education, San Francisco, CA: Wiley.
- Kunej, D., and Turk, I. (2000), “New Perspectives on the Beginnings of Music: Archaeological and Musicological Analysis of a Middle Paleolithic Bone ‘flute’,” in The Origins of Music, eds. N. L. Wallin, B. Merker and S. Brown, pp. 235–268, Cambridge, MA: The MIT Press.
- Kvam, P. H. (2000), “The Effect of Active Learning Methods on Student Retention in Engineering Statistics,” The American Statistician, 54, 136–140.
- Lawton, S., and Taylor, L. (2020), “Student Perceptions of Engagement in an Introductory Statistics Course,” Journal of Statistics Education, 28, 45–55. DOI: 10.1080/10691898.2019.1704201.
- Leng, X., and Shaw, G. L. (1991), “Toward a Neural Theory of Higher Brain Function using Music as a Window,” Concepts Neurosci, 2, 229–258.
- Lesser, L. M., Pearl, D. K., Weber, J. J., III, Dousa, D. M., Carey, R. P., and Haddad, S. A. (2019), “Developing Interactive Educational Songs for Introductory Statistics,” Journal of Statistics Education, 27, 238–252. DOI: 10.1080/10691898.2019.1677533.
- Levenshtein, V. I. (1966), “Binary Codes Capable of Correcting Deletions, Insertions, and Reversals,” Soviet Physics Doklady, 10, 707–710.
- Longfellow, H. W. (1835), Outre-Mer: A Pilgrimage beyond the Sea. New-York: Harper.
- MacQueen, J. (1967), “Some Methods for Classification and Analysis of Multivariate Observations,” in Proceedings of the Fifth Berkeley Symposium on Mathematical Statistics and Probability (Vol. 1, No. 14), pp. 281–297.
- Miller, G. (2000), “Evolution of Human Music through Sexual Selection,” in The Origins of Music, eds. N. L. Wallin, B. Merker, and S. Brown, pp. 329–360, Cambridge, MA: The MIT Press.
- National Academies of Sciences, Engineering, and Medicine. (2018), Data Science for Undergraduates: Opportunities and Options. Washington, DC: The National Academies Press. DOI: 10.17226/25104.
- Nijs, V. (2021), radiant: Business Analytics using R and Shiny. R package version 1.4.0. Available at https://github.com/radiant-rstats/radiant
- Peeters, M., Megens, C., Hoven, E. V. D., Hummels, C., and Brombacher, A. (2013), “Social Stairs: Taking the Piano Staircase towards Long-Term Behavioral Change,” in International Conference on Persuasive Technology, pp. 174–179, Berlin, Heidelberg: Springer.
- Phillips, D. C. (1995), “The Good, the Bad, and the Ugly: The Many Faces of Constructivism,” Educational Researcher, 24, 5–12. DOI: 10.3102/0013189X024007005.
- Ramler, I. P., and Chapman, J. L. (2011), “Introducing Statistical Research to Undergraduate Mathematical Statistics Students using the Guitar Hero Video Game Series,” Journal of Statistics Education, 19, 1–20.
- Rawlings-Goss, R., (Boots) Cassel, L., Cragin, M., Cramer, C., Dingle, A., Friday-Stroud, S., Herron, A., Horton, N., Inniss, T. R., Jordan, K., Ordóñez, P., Rudis, M., Rwebangira, R., Schmitt, K., Smith, D., and Stephens, S. (2018), “Keeping Data Science Broad: Negotiating the Digital and Data Divide Among Higher Education Institutions,” Mathematics and Statistics Faculty Publications, 64, 1–51. https://scholar.valpo.edu/math_stat_fac_pubs/64
- Resnick, L. B. (1989), “Introduction,” in Knowing, Learning, and Instruction, ed. L. B. Resnick, Hillsdale, NJ: Lawrence Erlbaum Associates.
- Richardson, V. (2003), “Constructivist Pedagogy,” Teachers College Record: The Voice of Scholarship in Education, 105, 1623–1640. DOI: 10.1046/j.1467-9620.2003.00303.x.
- Schwab-McCoy, A., Baker, C. M., and Gasper, R. E. (2021), “Data Science in 2020: Computing, Curricula, and Challenges for the Next 10 Years,” Journal of Statistics and Data Science Education, 29, S40–S50. DOI: 10.1080/10691898.2020.1851159.
- Sridharan, D., Levitin, D. J., Chafe, C. H., Berger, J., and Menon, V. (2007), “Neural Dynamics of Event Segmentation in Music: Converging Evidence for Dissociable Ventral and Dorsal Networks,” Neuron, 55, 521–532. DOI: 10.1016/j.neuron.2007.07.003.
- Thompson, C., Parry, J., Phipps, D., and Wolff, T. (2019), spotifyr: R Wrapper for the ’Spotify’ Web API, R package version 2.1.1.
- Trehub, S. E. (2003), “The Developmental Origins of Musicality,” Nature Neuroscience, 6, 669–673. DOI: 10.1038/nn1084.
- Zagerman, J. M. (2018), “Using Song Lyrics in Teaching an Undergraduate Statistics Course.” All Theses and Dissertations. 157. Available at https://dune.une.edu/theses/157