 ?Mathematical formulae have been encoded as MathML and are displayed in this HTML version using MathJax in order to improve their display. Uncheck the box to turn MathJax off. This feature requires Javascript. Click on a formula to zoom.
Abstract
Can a “nudge” toward engaging, fun, and useful material improve student attitudes toward statistics? We report on the results of a randomized study to assess the effect of a “nudge” delivered via a weekly E-mail digest on the attitudes of students enrolled in a large introductory statistics course taught in both flipped and fully online formats. Students were randomized to receive either a personalized weekly E-mail digest with course information and a “nudge” to read and explore interesting applications of statistics relevant to the weekly course material, or a generic course E-mail digest with the same course information, and no “nudge.” Our study found no evidence that “nudging” students to read and explore interesting applications of statistics resulted in better attitudes toward statistics. Supplementary materials for this article are available online.
1 Introduction
Increased use of technology for elements of course delivery raises many questions about its effect on student achievement and engagement. In considering these questions, statistics instructors have experimented with a variety of course delivery methods including blended, flipped, and fully online courses. Blended courses use a combination of face-to-face and online delivery; courses are often categorized as blended when the proportion of course material that is delivered online is between 40% and 80% (Boettcher and Conrad Citation2016, p. 11). In flipped courses, course content is delivered through asynchronous online components and face-to-face meetings are used for active learning, such as discussion and problem-solving in groups (Boettcher and Conrad Citation2016, p. 12). For introductory statistics courses, a number of studies have investigated whether these different delivery methods result in different learning outcomes (e.g., Utts et al. Citation2003; Wilson Citation2013; Gundlach et al. Citation2015; Touchton Citation2015; Peterson Citation2016; Nielsen, Bean, and Larsen Citation2018), whether they can lead to improved retention (Winquist and Carlson Citation2014), and if different methods have an effect on student attitudes toward statistics (e.g., Gundlach et al. Citation2015; Loux, Varner, and VanNatta Citation2016).
A positive relationship between attitude and achievement has been demonstrated in many studies (Emmioğlu and Capa-Aydin Citation2012), and perceived usefulness has been demonstrated as a factor related to student engagement. In addition to possible differences among delivery methods, students’ engagement in introductory statistics has been shown to be related to the perceived usefulness of statistics (Hassad Citation2018). As a consequence, many introductory courses have focused on statistical literacy. Statistical literacy can be defined as “[p]eople’s ability to interpret and critically evaluate statistical information and data-based arguments appearing in diverse media channels, and their ability to discuss their opinions regarding such statistical information” (Gal (Citation2000) as cited in Rumsey Citation2002 and Hassad Citation2018). Statistics instructors often present interesting media stories, that contain statistical information, as a strategy to help students engage in statistical concepts, demonstrate the usefulness of statistics, and promote statistical literacy.
Some instructors have inserted elements of fun in their statistics courses in the hopes of reducing student anxiety, improving attitudes toward statistics and improved student achievement (Lesser, Pearl, and Weber III 2016). Types of fun include cartoons, games, and quotations (Lesser and Pearl Citation2008)
1.1 Choice Architecture and Nudging
“A choice architect has the responsibility for organizing the context in which people make decisions.” “A nudge… is any aspect of the choice architecture that alters people’s behavior in a predictable way without forbidding any options or significantly changing their economic incentives. To count as a mere nudge, the intervention must be easy and cheap to avoid. Nudges are not mandates. Putting the fruit at eye level counts as a nudge. Banning junk food does not.” (Thaler and Sunstein Citation2008)
Thaler and Sunstein (Citation2008) developed the theory of nudging based on work by the psychologists Daniel Kahneman and Amos Tversky that began in the 1970s (e.g., Tversky and Kahneman Citation1971; Kahneman and Tversky Citation1979) and eventually developed into the field of behavioral economics. Kahneman and Tversky discovered that individuals “have erroneous intuitions about the laws of chance” (Tversky and Kahneman Citation1971), and assess loss and gain asymmetrically (Tversky and Kahneman Citation1991), which is inconsistent with a key assumption in classical economic theory which posits that consumers behave in a rational manner (Tversky and Kahneman Citation1991; Kahneman Citation1994).
Amelioration of decision-making in cases where people make “… decisions that are difficult and rare… do not get prompt feedback, and when they have trouble translating aspects of the situation into terms that they can easily understand” is central to nudging (Thaler and Sunstein Citation2008). The low cost of nudging people in a direction is a major appeal, and part of the reason that more than 200 government teams around the world are developing, testing, and scaling behavioral interventions, although education was one of the last areas to receive attention from behavioral scientists (Oreopoulos Citation2020).
1.2 Nudging in Education
In a review of nudging interventions in education, Damgaard and Nielsen (Citation2018) conclude that the “greatest effects often arise for individuals affected most by the behavioral barrier targeted by the intervention.” Page, Lee, and Gehlbach (Citation2020), describe the results of a randomized study of a persistence-focused chatbot to provide outreach and support to undergraduates at Georgia State University that was effective. A study by van Oldenbeek et al. (Citation2019) used an alternating treatment design to evaluate the effect of E-mail-based progress feedback in a blended course, and found that nudges were effective in increasing the number of minutes viewing class videos. In the context of learning analytics, there have been recent studies showing positive benefits of nudging through targeting E-mails to students whose engagement in course resources through the learning management system is below average (Fritz Citation2017; Lawrence et al. Citation2021; Brown et al. Citation2022). Oreopoulos (Citation2020) provides an overview of nudging in education.
Instructors presenting engaging material such as media stories and elements of fun must consider how they make these materials available to their students. When instructors design course learning objectives, select topics to achieve these objectives, and create assessments, they create choices for students to become engaged in course material. A choice architect is someone who can indirectly influence the choices other people make (Thaler and Sunstein Citation2008). A course instructor is an example of a choice architect. Choices presented to students in a course can indirectly influence the choices that they make to engage with the material (e.g., students can choose to do some external reading related to course topics). Most people will choose the default option—an option that can be obtained if the chooser does nothing. This is the option that requires the least effort. Can instructors influence this behavior? More specifically, can students in an introductory statistics course be “nudged” toward having better attitudes toward statistics by changing the default options students have to engage with the material?
1.3 Randomized Studies in Education
Carrying out a randomized control trial is the gold standard in assessing the influence of an intervention, and requires, in the case of single treatment, randomly assigning some study participants to a treatment group and the remainder of the study participants to a control group. Most courses operate on the principle that all students in a course will have the exact same course resources available in the natural learning situation of teaching in groups, such as lectures or seminars (Dreyhaupt et al. Citation2017). Thus, in educational settings it is often the case that it is neither practical nor ethical to randomly assign students to treatment or control groups, even though they “deliver more convincing results” (Dreyhaupt et al. Citation2017). A notable exception is the randomized study carried out by Lesser, Pearl, and Weber III (2016) which showed that students interacting with online content including an element of fun (a song) responded correctly more often to a related assessment question, but did not show improvements in attitudes.
In this article, we describe the impact of a randomized intervention that was implemented in a large multisection introductory statistics course taught in both flipped and fully online formats designed to nudge students toward developing better attitudes toward statistics. The study’s motivation was to address some negative results we had observed in changes in students’ attitudes, particularly for students in fully online sections of the course when compared to students taught in the flipped format (CitationGibbs and Taback 2018). Through a randomized design, we investigated whether the use of a “nudge” could lead to measurably improved attitudes if the “nudge” engaged students in “interesting” and “entertaining” material related to, but beyond, the scope of the course.
2 A Randomized Experiment to Improve Student Attitudes in an Introductory Statistics Course
2.1 Background
The Practice of Statistics I (STA220H1F) is a large (1300+ students in 2015 and 1600+ students in 2016, in sections of 200–400 students) multisection introductory statistics course at the University of Toronto. At the time, it could be used as a first course for students who go on to complete a program of study in statistics, however, approximately 95% of the students in the course were not enrolled in a statistics program of study and were using the course as the sole statistics course for another program of study, such as life sciences. In the fall of 2014 two of five sections of the course were taught in a flipped style as a pilot. In fall 2015 and 2016 all sections were taught in a flipped style and two fully online sections were added to the course.
All sections used the same online materials with a common final exam. The common online materials included video lectures, R Shiny apps with accompanying learning activities, not-for-credit multiple choice concept checks, and for-credit quizzes. In the flipped sections, in-person class time was used for mini lectures to address misconceptions, group problem-solving, and peer instruction to build conceptual understanding (Crouch and Mazur Citation2001). In parallel to the in-person activities of the flipped sections, the fully online sections supplemented the online material with synchronous and asynchronous discussions about common misconceptions, asynchronous group problem-solving, and synchronous tutorials. The synchronous tutorials consisted of just-in-time teaching, learning activities, and small group work. Discussions in online tutorials were initiated by both students and instructors.
In fall of 2015 we collected data on students’ attitudes toward statistics. Most dimensions of students’ attitudes became worse by the end of the course, and were statistically significantly lower in the online sections of the course (CitationGibbs and Taback 2018). While observing such a decline is not unusual (Schau and Emmioğlu Citation2012), we sought strategies to better support the development of positive attitudes, particularly for students in the online sections. In fall 2016, weekly E-mails to students about the course were tested to see if their use could positively influence student attitudes.
2.2 The Intervention and Study Hypothesis
Given the evidence that perceived usefulness of statistics leads to more positive attitudes and that positive attitudes lead to better achievement, we considered how as instructors we might take advantage of our role as choice architects to improve student perceptions. In particular, we asked: Can students in an introductory statistics course be “nudged” toward having better attitudes toward statistics by changing the default choice students have to engage with the material? We thus investigated whether students who receive a nudge to read and explore additional entertaining and engaging information related to course topics develop better attitudes toward statistics. If students form an appreciation of the relevance of statistics in everyday life, would this lead to better attitudes toward statistics? In this study, we evaluated the hypothesis that students who develop an appreciation of the relevance of statistics in everyday life will have better attitudes toward statistics.
2.3 Study Design
2.3.1 Weekly E-mail Digest
The primary aim of this study was to test if nudging students to read and explore interesting and fun real-life stories involving statistics would result in better attitudes toward statistics. But, it’s not feasible to force students to read these stories or randomly assign, say, only half the class to read these stories. But we could present half of the students with a nudge toward these in an E-mail.
The nudge consisted of web links to news items, blog posts, or videos that connected weekly topics to real world applications, relating statistical concepts covered in the course to real data with context and purpose, even though these examples were sometimes not covered in the course. “Using real datasets of interest to students is a good way to engage students in thinking about the data and relevant statistical concepts… reflections of students who used real data in a statistics course… found the use of real data was associated with students’ appreciating the relevance of the course material to everyday life. Further, students indicated that they felt the use of real data made the course more interesting” (GAISE College Report ASA Revision Committee Citation2016).
In fall 2016, STA220H1F students were randomized to receive a personalized weekly E-mail digest with a nudge and routine course information or a generic weekly E-mail digest without a nudge and the same routine course information. The weekly E-mail digest with a nudge was considered the active treatment, and the E-mail digest without a nudge the control treatment. Routine course information included timely course information, such as weekly topics, weekly homework assignments, and upcoming milestones.
Analyses of 2015 STA220H1F data (CitationGibbs and Taback 2018) showed that attitudes and final course grades differed by cumulative grade point average (CGPA). As a consequence, the 2016 randomization was stratified by performing a randomization separately within each stratum of CGPA and lecture section to ensure that the study was balanced by CGPA within each lecture section.
Data on students’ CGPA, sex, and lecture section were obtained from institutional student records.
The study was approved by the University of Toronto research ethics board. Students were asked to review a consent form where they were required to opt in to the study, and would receive an incentive mark of 1% to their final grade for completing pre- and post-SATS-36 (see Consent Form section in Appendices, supplementary materials).
outlines the components of the weekly digest sent to students, and shows the differences between the two versions. The main feature of the weekly digest with a nudge is the connection between the statistical topics being studied in class and current real world applications that involve these topics, although, as noted in , they also often included some modalities of “fun” (Lesser and Pearl Citation2008). The goal was to “nudge” students receiving this version of the weekly digest to explore the connections of what they were learning to the real world, and encourage independent exploration.
Table 1 Description of weekly digest components.
Table 2 Sources used for weekly E-mail digest with a nudge.
shows the sources and specific examples used to create the sections of the weekly digest with a nudge. These sources were also used to create modern real world examples of statistical concepts and techniques for the class.
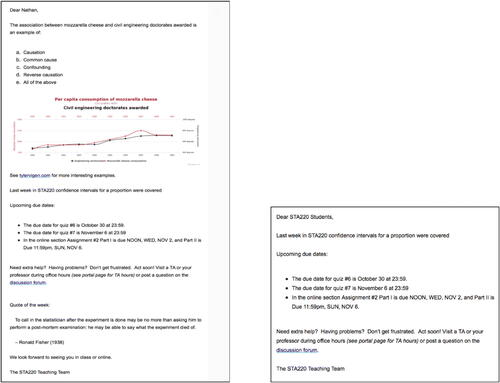
gives an example of an E-mail digest with a nudge and the corresponding E-mail without a nudge. Additional examples of the weekly E-mail digest are included in the Appendices section, supplementary materials. E-mails were sent using Mailchimp in order to facilitate mass E-mails and tracking of whether students opened the E-mails.
Fig. 1 An example of an E-mail digest with a nudge (left) and the corresponding E-mail digest without a nudge (right).
2.3.2 SATS-36
Student attitudes were measured using the Survey of Attitudes Toward Statistics SATS-36 (Schau Citation2003). SATS-36 was chosen among the many surveys designed to assess student attitudes toward statistics because, among these surveys, the strongest evidence of construct validity and internal consistency exists for SATS-36 (Nolan, Beran, and Hecker Citation2012) and it is very widely used (Schau and Emmioğlu Citation2012). SATS-36 provides measures of student attitudes in six components, defined by Schau (Citation2003) as
Affect—students’ feelings concerning statistics
Cognitive competence—students’ attitudes about their intellectual knowledge and skills when applied statistics
Value—students’ attitudes about the usefulness, relevance and worth of statistics in personal and professional life
Difficulty—students’ attitudes about the difficulty of statistics as a subject
Interest—students’ level of individual interest in statistics
Effort—amount of work the student expends to learn statistics
The score for each component is the average of 7-point Likert items, where higher scores correspond to more positive attitudes.
SATS-36 was administered at the beginning of the course (SATS-36 pretest) and at the end of the course (SATS-36 posttest). Schau and Emmioğlu (Citation2012) indicate that a pre-post change of at least 0.5 is practically meaningful.
3 Results
All statistical analyses were conducted using R version 4.2.
3.1 Weekly Interesting E-mail versus Plain E-mails
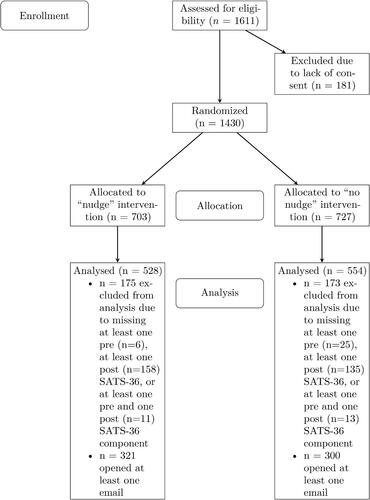
In 2016, there were 1611 students enrolled in the course. Of these students, 1430 (89%) consented to take part in the study; 703 (49%) students were randomly assigned to the “nudge” group, and 727 (51%) students to the “no nudge” group. Among the 1430 students who consented, 1082 (76%) students completed all the SATS-36 questions. All analyses are based on the 1082 students who completed all SATS-36 questions. Thus, analyses use data from 67% of the students enrolled in the course (see ).
Fig. 2 Flow diagram illustrating final analytic sample.
gives demographic and academic information on the consenting students who had completed all SATS-36 questions within each of the weekly E-mail digest groups, which are comparable. The random assignment to type of weekly E-mail digest was effective in balancing students by CGPA, sex, year of study, and lecture section.
Table 3 Distribution of student characteristics by intervention group.
and show the completion rates within each E-mail group by pre and post SATS-36 and those that completed both pre- and post-surveys. The individual SATS-36 components show similar distributions across the two e-mail groups and pre- and post-surveys. The pre-SATS-36 survey was completed by almost all students that consented, with completion rates ranging from 95% to 99%, and post-SATS-36 had completion rates ranging from 76% to 81%.
Table 4 SATS-36 completion by weekly E-mail digest group and pre post surveys.
Table 5 SATS-36 Completion of both pre and post by weekly E-mail digest group.
Missing data patterns were computed using the md. pattern() function from the mice library in R (van Buuren and Groothuis-Oudshoorn Citation2011). There are 11 and 9 missing data patterns in the pre- and post- surveys, respectively. The most frequent missing data pattern in the pre- and post-surveys is missing items required to compute all the SATS-36 components (pre-SATS-36: (3%), post-SATS-36:
(21%)).
When both pre- and post-surveys are pooled together, there are 23 missing data patterns. The two most frequently occurring missing data pattern in this pooled dataset were among students completing all pre-SATS-36 items required to compute the six components, but not completing all the items required for any of the post-SATS-36 items (, 19% of randomized students), and students completing all the pre-SATS-36 items required to compute all the post-SATS-36 components, but not completing all the items required to compute any of the post-SATS-36 components (
, 2% of randomized students). The other 22 missing data patterns occurred in less than 2% of randomized students.
shows the distribution of scores from the pretest components of SATS-36 by weekly E-mail digest group.
Fig. 3 Pretest scores on components of SATS-36 by type of Weekly E-mail Digest.
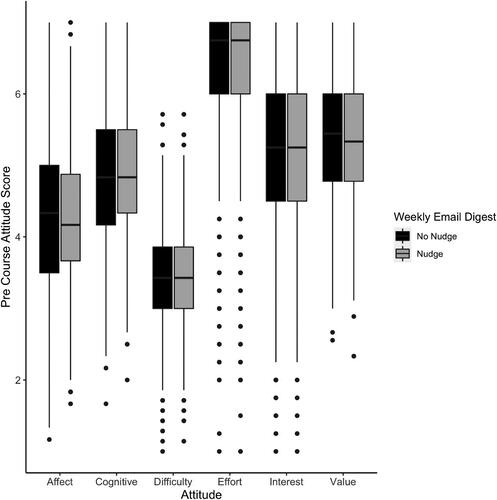
The majority of students were female, had a CGPA of B or C, had positive attitudes toward statistics at the start of the course, and the distribution of pretest SATS-36 scores are similar in each group across the six SATS components.
Data on which respondents opened any E-mail at least once were available from MailChimp, the E-mail platform that was used to send the weekly E-mails. 621 (57%) students opened the weekly E-mail at least once. The distribution of students who opened at least one E-mail by E-mail group is shown in . A greater proportion of students in the nudge group opened at least one E-mail (61% in the interesting E-mail group vs. 54% in the no nudge group).
Table 6 Opened at least one E-mail by E-mail group.
Following Millar and Schau (Citation2010), SATS-36 gain score (the difference between post- and pre- SATS-36 score) was modeled with an adjustment for pretest score. A linear model was fit to evaluate the effect of the E-mail intervention, using the R function lm(), with gain score for each attitude component as the response and with the following covariates: pretest SATS-36, cumulative grade point average, sex, lecture section, E-mail group, and an indicator for opening the course E-mail at least once. The least-squares means of the gain scores, obtained from the lsmeans() function from the lsmeans library (Lenth Citation2016), were computed for each E-mail group. Confidence intervals for the differences in adjusted gain scores between groups were computed. A Bonferroni correction to account for constructing six (one for each component of SATS-36) confidence intervals with a confidence coefficient of lead to using a confidence coefficient of
to account for multiple comparisons.
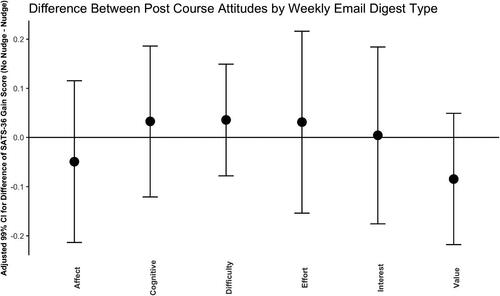
shows the adjusted confidence intervals for the mean difference between the nudge and no nudge groups in the changes in attitudes. There were modest, not statistically significant differences in means between the E-mail groups. The results of this analysis are similar when conducted on the subgroup of students that opened an E-mail at least once.
Fig. 4 Adjusted confidence intervals for difference in mean gain scores between weekly E-mail digest groups in components of SATS-36.
The analysis in that computed the adjusted least-squares means of the gain scores was repeated using the R function mice() from the mice library (van Buuren and Groothuis-Oudshoorn Citation2011) to impute missing values for missing SATS-36 components in the pre- and post-surveys. The results of this analysis are similar to those shown in indicating that the results are not sensitive to missing pre-SATS or post-SATS data.
The multivariate models for the gain scores had adjusted parameter estimates for opening an E-mail at least once that ranged from –0.1 to 0.0 with corresponding p-values that were at least 0.45. Thus, there is no evidence that opening an e-mail at least once was predictive of the gain scores for the SATS-36 components.
shows the least squares means of the final course marks adjusted for cumulative grade point average, and lecture section within each E-mail group and indicator for opening the course E-mail at least once, and a comparison between these means for the nudge and no nudge groups. The marks were out of 100. The difference between the E-mail digest groups among the subgroup of students that opened the E-mail at least once is larger compared to the difference among students that never opened the E-mail, although both differences are very small.
Table 7 Adjvusted mean course performance by weekly E-mail digest group.
shows the means and standard deviations for each SATS-36 component separately for each E-mail group, for both the pre- and post-tests. Modest decreases in attitudes were observed, but with minimal differences by randomization group. Most components had a decrease in mean score, except for the difficulty component, which had no change or a minimal increase in mean score. While decreases in mean scores for the components interest and effort were practically meaningful with declines greater than 0.5, the differences in these decreases between the no nudge and nudge E-mail groups were neither practically nor statistically significant.
Table 8 SATS-36 summary statistics.
4 Discussion
4.1 Limitations
Several limitations related to the design of this study are important, and may have impacted the results we observed.
Even though the design allowed us to carry out a randomized study, adding interesting content to weekly E-mail digests as a “nudge” to encourage engagement may not have been a strong enough intervention to see an effect. “Fun” and “interesting” are subjective, and what the teaching team decided was “fun” and “interesting,” may not have been perceived as such by students.
Students were randomized to receive a nudge (active treatment) to read and explore applications of statistics in real life through a weekly e-mail, but our data show that only slightly more than half the students actually opened the weekly e-mail. Students in the nudge E-mail group opened the E-mail more often compared to students in the no nudge E-mail group (control treatment). If we assume that approximately half the students not only opened but also read the information in the E-mail, then this may bias the effect on attitudes toward the group that received a nudge. Students may have opened the E-mail, but not clicked on the links and read the content, which may bias the effect on attitudes toward the group that didn’t receive a nudge. There are several variations of these potential biases: students who received a nudge clicked on the link, but didn’t read the content; students that didn’t receive a nudge sought out interesting stories about statistics in everyday life; or a student who received an E-mail with a nudge might have forwarded it to another student in the class who received an E-mail without a nudge. These potential biases illustrate the myriad reasons why students may not have followed the nudge or received a nudge even though they were randomized to the no nudge group.
It was not feasible for the study to collect data on clicks and time spent on links provided in the nudge group. Finally, our data on E-mail opening may underestimate the number of students who opened an E-mail. The E-mail client MailChimp uses Web beacon trafficking which relies on a hidden graphic embedded in the E-mail, and won’t work if, for example, a student chose not to display images (MailChimp n.d.). It is difficult to know what, if any, effect these treatment uptake limitations might have on a students’ attitudes toward statistics.
4.2 Conclusions
Our findings are consistent with Lesser, Pearl, and Weber III (2016) who found no evidence of an effect on inserting a song on student attitudes as measured by SATS-36. Other studies have resulted in the conclusion that attitudes toward statistics are stable and difficult to change in a single course, although “… a few researchers have reported modest success at improving student attitudes in individual courses” (Pearl et al. Citation2012). Gal, Ginsburg, and Schau (Citation1997) “caution that studies of pre-post course change as measured by such instruments, often show little change, perhaps indicating the stability of the factors studied and the accompanying resistance to change.”
In discussing the promises and limitations of nudging in education Oreopoulos (Citation2020) states that, “Many recent attempts to test large-scale low touch nudges find precisely estimated null effects, suggesting we should not expect letters, text messages, and online exercises to serve as panaceas for addressing education policy’s key challenges.”
Engaging many students in one introductory course is challenging. Including elements of remote instruction further adds to the challenge. Frequent communication is a commonly suggested best practice in remote instruction (see, e.g., Darby Citation2019, p. 87). Regular E-mail or other electronic methods of communicating with students provide simple, convenient methods for instructors to engage a large number of students simultaneously. Our study suggests that including applications of statistics that some might view as “interesting” or “amusing” may not result in measurable benefits in shifting short-term attitudes toward statistics, and instructors considering making this extra effort to enhance their communications may not observe a change in attitudes by the end of their course.
Supplementary Material
In the supplement, we provide a link to the data and R code used to produce the analyses in this article, consent form, and sample email digests.
References
- Boettcher, J. V., and Conrad, R.-M. (2016), The Online Teaching Survival Guide (2nd ed.), San Francisco: Jossey-Bass.
- Brown, A., Lawrence, J., Basson, M., Axelsen, M., Redmond, P., Turner, J., Maloney, S., and Galligan, L. (2022), “The Creation of a Nudging Protocol to Support Online Student Engagement in Higher Education,” Active Learning in Higher Education, 1–15. DOI: 10.1177/14697874211039077.
- Crouch, C. H., and Mazur, E. (2001), “Peer Instruction: Ten Years of Experience and Results,” American Journal of Physics, 69, 970–977. DOI: 10.1119/1.1374249.
- Damgaard, M. T., and Nielsen, H. S. (2018), “Nudging in Education,” Economics of Education Review, 64, 313–342, DOI: 10.1016/jeconedurev.2018.03.008.
- Darby, F. (2019), Small Teaching Online: Applying Learning Science in Online Classes, Arlington: Jossey-Bass.
- Dreyhaupt, J., Mayer, B., Keis, O., Öchsner, W., and Muche, R. (2017), “Cluster-Randomized Studies in Educational Research: Principles and Methodological Aspects,” GMS Journal for Medical Education, 34, 1–12. DOI: 10.3205/zma001103.
- Emmioğlu, E., and Capa-Aydin, Y. (2012), “Attitudes and Achievement in Statistics: A Meta-Analysis Study,” Statistics Education Research Journal, 11, 95–102. DOI: 10.52041/serj.v11i2.332.
- Fritz, J. (2017), “Using Analytics to Nudge Student Responsibility for Learning,” New Directions for Higher Education, 2017, 65–75, DOI: 10.1002/he.20244.
- GAISE College Report ASA Revision Committee (2016), “Guidelines for Assessment and Instruction in Statistics Education (GAISE) College Report 2016,” available at https://www.amstat.org/education/guidelines-for-assessment-and-instruction-in-statistics-education-(gaise)-reports.
- Gal, I. (2000), Adult Numeracy Development: Theory, Research, Practice. Series on Literacy: Research, Policy, and Practice, ERIC.
- Gal, I., Ginsburg, L., and Schau, C. (1997), “Monitoring Attitudes and Beliefs in Statistics Education,” The Assessment Challenge in Statistics Education, 12, 37–51.
- Gibbs, A. L., and Taback, N. (2018), “Encouraging Better Attitudes: The Story of an Investigation of Teaching and Learning Introductory Statistics,” available at https://alisongibbs.github.io/talks/2018-06-05-SSC.
- Gundlach, E., Richards, K. A. R., Nelson, D., and Levesque-Bristol, C. (2015), “A Comparison of Student Attitudes, Statistical Reasoning, Performance, and Perceptions for Web-Augmented Traditional, Fully Online, and Flipped Sections of a Statistical Literacy Class,” Journal of Statistics Education, 23, 1–33. DOI: 10.1080/10691898.2015.11889723.
- Hassad, R. A. (2018), “An Exploration of the Perceived Usefulness of the Introductory Statistics Course and Students’ Intentions to Further Engage in Statistics,” Numeracy, 11, 1–10. DOI: 10.5038/1936–4660.11.1.7.
- Kahneman, D. (1994), “New Challenges to the Rationality Assumption,” Journal of Institutional and Theoretical Economics (JITE)/Zeitschrift für die gesamte Staatswissenschaft, 150, 18–36.
- Kahneman, D., and Tversky, A. (1979), “Prospect Theory: An Analysis of Decision under Risk,” Econometrica, 47, 263–292. DOI: 10.2307/1914185.
- Klein, G., and Dabney, A. (2013), The Cartoon Introduction to Statistics, New York: Hill and Wang.
- Lawrence, J., Brown, A., Redmond, P., Maloney, S., Basson, M., Galligan, L., and Turner, J. (2021), “Does Course Specific Nudging Enhance Student Engagement, Experience and Success?: A Data-Driven Longitudinal Tale,” Student Success, 12, 28–37. DOI: 10.5204/ssj.1914.
- Lenth, R. V. (2016), “Least-Squares Means: The R Package lsmeans,” Journal of Statistical Software, 69, 1–33. DOI: 10.18637/jss.v069.i01.
- Lesser, L. M., and Pearl, D. K. (2008), “Functional Fun in Statistics Teaching: Resources, Research and Recommendations,” Journal of Statistics Education, 16. DOI: 10.1080/10691898.2008.11889572.
- Lesser, L. M., Pearl, D. K., and Weber III, J. J. (2016), “Assessing Fun Items’ Effectiveness in Increasing Learning of College Introductory Statistics Students: Results of a Randomized Experiment,” Journal of Statistics Education, 24, 54–62. DOI: 10.1080/10691898.2008.11889572.
- Loux, T. M., Varner, S. E., and VanNatta, M. (2016), “Flipping an Introductory Biostatistics Course: A Case Study of Student Attitudes and Confidence,” Journal of Statistics Education, 24, 1–7. DOI: 10.1080/10691898.2016.1158017.
- MailChimp (n.d.), “Use Open Tracking in Emails,” available at https://mailchimp.com/help/about-open-tracking/, retrieved: July 19, 2022.
- Millar, A. M., and Schau, C. (2010), “Assessing Students’ Attitudes: The Good, the Bad, and the Ugly,” in Proceedings of the Joint Statistical Meetings, pp. 1133–1143.
- Nielsen, P. L., Bean, N. W., and Larsen, R. A. A. (2018), “The Impact of a Flipped Classroom Model of Learning on a Large Undergraduate Statistics Class,” Statistics Education Research Journal, 17, 121–140. DOI: 10.52041/serj.v17i1.179.
- Nolan, M. M., Beran, T., and Hecker, K. G. (2012), “Surveys Assessing Students’ Attitudes Toward Statistics: A Systematic Review of Validity and Reliability,” Statistics Education Research Journal, 11, 103–123. DOI: 10.52041/serj.v11i2.333.
- Oreopoulos, P. (2020), “Promises and Limitations of Nudging in Education,” IZA Discussion Papers, No. 13718, Institute of Labor Economics (IZA), Bonn, Available at https://docs.iza.org/dp13718.pdf.
- Page, L. C., Lee, J., and Gehlbach, H. (2020), “Conditions Under Which College Students can be Responsive to Nudging,” Available at http://www.edworkingpapers.com/ai20-242. DOI: 10.26300/vjfs–kv2.
- Pearl, D., Garfield, J., delMas, R., Groth, R., Kaplan, J., McGowan, H., and Lee, H. (2012), “Connecting Research to Practice in a Culture of Assessment for Introductory College-Level Statistics,” Available at http://www.causeweb.org/research/guidelines/ResearchReport_Dec_2012.pdf.
- Peterson, D. J. (2016), “The Flipped Classroom Improves Student Achievement and Course Satisfaction in a Statistics Course: A Quasi-Experimental Study,” Teaching of Psychology, 43, 10–15. DOI: 10.1177/0098628315620.
- Rumsey, D. J. (2002), “Statistical Literacy as a Goal for Introductory Statistics Courses,” Journal of Statistics Education, 10. 898.2002.11910678. DOI: 10.1080/10691.
- Schau, C. (2003), “Survey of Attitudes Toward Statistics (SATS-36),” Available at https://www.evaluationandstatistics.com.
- Schau, C., and Emmioğlu, E. (2012), “Do Introductory Statistics Courses in the United States Improve Students’ Attitudes?” Statistics Education Research Journal, 11, 86–94. DOI: 10.52041/serj.v11i2.331.
- Taback, N., and Gibbs, A. (2022), “nudgedata,” DOI: 10.5281/zenodo.7080181.
- Thaler, R. H., and Sunstein, C. R. (2008), Nudge, New Haven: Yale University Press.
- Touchton, M. (2015), “Flipping the Classroom and Student Performance in Advanced Statistics: Evidence From a Quasi-Experiment,” Journal of Political Science Education, 11, 28–44. DOI: 10.1080/15512169.2014.985105.
- Tversky, A., and Kahneman, D. (1971), “Belief in the Law of Small Numbers,” Psychological Bulletin, 76, 105– 110. DOI: 10.1037/h0031322.
- Tversky, A., and Kahneman, D. (1991), “Loss Aversion in Riskless Choice: A Reference-Dependent Model,” The Quarterly Journal of Economics, 106, 1039–1061. DOI: 10.2307/2937956.
- Utts, J., Sommer, B., Acredolo, C., Maher, M. W., and Matthews, H. R. (2003), “A Study Comparing Traditional and Hybrid Internet-Based Instruction in Introductory Statistics Classes,” Journal of Statistics Education, 11. DOI: 10.1080/10691898.2003.11910722.
- van Buuren, S., and Groothuis-Oudshoorn, K. (2011), “mice: Multivariate Imputation by Chained Equations in R,” Journal of Statistical Software, 45, 1–67. DOI: 10.18637/jss.v045.i03.
- van Oldenbeek, M., Winkler, T. J., Buhl-Wiggers, J., and Hardt, D. (2019), “Nudging in Blended Learning: Evaluation of Email-Based Progress Feedback in a Flipped-Classroom Information Systems Course,” in Proceedings of the 27th European Conference on Information Systems (ECIS), Stockholm & Uppsala, Sweden, Available at https://aisel.aisnet.org/ecis2019_rp/186.
- Wilson, S. G. (2013), “The Flipped Class: A Method to Address the Challenges of an Undergraduate Statistics Course,” Teaching of Psychology, 40, 193–199. DOI: 10.1177/00986283134874.
- Winquist, J. R., and Carlson, K. A. (2014), “Flipped Statistics Class Results: Better Performance Than Lecture Over One Year Later,” Journal of Statistics Education, 22. DOI: 10.1080/10691898.2014.11889717.