 ?Mathematical formulae have been encoded as MathML and are displayed in this HTML version using MathJax in order to improve their display. Uncheck the box to turn MathJax off. This feature requires Javascript. Click on a formula to zoom.
Abstract
Interactive web-based applets have proven effective in teaching statistics. This article presents new implementations of web-based applets primarily targeting a traditional introductory statistics course in two particular areas: (a) using real-time response data to engage students in simulations and (b) generating randomized datasets for assignments. It also provides an extended use case in courses beyond the traditional introductory statistics course. All applets given in the examples are made using the open-source package Shiny in R. The source code with detailed comments for all applets in this article is available in the supplementary materials section for other instructors to adopt and tailor to their needs. Supplementary materials for this article are available online.
1 Introduction
Teaching statistics with applets has great potential to improve students’ learning outcomes and satisfaction (Chance and Rossman Citation2006; Dinov, Sanchez, and Christou Citation2006; Doi et al. Citation2016; Fawcett Citation2018; González et al. Citation2018) and has been recommended in the revised Guidelines for Assessment and Instruction in Statistics Education (GAISE) College Report 2016 (GAISE College Report ASA Revision Committee Citation2016, pp. 19–21) as a technology option to explore concepts, analyze data, and facilitate activity. Since Nolan and Temple Lang (Citation2010) called for the inclusion of more computing in statistics curricula in their landmark article, progress has been made at all levels of the curricula. However, the implementation in any statistics class requires a careful selection of computing tools. According to a recent assessment by Woodard and Lee (Citation2021), “statistical programming languages can add extraneous cognitive load to the problem solving process.” This is particularly true for an introductory statistics class. As the revised GAISE College Report 2016 noted, “an introductory course is also a terminal course for many students.” Tools that prioritize the teaching of statistical thinking and computational reasoning while avoiding the obstacle of programming will give students more benefits in introductory courses. Even in upper-level statistics courses, tools that can quickly build intuitions are helpful for teaching and learning statistics. Applets have emerged as an effective solution. With nice user-friendly interfaces that hide all the coding work in the background, applets not only perfectly use the computing power of the software but actively engage students through interactive components (e.g., sliders, checkboxes, radio buttons). They thus have great potential to stimulate students’ interest in learning and improve their understanding of statistical concepts.
A particular type of applet, the web-based applet, has gained tremendous momentum in recent years because it is free online and runs independently on any web browser without the burden of installing any software. Examples of popular collections are:
Rossman/Chance Applet Collection (http://www.rossmanchance.com/applets/);
StatCrunch (https://www.statcrunch.com/applets/, West, Wu, and Heydt Citation2004);
StatKey (https://www.lock5stat.com/StatKey/, Morgan et al. Citation2014), which accompanies a textbook (Lock et al. Citation2021);
Seeing Theory, a visual project for probability and statistics from Brown University (https://seeing-theory.brown.edu/), which accompanies a textbook in progress (Kunin et al. Citation2018);
Bernhard Klingenberg’s collection (https://artofstat.com/web-apps), which also accompanies a textbook (Agresti, Franklin, and Klingenberg Citation2021);
Danny Kaplan’s Little Apps (http://www.statprep.org/LittleAppSite/);
The collection from the Statistics Department of Cal Poly (https://statistics.calpoly.edu/shiny, Doi et al. Citation2016);
The collection from Penn State University, Book of Apps for Statistics Teaching (BOAST) (https://shinyapps.science.psu.edu/, Pearl, Hatfield, and Beckman Citation2021);
The first three collections are javascript-based. Some of their strengths (e.g., animations) and limitations (e.g., extendability) are discussed in McNamara (Citation2016). The fourth collection from Brown University is an award-winning project. It uses a javascript library that makes visualizations not only interactive but also artistic. The last four collections are coded in R (R Core Team Citation2021) using the Shiny package (Chang et al. Citation2021). Although server management is a nontrivial task for Shiny applets (Wang et al. Citation2021), and it has limitations in efficiency and dynamic animation capabilities when compared with Javascript applets (Doi et al. Citation2016), its popularity has quickly risen due to its simple structure and many educators’ familiarity with R. In particular, Cal Poly and Penn State University’s approach of recruiting undergraduate students to develop applets for their peers is distinctive and inspiring. Student developers have a unique perspective into their peers’ needs and expectations in learning, and the incoming-outgoing flow of student developers in the project invigorates the maintenance, renovation, and invention of applets (Wang et al. Citation2021). In addition, student developers are able to gain valuable research experience through collaboration with peer developers and faculty mentors. Similar projects have started to emerge at other institutions as well, for example, the ShinyEd project at Duke University.
It is valuable for current and future educators to become applet developers in their own classrooms. As Doi et al. (Citation2016) argued, “despite the large collection of existing applet teaching tools found on the web, eventually an instructor can come across a problem in finding an existing applet to perfectly suit his/her needs.” With a growing user base and the common practice of sharing source code within the community, it is now possible to get fine control over the input and output components of an applet and tailor it to serve the specific objectives of a lesson plan. Applets have become an ideal tool that instructors can “redesign… to make it simpler or better adapted to the specific curriculum and students’ competence,” a key character of Biehler (Citation1997)’s “meta-tool and meta-medium.”
Moreover, besides being a stand-alone tool, that is, a “microworld” (Biehler Citation1997, p. 167), applets can be a valuable asset in the statistical tool “ecosystem” (McNamara Citation2016) as the integration of tools becomes popular. An applet (or its interactive components) can be inserted into a reproducible dynamic document (e.g., an HTML file produced by R Markdown (Allaire et al. Citation2021)) to assist students in performing data analysis and presenting results in one place (Baumer et al. Citation2014). It can also be embedded as a widget in a web-based e-learning platform with real-time interactions for teaching and learning statistics (e.g., the integrated statistics learning environment (ISLE) developed by Burckhardt, Nugent, and Genovese Citation2021). It can be expected that in the foreseeable future, we will see more development and applications of applets in teaching and learning statistics.
This article presents two new implementations of applets: (a) using real-time response data to engage students in simulations and (b) generating randomized datasets for individual students or student groups in assignments. Although the examples given in this article primarily target entry-level statistics classes, the implementations can be used in a variety of courses. The ideas can be developed into applets via any software. In this article, all applets are coded using the Shiny package in R. The webpage URLs for the applets are linked in the article and the open-source code is provided in the supplementary materials section at the end of this article.
2 Surveys and Simulations in the Classroom
A great way to engage students in introductory statistics and probability courses is to have hands-on activities such as in-class surveys and simulations in the lectures. Students become active learners when they discover interesting statistical results by participating in in-class activities and processing the real-time data generated from these activities. However, the implementation of a survey or simulation is by no means an easy task. Readers who have tried this in the past may recall funny and/or frustrating moments from their efforts. Making clear directions and keeping everyone in a room on the same page can be very challenging. The output from each student participant may fail to be in the expected format, or is frequently incomplete, undermining the revelation of statistical concepts and theorems. The time it takes to repeat steps in an activity (if repetition is required) and to collect the results from every student individually can be excessive. Conducting an activity in a web-based applet may ease these potential glitches. Two examples will be presented below. The first explains how a web-based applet carries out an in-class activity with real-time responses being efficiently collected, shared, and analyzed. The second shared activity pairs simulations and theoretical calculations, useful for a probability course. Both of them exemplify suggestions made in the technology section of the revised GAISE College Report 2016 (GAISE College Report ASA Revision Committee Citation2016, p. 21), including “implement computer-intensive methods to find p-values,” “perform simulations to illustrate abstract concepts,” and “harness the impact of interactive, real-time visualizations to engage students in the investigative process.”
2.1 Example: Passing a Quiz by Guessing
This example is designed for a traditional one-semester introductory statistics course that has no prerequisites and an average class size of about 30. The course covers descriptive statistics, basic probability, sampling distributions, confidence intervals, and hypothesis tests. Among these topics, sampling distributions are fundamental to the understanding of statistical inference such as hypothesis tests. However, it is often challenging for students due to the confusion about how a sampling distribution is formed. It is helpful to walk students through the process and guide them to create some approximated sampling distributions with specific examples so that students can use a sampling distribution that they built in one example as a reference to understand sampling distributions of other examples. Based on this motivation, the author designed an in-class activity. The procedure was as follows:
Each student is asked to independently come up with answers to an imaginary true/false quiz with 10 questions, and write them down on paper.
The instructor posts the 10 answers on the board.
Students grade their quizzes based on the given answer keys and report their grades.
The instructor records students’ grades in a dot plot on the board.
Students discover the probability of passing the quiz (the proportion of grades that are seven or higher) from the dot plot.
The activity was conducted on the first day of class when students asked about the format of the exams. They wondered if there would be any true/false or multiple-choice questions on the exams. They were amused when they found the chance of passing a true/false quiz (i.e., the proportion of scores that are 7 or above) was high even though they knew nothing about the quiz materials. Therefore, we reached an agreement that there would be no true/false questions on the exams. We solved a problem statistically on the first day of class using an approximated sampling distribution and a hypothesis test! Although they were not told about the technical names (e.g., sampling distribution, hypothesis test, p-value), it was nice to stimulate students’ interest early in the semester, and most importantly, the activity gave them a reference example later in the semester when we actually talked about the sampling distribution of sample proportions: each quiz contains a sample of 10 questions and each dot on the dot plot represent the proportion of correct answers in one sample. They can use this activity as a template to understand sampling distributions of sample proportions in other contexts in a similar way.
The first time the author tried this, the activity generally went very well. Unfortunately, there were students who did not follow the instructions carefully. Some of them did not have 10 answers ready on paper before the grading step. Others who had a full set of answers put down correct/incorrect (or even A/B/C/D as if they were guessing a multiple-choice quiz) instead of the expected true/false answers, which brought up some confusion at the grading step. In addition, it took about 20 min to complete one round of the activity, which was quite long.
Therefore, the author developed an applet (https://shiny.yuanting.lu/JSDSE-quiz/) for the activity in a later semester. The applet has a simple interface with 10 true/false questions. The self-explanatory interface makes it easier to explain the activity at the very beginning (). The limited input options in the dropdown boxes (i.e., true or false) prevent students from generating wild answers. The “Submit Quiz” button plays three roles. First, it gives a warning message and rejects a submission that does not have an answer for each question (), which eliminates the incomplete quizzes created when the activity was done on paper. Second, it grades a complete submission based on the built-in answer keys (), enabling students to get their “grades” instantaneously. Third, it writes the score of a submitted quiz to a file on the server where the applet lives, so that later the “Class Report” button can read all the quiz grades on file from the server and bring up either a nice dot plot or a histogram () when the dataset gets larger. The shape of the summary graph reveals the distribution of the quiz grades. Using the “Submit Quiz” button on the applet saved substantial time compared to asking everyone to report individual grades, as when the activity was done on paper.
Fig. 1 Screenshots of the 10-question true/false quiz applet. (a) Each question has only two choices. (b) An error message for an incomplete submission. (c) A successful submission returns a grade instantaneously and erases the submitted answers. (d) The collective result from everyone in the class.
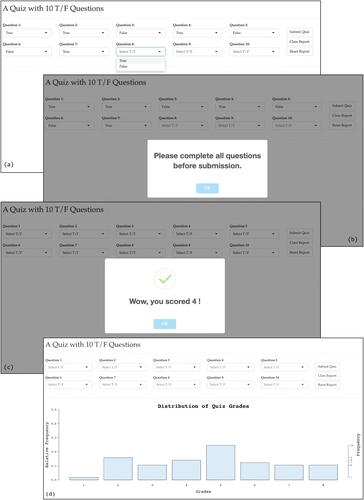
Moreover, with the applet, the activity can easily be repeated for four or five rounds to collect over 100 grades in less than 3 min, thanks to the hidden answer keys, a quick submission-grading cycle, and one additional duty of the “Submit Quiz” button, namely, once a submission goes through and a grade is reported, it clears the previous answer from each question, making a new trial independent of previous trials.
The idea of writing simulation data into a file and retrieving the data to share with the entire class suits other simulation applets as well, especially if the simulation requires a large number of independent trials. Although software can generate hundreds and thousands of simulations in a split of a second, it is more relevant and effective to let students manually conduct experiment trials to produce the simulation data in real time. First, it invites students to actively participate in a class. Students are generally more interested in getting to know their own stories hidden in the real-time response data. Also, as Nolan and Temple Lang (Citation2010) mentioned “statistics should be taught in context.” Second, conducting the trials on the applet repeatedly helps students better understand the statistical problem and how data is collected, both of which are important steps toward comprehending the statistical results. Third, the real-time data generated by students in class appears more credible to them. Therefore, letting students “slowly” run the simulations and sharing the results can be more beneficial than using software to produce data in the blink of an eye. The use of real-time data for simulations can be applied to applets in other courses as well, as illustrated in the next example.
2.2 Example: Matching Envelopes and Letters
As stated in the ASA’s 2014 Curriculum Guidelines for Undergraduate Programs in Statistical Science, “theoretical/mathematical and computational/simulation approaches are complementary, each helping to clarify understanding gained from the other” (American Statistical Association Undergraduate Guidelines Workgroup Citation2014, p. 8). When a theoretical approach is short but confusing with a counterintuitive result, a lengthy but straightforward simulation can provide insight into the problem and validate the theoretical approach. On the other hand, a simulation with interesting (and often surprising) results can stimulate students’ interest in using a theoretical approach to understand the simulation outcomes.
The idea of creating the following applet was motivated by the author’s past experience when teaching the linear properties of expected values in a one-semester probability and mathematical statistics course. The course, which has Calculus II as the prerequisite, serves computer science and mathematics majors. It has a typical enrollment of 20 students. Combinatorics and the definition of expected value were covered prior to this topic. In the lecture, students were surprised by the theoretical calculation in one textbook example (Larsen and Marx Citation2018, p. 185). The problem states that a letter should be placed into an envelope with a corresponding mailing address. Given a mix of n letters and n envelopes, on average, how many letters will be mailed to the correct addresses if we randomly put the letters into the envelopes? In the textbook, the problem was solved using the linearity of expected values. Let X be the total number of correct matches. Then , where Xi
= 1 if the ith envelope contains the correct letter and Xi
= 0 otherwise. Because each envelope has a probability of
of containing the correct letter,
. As a result, the expected value of the correct matches is
. Both
and
were quite unexpected to students. For
, intuitively, the first envelope has n letters to choose from but the last envelope has no choice, why do they have the same expected value? For
, it was hard to believe we can only match one pair on average no matter if we have 10 envelopes and letters or one million.
The textbook solution is concise but counterintuitive. Therefore, the author of this article developed an applet (https://shiny.yuanting.lu/JSDSE-envelopes/) to help students validate the result by first creating an approximated distribution of correct matches through simulation and then doing the calculation from the definition of the expected values.
shows the initial interface of the applet. To make a simple but nontrivial simulation, the value of n is set to seven in the applet. Each row represents an envelope (i.e., row one is the first envelope and row five is the fifth envelope) that contains a one-sentence letter. For convenience, let us label the one-sentence letters as A, B, C, D, E, F, and G (according to the initial alphabetic letter in each sentence). Initially, letter A is put in the first envelope, letter B in the second envelope, letter C in the third envelope, and so on. The sentences can be shuffled into an arbitrary order by drag-and-move. For example, in , letter D is in the first envelope, letter A is in the second envelope, letter C is in the third envelope, and so on.
Fig. 2 Screenshots of the Match Letters with Envelopes applet. (a) The initial interface of the applet. (b) An example of letters being manually shuffled into envelopes.
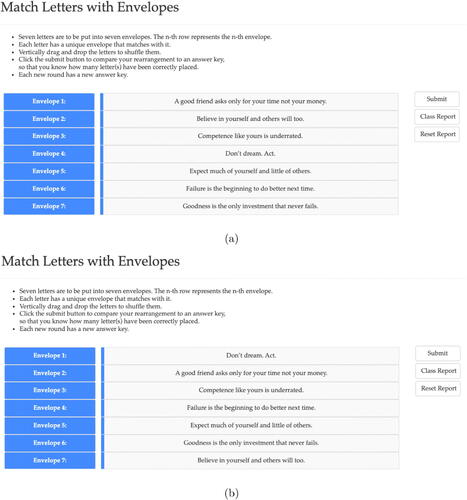
When the “Submit” button is clicked, the applet generates an answer key for the correct matches and then compares the user’s attempts with the answer key. For example, if the answer key is DACFBGE, then has only one correct match (i.e., letter C) while has five correct matches (letters D, A, C, F, and G). The answer key is randomly generated at each time of submission so that even if a user does not shuffle the letters at all, the results of multiple submissions can be different. Again, just like the true/false quiz example discussed earlier in this article, after each submission, the number of correct matches is written to a file on the server where the applet lives. Finally, clicking on the “Class Report” button displays the combined results stored in the file ().
Fig. 3 Screenshots of the simulation results on the Match Letters with Envelopes applet. (a) The distribution of the total number of correct matches. (b) The distribution of correct matches by each envelope. A horizontal dashed line is placed at the theoretical relative frequency, 1/7.
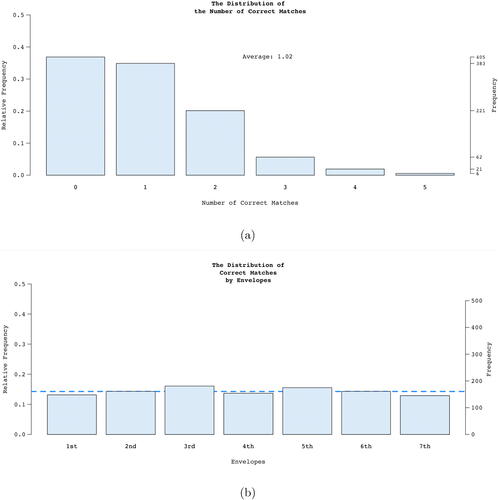
shows the distribution of the total number of correct matches. The running expected value is printed in the applet. The counts are displayed on the right margin of the panel. In this particular screenshot with a total of 1098 trials, by definition, the expected value is , which approximates the theoretical value of 1. However, most importantly, the simulation shows the shape of the distribution, providing more insight into the reasonableness of the expected value. Interestingly, students noticed that no matter how hard they tried, they could not match all seven letters with the corresponding envelopes, which triggered their curiosity to see how likely that is. The probability of matching all seven is
, roughly the same chance as getting 12 heads in a row when flipping a fair coin. In fact, this is a perfect moment to give students a challenge: urging them to find the theoretical probability distribution of the total number of matches so that they can justify the simulation result, a good exercise to polish their combinatorics skills. In addition, this is also a good opportunity to talk about the Law of Large Numbers as we increase the number of replications in the simulations.
shows that the order of the envelopes does not matter. Any envelope has an approximate relative frequency of 1/7 (the dashed horizontal line) to get a matching letter, which supports the theoretical calculation that the probability of a correct match for each envelope is (n = 7 in this example).
In this case, the interactive activity renders the statistical problem tangible. After putting their hands on the letters and envelopes through the applet for a few rounds of simulations, students can feel how hard it is to get letters to match with envelopes, which lowers their expectation for successful matches (our “arrogant” intuitions). The approximated distributions provide more insight than the neat theoretical calculations on paper. In particular, it allows students to calculate expected values from the definition, which tends to be easier for them to understand. However, using a definition for calculation is often tedious. So once students are able to verify the surprising outcome of the linearity property, they have a better chance to appreciate its elegance and have more confidence in using it in the future. Plus, drawing connections between theoretical calculations and observed simulations provides a golden opportunity to stimulate students’ interest in the course, as well as giving students valuable experience to enhance their understanding.
3 Randomized Datasets for Assignments
Online homework systems (e.g., WebAssign, MyStatLab) can generate randomized values or datasets in an assignment for each student so that different students get different datasets. The purpose is to compel students to work independently, which emphasizes understanding the statistical process rather than merely obtaining an answer. However, there are assignments for which online homework systems are not the best option, such as exams and projects, where students are expected to show detailed work. Adding the feature of randomized datasets can make student groups work independently on projects and enforce academic integrity on exams (especially if the exam is online). Without an online homework system, this feature can be achieved using applets.
shows how applets were used for an online final exam in an introductory statistics course. The final exam was administered online through Canvas, a learning management system. One of the questions on the exam asked students to analyze a random sample of 60 soda cans to determine if the filling machine works appropriately. The question is shown in . When students clicked on the link provided in the question, they were directed to the web-based applet (, https://shiny.yuanting.lu/JSDSE-exam-student/) where they entered their school ID numbers to get the randomized dataset. For small datasets, students can simply read the data table on the applet. For large datasets, they can use the download button on the applet to save the data file on their laptops and use statistical software to do the analysis. If multiple problems employ randomized datasets, each problem can be navigated through a tab on the applet. In this final exam, two questions used randomized datasets. Therefore, there were two tabs (i.e., Question 14 and Question 18) in the applet. Question 14 was a problem with a numerical variable, and the randomized dataset for this question was generated by the built-in normal distribution function in R with a mean of 12 and a standard deviation of 0.05. Both of these parameters were specified by the author and can be modified in the code as needed. Question 18 was a problem with a categorical variable, so the randomized dataset was generated by sampling with replacement from a list that consists of 20% entries from one category and 80% from another. These values can also be changed by interested instructors.
Fig. 4 Screenshots of (a) an online final exam question with a link directing students to an applet to retrieve randomized datasets, (b) the applet in which students use their school ID numbers to retrieve randomized datasets, and (c) an applet that provides reference answer keys to instructors.
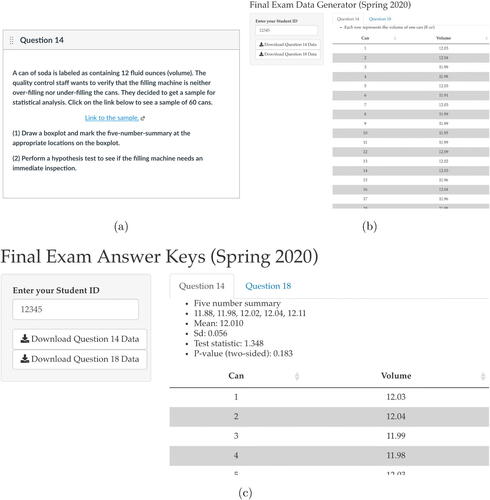
The applet uses students’ school ID numbers as the random seeds in the programming. When it comes to grading, the instructor can again use students’ school ID numbers to reproduce the datasets, and code a short program or an applet to get reference information about the dataset, which mitigates the burden in grading (, https://shiny.yuanting.lu/JSDSE-exam-instructor/). The open source code with detailed comments for both the student’s and instructor’s versions of the applets are available in the supplementary materials section for interested instructors to adopt and adapt.
There are two foreseeable reasons for a mismatch between a student’s answer and the instructor’s answer key: (a) rounding errors and (b) typing errors in a student’s school ID. First of all, the answer keys are only meant to be used as a reference for grading. It is highly unlikely that certain types of answers (e.g., test statistic and p-value) will be exactly matched. Second, in the author’s own experience, using the last four digits of student’s school ID is sufficient for the purpose of randomization and is effective for eliminating typing errors. In fact, over the last two years when this type of applet has been used on tests and final exams, there were no students reporting that their work was marked as incorrect due to a typing error in ID numbers. However, if necessary, instructors can encourage students to save a screenshot of the applet showing the digits that they have typed in so that they can dispute a typing error if it occurs. The author also asked students to write down the four digits they typed into the applet on paper next to their detailed work, which frees the author from looking up everyone’s school ID and speeds up the grading process.
4 Summary
Web-based applets are great tools for statistics and probability classes. The wide selection of interactive interface components gives users fine control over the dynamic inputs and outputs, while the computational power of applets improves the efficiency of managing repetitive tasks. Especially when it comes to in-class activities such as surveys and simulations, applets make it easy to provide step-by-step instructions for those activities, ensure uniformly formatted inputs, allow large numbers of repetitions efficiently, gather collective results instantaneously, and support all kinds of data visualization. Given that they can be freely accessed from smartphones, tablets, and laptops without the installation of particular software, they are easy to use in class.
The two examples in Section 2 illustrate the advantage of attaching a data file to an applet. Because the data file stores all the results, if everyone in a class contributes a few rounds of simulation, then there will be sufficient simulation data to approximate a theoretical distribution. This strategy worked well for the author in small classes with only 20–30 students enrolled. Although any software can easily generate tens of thousands of simulation data in seconds, using the real-time response data produced by everyone in the classroom rewards students with an increased sense of engagement. It also adds credibility to the simulation as it is carried out in person in the classroom.
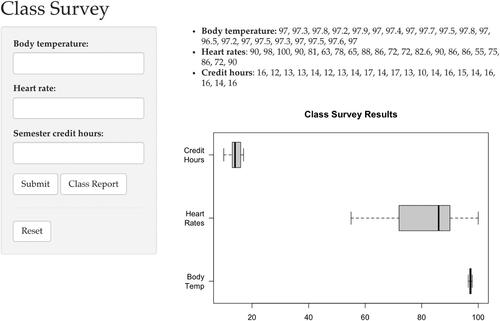
The use of applets discussed in this article can be adapted slightly for other uses, including conducting class surveys and generating datasets for student projects. For example, when introducing the concept of standard deviations, the author used an applet to collect all students’ heart rates, body temperatures, and semester credit hours attempted so that three bar graphs were displayed on the same figure to compare the spread of the datasets (). The applet is available at https://shiny.yuanting.lu/JSDSE-sd/. The open source code for the applet is available in the supplementary materials section. The advantage of using a customized applet to conduct a class survey is that an instructor can choose the forms of visualization and design the layout to achieve optimal learning outcomes.
Fig. 5 Screenshot of a survey applet that gives students a visual understanding about the standard deviation.
Similarly, the use of applets to create randomized datasets for tests and exams that is discussed in Section 3 could be applied to generate data for student projects. Although data collection is an important aspect of any statistical analysis, it can take a huge amount of time and effort for students in entry-level classes to gather reasonable datasets. Therefore, an alternative approach is to ask students to come up with data collection plans, then provide them with pseudo-datasets and let them perform the statistical analysis. In that case, assigning different project groups with different datasets pressures students to focus more on the process of statistical analysis instead of simply comparing results across groups.
No formal assessment of the effectiveness of the applets has been conducted. However, the lively class atmosphere and the positive momentum in the classroom resulting from the use of applets were easily noticed by the author. For example, the true/false quiz applet was a good icebreaker for the first day of class. Students left the first-day lecture with a lot of curiosity and expectation about the course. In the author’s experience, the example together with the applet provided students with a solid reference point. Later in the semester, when they got confused about sampling distributions or the interpretation of p-values, recalling this particular example was helpful for many students to get on the right track.
Admittedly, it does take quite a bit of time to design and develop an applet. However, this is a one-time investment. Once an applet is up and running, it can be reused for multiple semesters. If modifications are necessary, the time cost is minimal compared to the time for building the applet. Nonetheless, given applets’ great potential for making teaching more interesting and engaging, the reward is much larger than the cost.
Supplemental Material
Download Zip (36.2 KB)Acknowledgments
The author is grateful to the editor, associate editors, and reviewers for their thoughtful questions and many detailed suggestions that led to a better version of this article. The author would also like to thank his colleagues Tanya Sharon, Bobby Stecher, David Nelson, and Margaret Symington for implementing the applets in their classes, reading earlier drafts of this article, and providing valuable feedback and suggestions.
Supplementary Materials
The R code for all the applets in this article is available on Github through the link: https://github.com/yuantinglu/JSDSE-ShinyApps.
References
- Agresti, A., Franklin, C. A., and Klingenberg, B. (2021), Statistics: The Art and Science of Learning From Data (5th ed.), Harlow: Pearson.
- Allaire, J. J., Xie, Y., McPherson, J., Luraschi, J., Ushey, K., Atkins, A., Wickham, H., Cheng, J., Chang, W., and Iannone, R. (2021), rmarkdown: Dynamic Documents for R, R package version 2.10.
- American Statistical Association Undergraduate Guidelines Workgroup. (2014), 2014 Curriculum Guidelines for Undergraduate Programs in Statistical Science, Available at https://www.amstat.org/education/curriculum-guidelines-for-undergraduate-programs-in-statistical-science-.
- Baumer, B., Cetinkaya-Rundel, M., Bray, A., Loi, L., and Horton, N. J. (2014), “R Markdown: Integrating a Reproducible Analysis Tool Into Introductory Statistics,” Technology Innovations in Statistics Education, 8.
- Biehler, R. (1997), “Software for Learning and for Doing Statistics,” International Statistical Review, 65, 167–189. DOI: 10.1111/j.1751-5823.1997.tb00399.x.
- Burckhardt, P., Nugent, R., and Genovese, C. R. (2021), “Teaching Statistical Concepts and Modern Data Analysis with a Computing-Integrated Learning Environment,” Journal of Statistics and Data Science Education, 29, S61–S73.
- Chance, B., and Rossman, A. (2006), “Using Simulations to Teach and Learn Statistics, in Proceedings of the Seventh International Conference on Teaching Statistics. International Statistical Institute, the Netherlands.
- Chang, W., Cheng, J., Allaire, J., Sievert, C., Schloerke, B., Xie, Y., Allen, J., McPherson, J., Dipert, A., and Borges, B. (2021), Shiny: Web Application Framework for R, R package version 1.7.1.
- Dinov, I. D., Sanchez, J., and Christou, N. (2006), “Pedagogical Utilization and Assessment of the Statistic Online Computational Resource in Introductory Probability and Statistics Courses,” Computers & Education, 50, 284–300.
- Doi, J., Potter, G., Wong, J., Alcaraz, I., and Chi, P. (2016), “Web Application Teaching Tools for Statistics Using R and Shiny,” Technology Innovations in Statistics Education, 9(1). DOI: 10.5070/T591027492.
- Fawcett, L. (2018), “Using Interactive Shiny Applications to Facilitate Research-Informed Learning and Teaching,” Journal of Statistics Education, 26, 2–16. DOI: 10.1080/10691898.2018.1436999.
- GAISE College Report ASA Revision Committee. (2016), Guidelines for Assessment and Instruction in Statistics Education (GAISE) College Report, Available at https://www.amstat.org/education/guidelines-for-assessment-and-instruction-in-statistics-education-(gaise)-reports.
- González, J. A., López, M., Cobo, E., and Cortés, J. (2018), “Assessing Shiny Apps Through Student Feedback: Recommendations From a Qualitative Study,” Computer Applications in Engineering Education, 26, 1813–1824. DOI: 10.1002/cae.21932.
- Kunin, D., Guo, J., Devlin, T. D., and Xiang, D. (2018), Seeing Theory, Available at https://seeing-theory.brown.edu/doc/seeing-theory.pdf.
- Larsen, R. J., and Marx, M. L. (2018), An Introduction to Mathematical Statistics and Its Applications (6th ed.), p. 185, Boston: Pearson.
- Lock, R. H., Lock, P. F., Morgan, K. L., Lock, E. F., and Lock, D. F. (2021), Statistics: Unlocking the Power of Data (3rd ed.), Hoboken, NJ: Wiley.
- McNamara, A. (2016), “On the State of Computing in Statistics Education: Tools for Learning and for Doing,” arXiv no. 1610.00984.
- Morgan, K. L., Lock, R. H., Lock, P. F., Lock, E. F., and Lock, D. F. (2014), StatKey: Online Tools for Bootstrap Intervals and Randomization Tests, in Proceedings of 9th International Conference on Teaching Statistics (ICOTS-9).
- Nolan, D., and Temple Lang, D. (2010), “Computing in the Statistics Curricula,” The American Statistician, 64, 97–107. DOI: 10.1198/tast.2010.09132.
- Pearl, D. K., Hatfield, N. J., and Beckman, M. D. (2021), The Book of Apps for Statistics Teaching (BOAST), Available at https://shinyapps.science.psu.edu.
- R Core Team. (2021), R: A Language and Environment for Statistical Computing, Vienna, Austria: R Foundation for Statistical Computing.
- Wang, S. L., Zhang, A. Y., Messer, S., Wiesner, A., and Pearl, D. K. (2021), “Student-Developed Shiny Applications for Teaching Statistics,” Journal of Statistics and Data Science Education, 29, 218–227. DOI: 10.1080/26939169.2021.1995545.
- West, W., Wu, Y., and Heydt, D. (2004), “An Introduction to StatCrunch 3.0,” Journal of Statistical Software, 9. DOI: 10.18637/jss.v009.i05.
- Woodard, V., and Lee, H. (2021), “How Students Use Statistical Computing in Problem Solving,” Journal of Statistics and Data Science Education, 29, S145–S156.