 ?Mathematical formulae have been encoded as MathML and are displayed in this HTML version using MathJax in order to improve their display. Uncheck the box to turn MathJax off. This feature requires Javascript. Click on a formula to zoom.
Abstract
We present a unique and innovative course, Biostatistical Literacy, developed at the University of Minnesota. The course is aimed at public health graduate students and health sciences professionals. Its goal is to develop students’ ability to read and interpret statistical results in the medical and public health literature. The content spans the typical first-semester introductory material, including data summaries, hypothesis tests and interval estimation, and simple linear regression, as well as material typically presented in a second introductory course, including multiple linear regression, logistic regression, and time-to-event methods. The focus is on when to use a method and how to interpret the results; no statistical software computing is taught. A flipped classroom approach is used, where students are first exposed to the material outside of class, and class time is devoted to actively exploring and applying the concepts in greater depth. The course structure, the class activities, and feedback from students will be shared. Supplementary materials for this article are available online.
1 Introduction
1.1 Biostatistical Literacy
Statistical literacy is a concept that has been well-explored in the statistical education literature (e.g., Gal Citation2002). In general, statistical literacy focuses on K-12 students, undergraduates, or the general public, and refers to their ability to read and interpret the statistics used in everyday life, particularly in media reports and websites. Research-based best practices for teaching statistical literacy have been incorporated into widely used standards, such as the Guidelines for Assessment and Instruction in Statistics Education (GAISE) for college introductory statistics courses (Carver et al. Citation2016) and the Common Core State Standards for K-12 math education (National Governors Association Center for Best Practices, Council of Chief State School Officers Citation2010).
In contrast, the concept of biostatistical literacy is in a much earlier stage of exploration. In our view, biostatistical literacy focuses on medical and public health professionals and researchers and refers to their ability to read and interpret statistical results in the published literature in their field. This necessitates covering a wider range of topics than are typically covered in an introductory statistics class.
There have been several published studies exploring what medical and public health professionals need to know about biostatistics to be able to read and interpret statistical results in published articles (e.g., Emerson and Colditz Citation1983; Hellems, Gurka, and Hayden Citation2007; Switzer and Horton Citation2007; Windish, Huot, and Green Citation2007; Enders et al. Citation2017; Hayat et al. Citation2017; Oster and Enders Citation2018; Oster et al. Citation2020). These studies indicate that many of these topics extend beyond the topics that are typically covered in a one-semester introductory statistics course; moreover, an understanding of more complex statistical methods is becoming ever more necessary as the sophistication of statistical methods used in the medical and public health literature continues to increase. In 1983, a knowledge of basic statistics from t-tests up through simple linear regression enabled one to read 82% of articles published in the New England Journal of Medicine (Emerson and Colditz Citation1983), but by 2007, it was sufficient to read only 18% of the articles (Switzer and Horton Citation2007). A survey of general medical journals found that Cox regression was used in 26% of published articles, logistic regression in 22%, and multiple regression (linear, logistic or Cox) in 68% of published articles (Windish, Huot, and Green Citation2007). Similarly, a survey of the public health literature found that Cox regression was used in 15% of published articles and logistic regression in 38% (Hayat et al. Citation2017). In addition, Enders and Oster and colleagues have been developing biostatistical competencies appropriate for health sciences learners (Enders et al. Citation2017; Oster and Enders Citation2018; Oster et al. Citation2020). Many of the competencies that they deem “fundamental” are closely related to biostatistical literacy, including “Identify the strengths and limitations of study designs,”, “Understand the basic principles of …hypothesis testing …and confidence limits”, “Understand issues relating to generalizability of a study”, and “Assess sources of bias and variation in published studies” (Oster and Enders Citation2018).
There has been much less exploration of how best to teach biostatistics to these learners or of what types of approaches are currently being used.
1.2 Existing Teaching Approaches
The traditional one-semester introductory graduate biostatistics course (“Biostat 101”) often covers the same material covered in the standard introductory undergraduate statistics course (“Stat 101”), including data summaries, hypothesis tests, interval estimation, and simple linear regression, but adds material pertinent to the health sciences, such as relative risks and odds ratios, as well as more emphasis on study design and sampling methods. It typically does not focus on literacy, nor does it reach the more advanced topics (such as survival analysis) needed to read many journal articles. Several different approaches to address the need for biostatistical literacy have been used at various universities and research institutions.
One approach is to add a literacy focus to an existing introductory biostatistics course, by adding assignments or activities that involve reading and interpreting articles from the medical or public health literature. This approach has been used in the Johns Hopkins University Statistical Reasoning in Public Health course sequence (McGready and Brookmeyer Citation2013). The authors of this article have recently begun to use this approach in our two-semester introductory biostatistics course sequence as well. One limitation of this approach is that adding a literacy component takes additional time, which may require shortening the time spent on other course activities or topics. A second limitation is that two semesters are typically required to cover the topics (e.g., logistic regression, survival analysis) that are commonly found in public health and medical journal articles.
This approach can be immensely valuable, since it integrates concepts, analysis using statistical software, and interpretation of the literature. It does, however, require a huge time commitment on the part of students. For example, our two-semester introductory course sequence meets for 4 hr per week over two 15-week semesters. By the end of the sequence, students are able to carry out their own data analyses using methods as advanced as Cox regression AND are able to interpret the results from such analyses found in the published literature. However, some students are in programs that only allow or require one semester of biostatistics. Furthermore, this approach does not meet the needs of clinicians and public health professionals who will never need to analyze data in their careers. These students often feel that we are wasting their time by forcing them to learn a skill—how to carry out statistical analyses using statistical software—that they will never use.
A second approach is to teach biostatistical literacy using a short course or professional development course format. McLaughlin and Kang (Citation2017) describe a nine-hour short course offered over two weeks for incoming pharmacy doctoral (PharmD) students at the University of North Carolina. This course emphasizes conceptual understanding of basic statistical concepts as well as of linear and logistic regression. The University of Colorado’s School of Public Health offers a 14-hour short course delivered over seven weeks for researchers on the Anschutz Medical Campus entitled Fundamentals of Statistical Literacy. This course focuses on basic concepts as well as correlation and survival analysis (University of Colorado Citation2021).
Short courses are useful to bring students to the same baseline level of knowledge or to enable working professionals to add a new skill or explore a new area. They require minimal time commitment, typically a half-day, a day, an evening or several evenings, or several days. This is often much more feasible than taking a one- or two-semester course. One limitation, however, is that the short time frame doesn’t allow very many topics to be covered. An additional limitation is that it allows little time to absorb and practice the skills by actually reading numerous research articles. A third limitation of the short course approach is the lack of individual accountability: a participant could think that they understood the material during the session, and not realize that they did not until later when they tried to interpret a different article on their own.
A third approach is through journal clubs. This can be very effective for groups (e.g., medical residents) that can meet on a regular basis over an extended period of time. Some areas of medicine have created resources to help with resident journal clubs. For example, the American College of Obstetricians and Gynecologists (ACOG)’s Council on Resident Education in Obstetrics and Gynecology (CREOG) has developed a freely available journal club curriculum (ACOG Citation2021). It includes three introductory slide sets to explain basic concepts of study design, precision, power, etc., as well as an ongoing “Journal Club in a Box” series, which offers over 27 articles. Each “box” contains an article from the recent literature, a set of discussion questions, and a slide deck explaining the answers. Wegleitner and Chirino (Citation2019) have shown that use of this curriculum improves OB/GYN residents’ statistical literacy. Advantages of the journal club approach include abundant time between meetings to absorb and reflect on the material and the use of articles that are directly related to the participants’ field of expertise and interest. However, in the absence of a carefully constructed curriculum, the journal club approach will likely work well only if the residents already have some basic understanding of statistics, such as from an undergraduate class or a medical school module, and/or if there is a statistician who is knowledgeable about the relevant area of medicine who can attend to address questions. Another limitation of the journal club approach, as with the short course approach, is the lack of individual accountability.
A fourth approach is to simply rely on a past introductory statistics course, which many health science learners will have taken at some point during their training, often as undergraduates. This avoids the need for further training, but has two limitations. One is that, for medical and public health professionals, their undergraduate courses may be many years in the past and may not be fresh in their minds. More importantly, as mentioned above, an introductory statistics course will not have covered all topics essential for biostatistical literacy.
1.3 Need for an Alternative Approach
There is a substantial segment of health science learners who are not well served by any of the above approaches. While biostatistical literacy is an essential skill for all public health and medical professionals, it is not necessary for all public health and medical professionals to learn to analyze their own data. Many of these professionals will never need to do their own data analysis. This group includes clinicians and public health professionals who will not do research and just need to keep up with the literature in their field, as well as public health and medical researchers who will hire statisticians to do their data analyses. The traditional-course-plus-literacy approach described above, while immensely valuable, doesn’t work well for this specific population, since it requires them to spend a substantial amount of time learning to use software. The short course and journal club approaches can’t cover enough material to enable students to read enough of the literature, and they offer little to no opportunity for practice and instructor feedback. Finally, a past undergraduate introductory statistics class would not have covered sufficient content either.
We propose that a course-based literacy-only approach is valuable for this segment of health sciences and public health professionals. Eliminating the time spent learning to use statistical software frees up time to cover topics well beyond those usually covered in a one-semester introductory course, and the semester-long format and presence of the instructor provide extensive time for practice and instructor feedback about their understanding.
We have developed a stand-alone one-semester course, titled Biostatistical Literacy, which uses this approach. The course covers introductory statistics topics from confidence intervals and hypothesis tests through logistic regression and survival analysis, but does not include analyzing data via software. The focus is on understanding the statistical concepts and applying them to reading published articles in the medical and public health literature. In this article, we provide a detailed description of the course, and present student assessment results and student responses to the course.
2 The Biostatistical Literacy Course
2.1 Development Process
The primary goal of the Biostatistical Literacy course is to develop students’ ability to read and interpret statistical results in the primary literature of their specific scientific field of interest. The course involves minimal calculation and offers no training in any statistical software. This primary goal has guided all decisions about the course structure and content. Course development was further guided by the GAISE guidelines (Carver et al. Citation2016).
In our view, the most important aspect of the course is to have students spend extensive time reading and interpreting results from published articles (i.e., learning and practicing the skill that is the primary goal of the course). The course was therefore designed using an inverted (or flipped) classroom pedagogical approach, which allows maximum time for active learning in the classroom. In essence, a flipped classroom interchanges the active and passive parts of learning, moving the passive parts (such as lectures) outside of class and moving the active parts (such as assignments or activities) into class (Bergmann and Sams Citation2012; Mok Citation2014; Schwartz et al. Citation2016). Students prepare for class by watching prerecorded lectures and reading the textbook. Then during class, students engage with the concepts and apply them to reading published articles in a supportive environment with the instructors available to assist. The flipped classroom approach allows students to learn by practicing explaining the results to each other, and by working together to understand difficult concepts and articles (i.e., peer-assisted learning and collaborative learning; Bishop and Verleger Citation2013). In addition, the flipped classroom approach allows us to cover much more difficult topics than would be feasible in a traditional lecture-plus-homework format (Schwartz et al. Citation2016).
We used a backward-design approach (e.g., Gonzalez Citation2020) to develop the course. For each unit, we first developed the learning objectives using active verbs to describe what students should be able to do by the end of the unit. The summative assessments were then written to match the learning objectives. Next, we designed learning activities to practice those things. And lastly, we wrote the lectures and formative assessments to cover the learning objectives. (In reality, this process was iterative.)
2.2 Course Description
Biostatistical Literacy is a one-semester stand-alone graduate course with no prerequisites other than college algebra. The course is offered in two different formats, in-person or fully asynchronous online. Students can enroll in either the in-person course or the online course. The in-person course is offered in the Fall term; it meets for 1.25 hr twice a week and typically enrolls 30–40 students. The online course is offered all three terms of the year (Fall, Spring, and Summer) and typically enrolls 70–80 students in the Fall, 30–40 students in the Spring, and 60–70 students in the Summer term.
The course is designed for graduate students in public health and professionals in health science graduate and training programs, such as dentistry residents. The course covers the fundamental concepts of study design, descriptive statistics, hypothesis testing, confidence intervals, odds ratios, relative risks, linear regression, logistic regression, and survival analysis. The course intentionally covers this wide range of topics in a single 15-week semester, so that students will have the tools to read a substantial proportion of the articles in their field. The weekly schedule of topics covered is shown in .
Table 1 Biostatistical Literacy course topics by unit for a 15-week semester.
Each unit of the course follows a consistent pattern, as shown in , to help reduce student stress and cognitive load (Gray and DiLoreto Citation2016).
Fig. 1 Learn-Assess-Practice-Assess pattern of learning activities during each unit of the Biostatistical Literacy course.
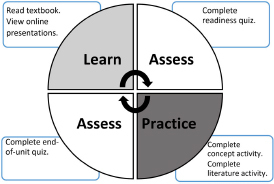
The elements of each unit are described below, using the second unit, titled Introduction to Survival Data, as an example.
2.3 Learning Objectives
The learning objectives for each unit identify what students should be able to do by the end of the unit. These are posted for students so that what is expected is transparent and explicitly stated. Students are strongly encouraged to use the learning objectives to guide their studying/learning and help them focus on the important concepts for the unit.
For example, in the second unit, Introduction to Survival Data, the learning objectives include “Be able to give examples of censored data” and “Be able to interpret a Kaplan-Meier survival curve.”
The learning objectives for the second unit can be found in the supplementary materials.
2.4 Learn: Readings and Lectures
Following the flipped classroom approach, students prepare for a unit by reading two or three short chapters from the assigned textbook, Intuitive Biostatistics: A Nonmathematical Guide to Statistical Thinking (Motulsky Citation2018), and listening to or reading two or three recorded lectures (median time: 13 min; time range: 5–30 min). The lectures are provided in two formats for accessibility purposes: as Powerpoint slides with audio voice recordings and as Powerpoint notes of the slides and the script, in PDF format. Some students prefer to watch/listen to the lectures, while others prefer to simply read the script.
2.5 Assess: Readiness Quizzes
Before students participate in the learning activities, they are expected to complete an online readiness quiz, which is a formative assessment based on the unit readings and lectures. They contain 7–18 machine-graded questions (median: 15 questions), in matching, true/false, and multiple-choice formats. The questions are aimed at the lower-order levels of Bloom’s taxonomy (Armstrong Citation2010) such as remembering and understanding, and may include definitions, matching terminology to situations, and basic interpretation of concepts. Students are allowed 60 min to complete the quiz. Students are encouraged to consult the textbook and the course materials during the quiz, which is administered outside of class through the online learning management system. The quizzes are available to students for several days at the beginning of the week. Students may take the quiz twice, and the best score is recorded; students cannot see the quiz answers until after their second attempt. As the quizzes are formative, they are weighted heavily enough to incentivize students to take them seriously, but not so heavily that students agonize excessively if they miss questions. The readiness quizzes comprise 20% of the course grade.
We strongly encourage students to work collaboratively with each other as they take the readiness quiz. We have noticed that students will often take the first attempt on their own and then complete their second attempt with a group. We believe working together on the quiz provides a natural learning opportunity because it allows students to discuss and clarify their thought processes and reasoning with each other. Thus, the quizzes are low-stakes but potentially have a high learning impact.
The readiness quiz also provides instructors with information about which definitions and concepts students are having difficulty with. This timely feedback allows them to address these immediately with clarifications or additional examples.
2.6 Practice: Learning Activities
The learning activities are the heart of the course. The purpose of the activities is to build on, solidify, and apply what students learned while they prepared for the unit. Typically, a unit will have two activities: a concept activity, where students build on and solidify the concept in the unit; and a literature activity, where students read a research article and apply what they have learned to the results presented in the article. We believe it is important to spend time on both understanding the concepts and applying them to the literature—in contrast to focusing only on the concepts and the statistical calculations (as in a typical introductory course) or to focusing only on the literature articles (as in a typical journal club).
The activities are formatted as worksheets consisting of a series of questions for students to work through together. (They are designed so students work together to answer the questions, but can also be completed individually.) They consist of roughly 25 questions and are designed to take roughly 1 hr.
Students work through the learning activities during class in small table groups of about 4–8 students. As they are doing so, the instructors wander around the classroom, answering student questions, listening for and responding to indications of misunderstandings or confusion, asking additional probing questions, and, when necessary, bringing the whole class together to address questions that are arising with multiple groups. For the online course, students work through the learning activities on their own or in small groups, in-person or virtually through Zoom or FaceTime or similar tools. They interact with the other students in the class and with the instructor by working together on a collaborative word processing document (e.g., Google Docs) to create an answer key for the learning activity. This collaborative answer key functions as an asynchronous online classroom. It allows students to interact with each other, ask questions about the activity, answer other students’ questions, comment on or question other students’ posts, and so on. It also allows the instructors to respond to student questions, watch for and address indications of misunderstandings or confusion, and ask additional probing questions. Because the learning activities are done collaboratively as a class (for both in-person and online sections), with an instructor physically present (in-person) or an active instructor presence (online), the questions on the activities can be more difficult and less scaffolded than would be the case for a homework assignment in a regular class.
2.6.1 Concept Activity
The concept activity is the first activity in each unit and is designed to clarify and deepen students’ understanding of the fundamental concepts underlying that unit’s topic.
For example, in the second unit, Introduction to Survival Data, the concept activity guides the students step-by-step through creating a Kaplan-Meier (KM) table and plot for a toy example with only seven participants. Students go through the process of creating the KM table and plot twice—once ignoring censoring, and once properly accounting for censoring—and then are asked to compare the two sets of results for the median survival, the five-year survival, and the probability of surviving longer than the last recorded time. They see firsthand how failing to properly account for censoring biases the results.
The concept activity for the second unit can be found in the supplementary materials.
2.6.2 Literature Activity
The literature activity is the second activity in each unit and is where students apply their understanding of the concepts to an article from the medical or public health literature. Each unit’s literature activity uses a different article. The articles contain results relevant to the unit’s topic (e.g., Kaplan-Meier plots for the second unit), but also contain a lot of other material (e.g., descriptive stats, other analyses), some of which are beyond the scope of the course. They are intentionally chosen to be challenging and are typically taken from top ranked journals, such as the New England Journal of Medicine, the Journal of the American Medical Association, or the Lancet.
The literature activities follow a standard format. The first section asks the students to restate in their own words the study’s primary research question and its primary finding. Subsequent sections walk students through key aspects of the methods, the results, and the discussion. There is an optional section at the end that goes beyond the topic and has students investigate the (relative) merit of the article by looking into the authors’ reputations on the subject, the presence of any conflicts of interest, and the ranking of the journal.
For example, in the second unit, Introduction to Survival Data, the literature activity guides students through a published article on the relationship between chewing xylitol gum among preschool children and survival of their primary teeth without dental caries (Anttonen et al. Citation2012). Students search the article to address questions about the study’s purpose, design, methods, and findings. They also answer detailed questions about the interpretation of specific results in the tables and figures. One question reads, “[In ] What was the effect of xylitol gum on number of decayed teeth among the subset of children who tested positive for streptococcus mutans (sm) (i.e., mean d for xylitol sm – (mean d for sucrose sm
?” Another question reads, “Look specifically at Figure 3d. Is there evidence of a difference between the xylitol-SM + group and the sucrose-SM + group here?”.
By the time students finish our course, they have read at least 15 articles from the medical and public health literature. We view this as a kind of “desensitization” process; students learn that they can indeed understand the Methods and Results sections, and gain confidence in their abilities.
The literature activity for the second unit can be found in the supplementary materials.
2.7 Assess: Summative Assessments
Two kinds of summative assessments are used in the course: quizzes at the end of each unit, and one quiz at the end of the semester.
2.7.1 End-of-Unit Quizzes
At the end of each unit, students take a summative quiz. These are intended to assess what the students have learned both from the readings and lectures and from the activities and discussions as outlined in the unit learning objectives. The end-of-unit quizzes contain 8–10 questions, all short-essay format, and typically provide results (e.g., figures, values, tables) from real articles and ask students to interpret them and explain their reasoning. During the quizzes, students are encouraged to consult the textbook and the course materials, particularly their completed activity worksheets, and any notes they may have made on lectures or other content, but they may not consult with other people. We include an “honor” question at the end of each end-of-week quiz, which asks students to state that they have completed the quiz independently. Students are allowed 120 min to complete the quiz, which is administered through the online learning management system. The quizzes are available to students for several days at the end of the week. Unlike for the readiness quizzes, students are allowed only one attempt for the end-of-unit quiz. The end-of-unit quizzes are graded by the instructors and TAs using a rubric, to ensure consistency and transparency among graders. Collectively, these quizzes are worth 40% of the course grade.
2.7.2 End-of-Semester Quiz
We do not have a traditional final exam in the literacy course. Instead, we administer a low-stakes, online end-of-semester quiz that covers the range of topics taught in the course. By having the quiz be cumulative, both students and instructors can get feedback on how well students learned the material. This quiz is worth the same as an end-of-unit quiz. The end-of-semester quiz was adapted from an assessment developed by Windish, Huot, and Green (Citation2007) to assess medical “residents’ biostatistics knowledge and interpretation of study results.” Our end-of-semester quiz contains 21 multiple-choice questions covering the range of topics that are taught in the course (). Over the years, we have revised the wording for several of the questions from that in the Windish et al. assessment to better measure the concept intended in the question.
Table 4 Mean score for each question on the end-of-semester assessment, Fall 2014–Summer 2020.
3 Results
The results described here were obtained from university registration records, scores on the end-of-semester quiz, and instructor-administered student surveys. This data was deemed exempt from IRB review.
The Biostatistical Literacy course has been well-received among both students and program directors. It has been taught in all three terms of our academic year (Fall, Spring and Summer) since its first offering in Fall 2014. Over the first six academic years it was offered, 1276 students took the Biostatistical Literacy course, which made up 44% of the students taking introductory biostatistics in our division ().
Table 2 Total enrollment by academic year (Fall, Spring, and Summer terms) for the Biostatistical Literacy course and for the first semester of the traditional introductory biostatistics course sequence.
The proportion of students who chose to take the fully asynchronous online format of the Biostatistical Literacy course ranged between 70% and 76% during the first four years it was offered, but rose to 89%–90% in the most recent two years (pre-pandemic) (). In contrast, for the traditional one-semester introductory biostatistics course, the proportion who chose to take the course online ranged between 33% and 49% during those six years. The higher proportion of literacy students who are working professionals may account for this preference for the online section.
3.1 Student Backgrounds
There is a great deal of diversity in the backgrounds of the students who take the Biostatistical Literacy course. The students come from a wide range of programs: the most common programs include the Doctor of Nursing Practice (DNP) program, the Master of Public Health (MPH) program, the Executive Public Health Administration and Policy MPH program, and several dentistry fellowship programs, with smaller numbers from medical residencies, dual-degree programs, and assorted others. We have even had occasional students who were lawyers or broadcast journalists.
The students also have a variety of levels of previous experience with statistics and mathematics, including some whose previous statistics or math courses were taken so long ago that they have been forgotten. We teach the course assuming no previous background or training in statistics and only require college algebra math as a prerequisite.
The student populations for the in-person and online sections of the course tend to differ. The online course enrolls a larger proportion of the students, and those students tend to be older, more advanced in their education level (e.g., already have at least one graduate or professional degree), and are more likely to be working full-time and to have families. About 80% of the online students are located in the Minneapolis-St. Paul metropolitan area, with the remainder spread across greater Minnesota (about 10%), the midwestern United States (about 5%), other areas of the United States (about 5%), and occasionally some from outside the United States (about 1%).
3.2 Assessment
One evaluative measure of the course is the student scores on the end-of-semester quiz, described in Section 2.7.2. For the 1221 students who completed the end-of-semester quiz between Fall 2014 and Summer 2020, the average total score was 75.1%, and was slightly higher for students in the online sections: 75.2% online versus 74.9% in-person ().
Table 3 Mean total score on the end-of-semester assessment, Fall 2014–Summer 2020.
The mean scores have remained steady over the six years (see Figure 2 in the supplementary material).
The percent of correct answers for all students on individual questions () ranged from a high of 98.6% for the question on identifying a continuous variable (Question 1) to a low of 19.7% for the question on identifying the strength of risk factors from the adjusted odds ratios (Question 20). Overall, the percent correct was above 85% for 10 of the 21 questions, between 70 and 85% for 4 questions, and below 70% for 7 questions.
3.3 Student Views
The Biostatistical Literacy course has helped students feel more comfortable reading and interpreting the published research literature in their fields. We’ve had many students comment (in person or on the mid- or end-of-semester surveys) that before this class, they would read the article’s Introduction and then skip to the Discussion section, since the Methods and Results sections were too dense and too hard to understand (e.g., “there were a lot of numbers”!). One student commented that after the course they felt much more confident when looking at the scientific literature. Another student commented that, although the class was very challenging, they felt more prepared to read articles, graphs and figures and interpret them correctly. Another noted that they now understood better how to read tables, what the values mean, and how to assess for bias. And another said they were applying these principles in their field, in life, and as they think critically about what they’re hearing from friends or in the news, and added that this class has increased their ability to ask the right questions of numbers. The most gratifying comments are those from students who tell us that for the first time, they can understand the articles they read in their journal club or their research group.
Students have also commented favorably about the flipped classroom and active learning approach. One student said they felt they learned much more by listening to lectures at home and testing knowledge with the readiness quiz, and then putting their knowledge into action by working with their peers in class on the learning activities. Another commented that completing the concept and literature activities in class was one of the most helpful aspects of the course, noting that they would never have had the patience or spent the time to do it at home. Another said they appreciated the opportunity to engage with the material in class and learned a lot because of the conversations with their classmates. One student was even “pleasantly surprised” (!) to discover that the group discussions helped solidify their understanding. Students in the in-person course have commented that the social engagement with their classmates actually made them look forward to class and helped them stay committed to attending class, while students in the online course have commented that they felt connected to their classmates despite it being an online class.
A frequent comment we hear from students is that the course is very challenging and time-consuming. However, we find that often by the end of the semester or after completing their training, students are pleased with how much they have learned and how much it has helped them in reading the literature. One former student commented that it wasn’t until she started working in her field that she realized the value of the skills she learned in the literacy course. Because of such comments, the course instructors try to be transparent and honest at the start of each semester, both about the amount of time students can expect to spend on the course and about what previous students have said about its value.
4 Discussion
The Biostatistical Literacy course has been well accepted by both students and faculty. It is one of two introductory biostatistics core course options for all MPH students in our School of Public Health. About 44% of the enrollment in introductory biostatistics courses in our division is for the Biostatistical Literacy course. We have found that, even among students who do aim to analyze their own data, a small number will take the literacy course in addition to one or both semesters of the two-semester traditional biostatistics course sequence, in order to get a thorough grounding in the statistical concepts and interpretation of the literature. Some MPH students will take the Biostatistical Literacy course first, and then take a one- or two-credit course on basic data analysis using Excel, R, or SAS in order to fulfill Council on Education for Public Health (CEPH) requirements.
We believe that the literacy-only course approach is valuable because it allows us to teach students enough in one semester to be able to read much of the literature in their field. By leaving out training in statistical software, we are able to cover material up to survival analysis and Cox regression in a single semester and focus more intensely on interpretation skills.
The flipped classroom pedagogical approach we describe has been key to enabling a one-semester literacy-only approach to work. This approach has several benefits for students. First, biostatistics is typically seen as intimidating by many public health and health sciences students. Using a flipped classroom approach allows students to work through the difficult parts of the course material during class, in a supportive environment with classmates and instructors nearby to help. In contrast, in a traditional lecture course, the students wrestle with the difficult parts outside of class, often alone at home. Second, the active learning classroom keeps students engaged, which aids their learning. Students sometimes tell us that they are reluctant to miss a class because they don’t want to let the other students in their table group down. Students’ learning is enhanced and reinforced by explaining things to (or arguing with!) their classmates. Most students tell us that they feel the active classroom is much more fun than the traditional lecture approach. Finally, students can advance further in the material, addressing more challenging topics than would ordinarily be possible, since the instructors are on hand to help.
The pedagogical approach we describe has several benefits for instructors as well. Most important of these is that the instructor is able to spend nearly 100% of classroom time engaging directly with individuals or small groups of students on questions that they have at that moment. This feels much more useful (almost like a just-in-time approach) than delivering a lecture to students who may or may not be paying much attention. This approach also finesses the issue of heterogeneity of student backgrounds: the instructor can spend a lot of time with individuals or groups who need more assistance to understand the concepts, while letting the more experienced students run ahead at their own pace. This is more difficult to do with a traditional lecture-based course; instructors typically aim their lecture material at the middle, which may bore some students and overwhelm others. The active learning approach helps bring everyone from different levels to the same place. Another advantage is that it is easy for the instructor to tell, by listening in to the various conversations at the various tables, if large proportions of the class are having difficulty with a concept. The instructor can then gather the whole class together to clarify and work through the difficult concept. Finally, for instructors as well as for students, active learning is just a lot more fun. When the day’s learning activity is going well in an active learning classroom, there is a contented buzz of students talking, discussing, and laughing.
Since developing the Biostatistical Literacy course, we have extended this work by adding a literacy component to our traditional two-semester introductory biostatistics graduate course sequence. As mentioned earlier (Section 1.2), this approach may require slightly shortening the time spent on other course activities or topics. However, we have observed anecdotally that students appreciate the literacy focus, and we find that in addition to helping them learn to read the literature in their field, it also helps them learn to interpret their own analysis results. We believe a literacy component could be a valuable addition to many biostatistics graduate courses.
Some of our Biostatistical Literacy course materials have been adopted by faculty at three other universities, either to create a literacy course of their own or to add a literacy component to an existing introductory biostatistics graduate course.
The creation of a one-semester Biostatistical Literacy course has enabled us to better address the needs of a heterogeneous population of students. The course addresses the need for biostatistical literacy training for the substantial proportion of public health and health sciences students who will never need to analyze their own data. In addition, it provides other students with sufficient grounding, practice, and feedback to feel comfortable reading the published literature in their field, regardless of whether they ultimately learn to analyze data.
Supplemental Material
Download PDF (361.8 KB)Acknowledgments
For their help in refining and improving the course, we would like to thank the other Biostatistical Literacy course instructors, Mark Fiecas, Ph.D., and Marta Shore, M.S., as well as the many graduate student teaching assistants who have assisted in the active learning classroom. We owe a huge debt of gratitude to Susan Telke, M.S., long-time biostatistics instructor, who worked with Ann to understand the need and secure the initial support for developing a biostatistical literacy course. Finally, we are forever grateful to the School of Public Health’s Office of E-Learning Services, and particularly to Jim Harpole, Kris Woll, Katy Korchik, Sara Hurley, Ph.D., and Ellyn Buchanan, Ph.D., for their excellent support of both online and hybrid courses.
Supplementary Materials
The supplementary materials include Figure 2: Mean end-of-semester assessment scores, 2014–2019 academic years, Sample Unit Materials Part A: Learning Objectives, Sample Unit Materials Part B: Concept Activity, and Sample Unit Materials Part C: Literature Activity.
References
- American College of Obstetricians and Gynecologists (ACOG) Council on Resident Education in Obstetrics and Gynecology (CREOG) (2021), “CREOG Journal Club.” Available at https://www.acog.org/education-and-events/creog/curriculum-resources/creog-journal-club.
- Anttonen, V., Halunen, I., Päkkilä, J., Larmas, M., and Tjäderhane, L. (2012), “A Practice-Based Study on the Effect of a Short Sucrose/Xylitol Exposure on Survival of Primary Teeth Caries Free,” International journal of Paediatric Dentistry, 22, 356–362. DOI: 10.1111/j.1365-263X.2011.01205.x.
- Armstrong, P. (2010), “Bloom’s Taxonomy,” Vanderbilt University Center for Teaching. Available at https://cft.vanderbilt.edu/guides-sub-pages/ blooms-taxonomy/.
- Bergmann, J., and Sams, A. (2012), Flip Your Classroom: Reach Every Student in Every Class Every Day, Washington, DC: International Society for Technology in Education.
- Bishop, J. L., and Verleger, M. A. (2013), “The Flipped Classroom: A Survey of the Research,” in Paper presented at the 120th ASEE Annual Conference & Exposition, Atlanta, Georgia. DOI: 10.18260/1-2—22585.
- Carver, R., Everson, M., Gabrosek, J., Horton, N., Lock, R., Mocko, M., Rossman, A., Holmes Roswell, G., Velleman, P., Witmer, J., and Wood, B. (2016), “Guidelines for Assessment and Instruction in Statistics Education (GAISE) College Report 2016.”
- Emerson, J. D., and Colditz, G. A. (1983), “Use of Statistical Analysis in The New England Journal of Medicine,” The New England Journal of Medicine, 309, 709–713. DOI: 10.1056/NEJM198309223091206.
- Enders, F. T., Lindsell, C. J., Welty, L. J., Benn, E. K. T., Perkins, S. M., Mayo, M. S., Rahbar, M. H., Kidwell, K. M., Thurston, S. W., Spratt, H., Grambow, S. C., Larson, J., Carter, R. E., Pollock, B. H., and Oster, R. A. (2017), “Statistical Competencies for Medical Research Learners: What is Fundamental?,” Journal of Clinical and Translational Science, 1, 146–152. DOI: 10.1017/cts.2016.31.
- Gal, I. (2002), “Adults’ Statistical Literacy: Meanings, Components, Responsibilities,” International Statistical Review, 70, 1–25. DOI: 10.1111/j.1751-5823.2002.tb00336.x.
- Gonzalez, J. (2020), “Backward Design: The Basics,” in the Cult of Pedagogy website. Available at https://www.cultofpedagogy.com/backward-design-basics/.
- Gray, J. A., and DiLoreto, M. (2016), “The Effects of Student Engagement, Student Satisfaction, and Perceived Learning in Online Learning Environments,” NCPEA International Journal of Educational Leadership Preparation, 11. Available at https://files.eric.ed.gov/fulltext/EJ1103654.pdf.
- Hayat, M. J., Powell, A., Johnson, T., and Cadwell, B. L. (2017), “Statistical Methods Used in the Public Health Literature and Implications for Training of Public Health Professionals,” PLOS One, 12, e0179032. DOI: 10.1371/journal.pone.0179032.
- Hellems, M. A., Gurka, M. J., and Hayden, G. F. (2007), “Statistical Literacy for Readers of Pediatrics: A Moving Target,” Pediatrics, 119, 1083–1088. DOI: 10.1542/peds.2006-2330.
- McGready, J., and Brookmeyer, R. (2013), “Evaluation of Student Outcomes in Online vs. Campus Biostatistics Education in a Graduate School of Public Health in 2005,” Preventive Medicine, 56, 142–144. DOI: 10.1016/j.ypmed.2012.11.020.
- McLaughlin, J. E., and Kang, I. (2017), “A Flipped Classroom Model for a Biostatistics Short Course,” Statistics Education Research Journal, 16, 441–453. DOI: 10.52041/serj.v16i2.200.
- Mok, H. N. (2014), “Teaching Tip: The Flipped Classroom,” Journal of Information Systems Education, 25, 7–11.
- Motulsky, H. (2018), Intuitive Biostatistics (4th ed.), New York: Oxford University Press.
- National Governors Association Center for Best Practices, Council of Chief State School Officers (2010), Common Core State Standards, Washington D.C.
- Oster, R. A., Devick, K. L., Thurston, S. W., Larson, J. J., Welty, L. J., Nietert, P. J., Pollock, B. H., Pomann, G.-M., Spratt, H., Lindsell, C. J., and Enders, F. T. (2020), “Learning Gaps Among Statistical Competencies for Clinical and Translational Science Learners,” Journal of Clinical and Translational Science, 5, e12. DOI: 10.1017/cts.2020.498.
- Oster, R. A., and Enders, F. T. (2018), “The Importance of Statistical Competencies for Medical Research Learners,” Journal of Statistics Education: An International Journal on the Teaching and Learning of Statistics, 26, 137–142. DOI: 10.1080/10691898.2018.1484674.
- Schwartz, T. A., Andridge, R. R., Sainani, K. L., Stangl, D. K., and Neely, M. L. (2016), “Diverse Perspectives on a Flipped Biostatistics Classroom,” Journal of Statistics Education, 24, 74–84. DOI: 10.1080/10691898.2016.1192362.
- Switzer, S. S., and Horton, N. J. (2007), “What Your Doctor Should Know About Statistics (But Perhaps Doesn’t),” CHANCE, 20, 17–21. DOI: 10.1080/09332480.2007.10722826.
- University of Colorado (2021), “Center for Innovative Design and Analysis: Biostatistics Short Courses,” Available at https://coloradosph.cuanschutz.edu/research-and-practice/centers-programs/cida/learning/biostatistics-short-courses.
- Wegleitner, E., and Chirino, O. (2019), “Join the Club: Integration of the CREOG Journal Club Curriculum Improves OBGYN Residents Statistical Literacy,” Obstetrics & Gynecology, 134, 48S. DOI: 10.1097/01.AOG.0000585552.92053.06.
- Windish, D. M., Huot, S. J., and Green, M. L. (2007), “Medicine Residents’ Understanding of the Biostatistics and Results in the Medical Literature,” JAMA, 298, 1010–1022. DOI: 10.1001/jama.298.9.1010.