Abstract
Despite rapid growth in the data science workforce, people of color, women, those with disabilities, and others remain underrepresented in, underserved by, and sometimes excluded from the field. This pattern prevents equal opportunities for individuals, while also creating products and policies that perpetuate inequality. Thus, it is critical that, as statistics and data science educators of the next generation, we center accessibility and inclusion throughout our curriculum, classroom environment, modes of assessment, course materials, and more. Though some common strategies apply across these areas, this article focuses on providing a framework for developing accessible and inclusive course materials (e.g., in-class activities, course manuals, lecture slides, etc.), with examples drawn from our experience co-writing a statistics textbook. In turn, this framework establishes a structure for holding ourselves accountable to these principles.
1 Introduction
According to LinkedIn’s U.S. Emerging Jobs Report, data scientists rank among the top emerging jobs with a 37% annual growth rate (2020). Yet the current STEM workforce, unfortunately, lacks gender and racial diversity. Though specifics vary by sector and company, statistics from two large employers are especially striking. Facebook’s Diversity Report notes that only 4.3% of technical roles are held by Hispanic employees, 1.7% by Black employees and 24.1% by women (2020). The figures are similarly low for Google’s technical roles where 0.7% are held by Black women, 1.1% by Latina women, and 0.2% by Native American women (2020). People with disabilities are also underrepresented in, and sometimes excluded from, the STEM workforce. For instance, whereas the Centers for Disease Control and Prevention estimate that 26% of U.S. adults have some type of disability (2020), only 6.1% of Google’s employees (technical and nontechnical) report having a disability.
Beyond the lack of equal opportunities for individuals in underserved or excluded groups, such a stunning lack of diversity in the STEM workforce can lead to products and policies that perpetuate bias and inequality (Noble Citation2018). For instance, statistical translation tools (e.g., Google Translate) yield male pronoun defaults more frequently (Prates et al. Citation2019). Facial recognition algorithms are much less accurate in identifying women than men, and darker-skinned people than lighter-skinned people (Raji and Buolamwini Citation2019). Autonomous vehicles fail to recognize behaviors of people with disabilities (Disability Rights UK Citation2021). After the death of a pedestrian by an autonomous vehicle while pushing her bicycle, scholars also raise concerns about the identification of people in wheelchairs (Whittaker et al. Citation2019).
The lack of diversity in the broader STEM workforce is due in part to a “leaky pipeline” (Preston Citation2004), and a good portion of this leak occurs throughout higher education. Students of color disproportionately attend community colleges and for-profit institutions as opposed to four-year institutions and thus they are not exposed to the same breadth of STEM curriculum and opportunities (Brenner et al. Citation2022). According to the American Statistical Association (ASA), only 42.9% of Bachelor’s degrees and 37.4% of Ph.D.’s in 2020, the most recent year of data collection, were earned by students that identify as women (2020). To this end, creating a healthy learning environment and departmental climate can factor into the persistence of students who identify with groups that have been underserved and excluded from STEM (Packard Citation2015). Yet, historically, the typical statistics graduate program has not provided significant training on the accessibility and inclusion principles that are critical to this goal. Further, related training provided by institutions of higher education typically (and necessarily) focus on general best practices. Thus, centering accessibility and inclusion in our statistics programs in particular requires the proactive alignment of these general practices with our training in statistics education. The goal of this article is to provide resources to that end.
A complete treatment of accessibility and inclusion in statistics education will require an ongoing series of articles and ongoing discussions—these principles must be woven throughout our departments, curricula, classrooms, assessment, and course materials. Though some of the strategies herein apply more broadly, the current article focuses on the last of these: developing a framework for accessible and inclusive course materials (e.g., in-class activities, course manuals, lecture slides, etc). We share the specific goals behind this framework, as well as the processes and tools for reaching these goals. Throughout, we draw examples from our recent collaboration and original inspiration behind this work, a Bayesian statistics textbook for undergraduates and comparably trained practitioners (Johnson et al. Citation2022). Finally, it’s important to note that the current article belongs to a growing body of work on similar topics. Among other resources, the Being Human in STEM (Citation2022) initiative provides “a framework to understand and navigate diverse identities in the classroom, lab, and beyond.” The Data Science Course Framework outlines strategies to “build, scale, and sustain policies, practices, and structures that ensure that each student has equal access to, and successfully engages in” Data Science/STEM (Launch Years Initiative Citation2021).
2 Accessibility and Inclusion Goals
As with our textbook project, we believe that the development and delivery of statistics course materials should be driven by two broad goals.
Goal 1. Course materials should be physically accessible. In general, students cannot engage with materials that they cannot access. Just as we offer online, open access to our book, we recommend using open access materials in the classroom whenever possible. The reasons are many. First and foremost, many students can’t afford physical textbooks. It is estimated that 65% of students opt out of buying a college textbook and, among those students, 94% state that they suffer academically as a consequence (U.S. PIRG Citation2014). Second, open-access materials help engage a more global audience that might be outside the range of a publisher’s physical distribution, thereby increasing the range of perspectives in statistics and data science. Yet open-access delivery is not an exhaustive accessibility wand. It should also be a priority to make course materials accessible to students with color blindness or other visual impairments.
Goal 2. The development and delivery of course materials should be inclusive of a diverse body of learners. Our students don’t all share the same gender, race, cultural, socioeconomic class, immigration status, age, sexuality, and religious identities. They have varying interests, academic experiences, learning styles, and goals. We want all students to be seen, supported, and encouraged to engage in our classes. More broadly, we want to create a sense of belonging, not only in our work together, but in the broader statistics and data science community. We follow several strategies to this end:
showcase the diversity of the field through a broad group of scholars;
use inclusive language, assumptions, and examples;
use active learning approaches that encourage students to learn by doing;
embrace the challenges and failures which are critical to learning; and
build rapport.
3 Accessibility and Inclusion Approaches
Creating more inclusive and accessible course materials simply does not happen without intention and accountability. Throughout our book writing and editing process, we developed and returned to a set of specific strategies. This same framework can be used in developing course materials for the statistics and data science classroom. We introduce these strategies here, along with tools for their implementation. Though some of the tools are based in R, the broader themes should resonate no matter your preferred software.
3.1 Increasing Accessibility
3.1.1 Open-Access Materials
For instructors developing their own open-access course manuals, textbooks, or other educational materials, a few (free!) tools can help streamline the publishing process. We recommend three tools below along with helpful resources for their implementation. Though there’s definitely a learning curve, the benefits of investing time to learn these tools extend beyond open-access educational materials—the same workflow can be used for personal websites and blogs.
For writing the materials: R Markdown allows users to seamlessly weave text, figures, R code, R output, and more into the same reproducible document. In turn, the R bookdown package (Xie Citation2021a) allows users to build longer course materials from R Markdown documents. For those who already use R Markdown, the documentation for bookdown is quite extensive (Xie Citation2016). For those who are not familiar with R Markdown, RStudio’s online tutorials provide a starting point (R Studio n.d.).
For collaboration with colleagues/coauthors: Bryan et al. (2021) is an excellent resource for learning GitHub and version control.
For deploying materials online: Hvitfeldt’s blog post (2020) provides step-by-step instructions for deploying online materials with Netlify.
3.1.2 Color Blind Accessibility
Figures and data visualizations are critical components of data analysis and communication and hence of the statistics and data science classroom. Interpreting and learning from these figures can require the distinction between multiple colors that, for example, represent different groups or models. We recommend two strategies for making such figures more accessible to students with color blindness. First, use more color blind friendly color palettes. For example, for those that use the ggplot2 package in R to create figures for their course materials, it is important to know that the default color palette is not accessible to the most common types of color blindness (e.g., red-green color blindness). Instead, we recommend the color palette suggested by Okabe and Ito (Citation2008). The palette.colors() function lists the Okabe-Ito color palette in both hex code and R form.
# Check out the color palette palette.colors(palette = ‘‘Okabe-Ito’’) ## black orange skyblue bluishgreen yellow ## ‘‘#000000’’ ‘‘#E69F00’’ ‘‘#56B4E9’’ ‘‘#009E73’’ ‘‘#F0E442’’ ## blue vermillion reddishpurple gray ## ‘‘#0072B2’’ ‘‘#D55E00’’ ‘‘#CC79A7’’ ‘‘#999999’’
When using R Markdown or bookdown to create course materials, placing the following code at the front of the document sets this as the default color palette throughout:
# Set the ggplot2 color palette palette(‘‘Okabe-Ito’’) scale_colour_discrete <- function (…) scale_colour_manual(values = palette()) scale_fill_discrete <- function (…) scale_fill_manual(values = palette())
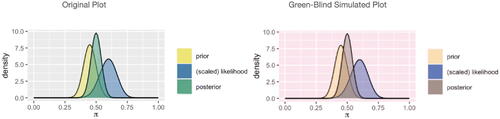
A second recommendation in making figures more color blind friendly is to test your color choices with a color blindness simulator (Colblindor Citation2021). These simulators help those that don’t have any color vision deficiencies learn how an image looks to people that do. For instance, displays an original plot that uses our color palette of choice (left) alongside a simulated version (right) of how this plot would look to someone who has green-blind color blindness, that is, deuteranopia. In this case, we learn that some people will not distinguish the colors here as “yellow,” “green,” and “blue” (thus, we shouldn’t rely on those descriptions in our discussion), yet they will view these colors as distinct.
Figure 1: A comparison of plots with original color and simulated color.
3.1.3 Screen Reader Accessibility
Teaching statistics to blind and visually impaired students comes with a set of considerations (Godfrey and Loots Citation2015). The development of course material should be mindful of students with visual impairments that rely on screen reader software that reads aloud the content on a computer screen. We highly encourage educators without vision impairments to test out a screen reader to experience how inaccessible course materials can be. In general, screen readers are effective at reading basic text and code, yet cannot automatically process another major component of the typical statistics and data science resource: figures. Unless a figure has accompanying alt (or alternative) text, it is read simply as an “image” by a screen reader. As such, alt text which describes the contents of an image for screen readers is an important supplement to figure captions and discussions which appear within the text.
As of version 1.32, the knitr (Xie Citation2021b) package behind R Markdown documents supports alt text (Hill et al. Citation2021). Footnote1 Consider the bar plot in which displays the number of artists in the Museum of Modern Art (MoMA) collection that are still living (TRUE) versus those that aren’t (FALSE). We created this figure, along with alt text, using the code below. Whereas the figure caption (fig.cap) provides a short description of the image which appears in the text and is read by screen readers, the alt text (fig.alt) is only read by screen readers. Our understanding of writing effective alt text continues to evolve. To this end, we have found the talk by Canelón and Hare (Citation2021b) and the supplementary resources in the GitHub repo (2021a) to be particularly helpful.
Figure 2: The number of living (TRUE) and nonliving (FALSE) artists in the MoMA collection.
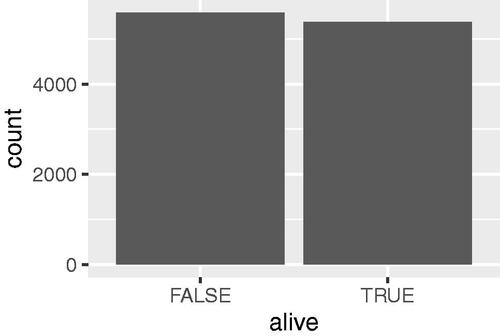
```{r, fig.cap = ‘‘The number of living (TRUE) and non-living (FALSE) artists in the MoMA collection.’’, fig.alt = ‘‘The bar plot displays the alive variable on the x-axis with FALSE and TRUE values and counts on the y-axis. Both the FALSE and TRUE categories have more than 5000 counts but the FALSE category has a slightly higher count than the TRUE category.’’} library(bayesrules) library(ggplot2) example_barplot <- ggplot(moma, aes(x = alive)) + geom_bar() example_barplot
As an alternative to writing your own alt text, resources such as the BrailleR (Godfrey et al. Citation2021) package provide automated alt text. For example, the VI() function in BrailleR automates the following alt text for .
BrailleR::VI(example_barplot) ## This is an untitled chart with no subtitle or caption. ## It has x-axis 'alive' with labels FALSE and TRUE. ## It has y-axis 'count' with labels 0, 2000 and 4000. ## The chart is a bar chart with 2 vertical bars. ## Bar 1 is centered horizontally at FALSE, and spans vertically from 0 to 5584. ## Bar 2 is centered horizontally at TRUE, and spans vertically from 0 to 5380.
Resources like BrailleR do provide an efficient approach to including alt text, and are especially appealing when developing course materials with lots of figures. Yet the current automated alt text toolbox has drawbacks. First, though it can be effective for simple plots like that in , automated alt text might not adequately summarize the nuances and themes within a figure. Second, automated alt text tools are not yet compatible with more advanced plotting options (e.g., the Markov chain trace plots within our book).
Finally, in addition to providing alt text, we recommend improving the screen reader experience by removing the hashtags in R output. By default, R displays output with double hashtags:
mean(c(2, 3, 4)) ## [1] 3
These hashtags are then read by screen readers, unnecessarily distracting from the code. When creating documents within R Markdown or bookdown, setting the global comment option to blank ("") at the start of the document removes the hashtags throughout:
knitr::opts_chunk$set(comment = "")
The result applied to our mean calculation is illustrated below:
mean(c(2, 3, 4)) [1] 3
3.2 Increasing Inclusivity
3.2.1 Showcasing the Diversity within Statistics and Data Science
One simple strategy for developing and delivering course materials that are more inclusive of students with different identities and experiences is to make them more inclusive of scholars in the fields of statistics and data science. The Data Feminism book (D’Ignazio and Klein Citation2020a) provides inspiration here. At the onset of their project, the authors outlined a set of values and aspirational metrics for holding themselves accountable to these values (D’Ignazio and Klein Citation2020b). For example, to address structural racism, the authors aspired to have at least 75% of their citations of feminist scholarship to be from people of color.
With or without numerical diversity metrics, being intentional about the scholars we cite and discuss in our course materials prevents the perpetual visibility of a narrow, homogeneous, and extensively cited group at the expense of others that are also doing groundbreaking work. For example, throughout the writing of our book, we committed to citing scholars that represent diverse fields and identities. To this end, several organizations support and highlight the work, both present and historical, of diverse communities within statistics and data science. We find the following organizations to provide particularly invaluable resources (e.g., articles, talks, and profiles) for learning more about this work ourselves and incorporating it into our classrooms: Mathematically Gifted and Black, Footnote2 the Society for Advancement of Chicanos/Hispanics and Native Americans in Science, Footnote3 the ASA Committee on Minorities in Statistics, Footnote4 the ASA Committee on Women in Statistics, Footnote5 and the ASA’s new Justice, Equity, Diversity, and Inclusion Outreach group (JEDI). Footnote6
Not only is it critical to be mindful of who we cite and highlight in our course materials, but how we cite. For example, since many publishers make it difficult for authors to correct their names after publication, trans scholars might have historical publications under their deadnames (Tanenbaum Citation2020). Further, we cannot infer a scholar’s gender identity by their name alone. As such, we recommend taking extra steps to verify that you are using the correct name and pronouns in any citation. Though this process is difficult for deceased scholars, we rely on personal websites, ORCID IDs, and social media accounts to help verify this information for living scholars. When in doubt, we use they/them pronouns.
3.2.2 Using Inclusive Language, Assumptions, and Examples
In developing and delivering course materials, our language, assumptions, and examples should be mindful of two facts: not all students share the same specialized knowledge; and, not all students share the same cultural or personal identities and lived experiences. Consider the first of these. Statistical applications often require deep, specialized knowledge (e.g., about biology, physics, sports, etc.). Assuming that all students share the same specialized knowledge is problematic for a couple of reasons. First, trying to teach a technical statistical concept through a specialized context is like trying to teach kids to read using passages about retirement plans—it’s challenging if not impossible to learn a concept when it’s delivered within a context that you don’t understand. Second, specialized settings risk alienating students which, in turn, can detract from the learning process. To this end, we recommend showcasing applications that are either fairly universal or at least have a well explained context. For example, in writing our textbook, we were considerate of the fact that we teach many international students and that we have readers outside the United States. As such, we eliminated some of our original examples which required niche knowledge about the United States (e.g., about the unique primary and caucus phase of U.S. election cycles). Though we do bring a variety of perspectives and experiences to our book and classrooms, we also acknowledge that evaluating our own work along these lines, and recognizing our own niche perspectives, is challenging.
Intentionality is also critical in developing course materials that are inclusive with respect to cultural or personal identities and lived experiences. Consider a few representative but non-exhaustive recommendations based on strategies we used throughout our book. First, in developing examples and exercises, avoid cultural stereotypes and use names that are associated with different cultures. For example, in addition to Matt and Taylor, our book’s discussions include Muhammad, Zuofu, Kimya, and Fernando. Second, be mindful of the evolving and more inclusive understanding of sexual orientation and gender identity (Phillips et al. Citation2019). For example, we employed three strategies to avoid heteronormative defaults in our book: (a) our examples span topics from same-sex marriage to LGBTQ + anti-discrimination laws; (b) we use three singular person pronouns, he/she/they, when referring to people in our examples; and (c) as recommended by Thornton et al. (Citation2019), we avoid examples and datasets that treat gender as binary.
3.2.3 Embracing Challenges and Failures
In the classroom, assumptions and statements about what should be “obvious” to our students can be both wrong and demoralizing. The same goes for the materials we use and develop for our classes. To this end, we recommend two important strategies. First, don’t just normalize, but actively embrace the mistakes and questions that are critical to learning. For example, our book explicitly states up front that: “As you read the book and put Bayesian methodology into practice, you will make mistakes. Many mistakes. Making and learning from mistakes is simply part of learning.” As another example, we note in the second chapter of the book that, no matter their level of previous experience, readers will be introduced to many new vocabulary terms and concepts, and so should expect to take this chapter slowly. When used in classroom conversations, policies, and materials, such language can help counter any impostor syndrome by normalizing the fact that humans don’t magically ingest and process information—learning takes time and iteration. Second, use language that acknowledges and welcomes students with a variety of technical or academic backgrounds. For example, in our book as in our course materials, we don’t assume that all students have seen the Greek alphabet, thus, give students a heads up on Greek letters and how to pronounce them. Similarly, in our course materials, we weave in reminders of definitions and notation from the course prerequisites.
3.2.4 Encouraging Active Learning
We don’t all learn in the same way. Active learning is one of the recommendations in Guidelines for Assessment and Instruction in Statistics Education College Report (GAISE Citation2016). Incorporating active learning approaches is critical to creating resources that are more inclusive of different learning styles. A general strategy here is to empower students to learn by doing. For example, instead of trying to deliver new concepts through large bodies of text, weave in examples that ask students to apply these concepts to real data (e.g., using code to create data visualizations, build models, etc). As another example, we include more than 50 short and informal “Quiz yourself!” opportunities throughout our textbook. Along with data examples, weaving these quizzes directly into course materials disrupts the usual reading flow, thus, encourages a more engaged review. Further, by encouraging students to tap into and generalize what they already know, quizzes provide an opportunity for critical thinking and confidence building. Finally, as critical to the iterative learning cycle, quizzes provide instant feedback on students’ understanding of core concepts.
3.2.5 Building Rapport
Our final strategy for creating inclusive course materials is to build rapport. In the classroom, rapport can be fostered through one-on-one conversations, small group activities, and other opportunities for conversation and sharing. Though building rapport through written course materials might be tougher to imagine, it’s equally important and possible. Our simple approach here is to just to be ourselves, not statistics robots. For example, our book logo is a somewhat silly disco ball, a loose analogy of the Bayesian philosophy. We use casual imagery and analogies to build intuition for technical concepts. Similarly, our discussions tend to be conversational in tone. In general, our hope is that by using informal language to bring to life formal concepts, and by sharing some of our own personalities, students feel more seen themselves.
4 Concluding Remarks
summarizes our strategies to be intentional about, and hold ourselves accountable to, our accessibility and inclusion goals. Though we originally developed these strategies for use in the writing and revision of our book, we have since used them in developing course materials for our classrooms. It is possible that someone reading our book might disagree that we met all of these criteria. With the subjective measures as well as our own personal identities and experiences, we are almost certainly missing goals without realizing it. As educators, we also expect our understanding of accessibility and inclusion to evolve as we continually seek to improve our teaching practices. This checklist will become outdated or insufficient quite soon. With this understanding, we consider the framework we’ve provided here to be a starting point for continued collaboration and conversation with other statistics and data science educators. As our understanding and practice around accessibility and inclusion evolve, we welcome any feedback on these topics through a Google Form. Footnote7
Table 1: Checklist for evaluating accessibility and inclusion of teaching materials.
Supplementary Materials
We provide the R session information used writing this manuscript.
Supplemental Material
Download Zip (79.5 KB)Notes
1 The authors requested this feature through a GitHub issue.
7 The Google Form can be found at https://bit.ly/bayesrules-feedback.
References
- American Statistical Association. (2020), “Statistics and Biostatistics Degrees Awarded, by Degree Level and Sex of Recipient: 1987–Most Recent Year, with Percent of Degrees Awarded to Females,” Available at https://www.amstat.org/docs/default-source/amstat-documents/stattable1987-current.pdf
- Being Human in STEM. (2022). Available at http://www.beinghumaninstem.com/
- Brenner, K., Beatty, A., and Alper, J. (2022), Imagining the Future of Undergraduate STEM Education: Proceedings of a Virtual Symposium, Washington, DC: The National Academies Press.
- Bryan, J., STAT 545 TAs and Hester, J. (2021), Happy Git and GitHub for the useR. Available at https://happygitwithr.com
- Canelón, S., and Hare, E. (2021a), “GitHub repo: Revealing Room for Improvement in Accessibility within a Social Media Data Visualization Community,” Available at https://github.com/spcanelon/csvConf2021. Accessed: 2021-08-12.
- Canelón, S., and Hare, E. (2021b), “Revealing Room for Improvement in Accessibility within a Social Media Data Visualization Community,” Available at https://www.youtube.com/watch?v=DxLkv2iRdf8&ab_channel=csvconf. csvconf.
- Center for Disease Control and Prevention. (2020), “Disability Impacts all of us,” Available at https://www.cdc.gov/ncbddd/disabilityandhealth/infographic-disability-impacts-all.html
- Colblindor. (2021), “Coblis — color blindness simulator,” Available at https://www.color-blindness.com/coblis-color-blindness-simulator/
- D’Ignazio, C., and Klein, L. (2020a), Data Feminism, Cambridge, MA: MIT Press.
- D’Ignazio, C., and Klein, L. (2020b), “Our Values and Our Metrics for Holding Ourselves Accountable,” Available at https://data-feminism.mitpress.mit.edu/pub/3hxh4l8o/release/1. Accessed: 2021-08-13.
- Disability Rights UK. (2021), “Self-Driving Cars Pose Threat for Disabled People,” Available at https://www.disabilityrightsuk.org/news/2021/april/self-driving-cars-pose-threat-disabled-people
- Facebook. (2020), “Facebook Diversity Report,” Available at http://precog.iiitd.edu.in/people/anupama
- GAISE. (2016), “Guidelines for Assessment and Instruction in Statistics Education (GAISE): College report,” Available at http://www.amstat.org/education/gaise
- Godfrey, A. J. R., and Loots, M. T. (2015), “Advice from Blind Teachers on How to Teach Statistics to Blind Students,” Journal of Statistics Education, 23, 1–27.
- Godfrey, A. J. R., Warren, D., Murrell, P., Bilton, T., and Sorge, V. (2021), BrailleR: Improved Access for Blind useRs.
- Google. (2020), “Google Diversity Annual Report,” Available at https://kstatic.googleusercontent.com/files/25badfc6b6d1b33f3b87372ff7545d79261520d821e6ee9a82c4ab2de42a01216be2156bc5a60ae3337ffe7176d90b8b2b3000891ac6e516a650ecebf0e3f866
- Hill, A., Dervieux, C., and Xie, Y. (2021), “New in knitr: Improved Accessibility with Image alt Text,” Available at https://blog.rstudio.com/2021/04/20/knitr-fig-alt. Accessed: 2021-08-12.
- Hvitfeldt, E. (2020), “Deploy your Bookdown Project to Netlify with GitHub Actions,” Available at https://www.emilhvitfeldt.com/post/bookdown-netlify-github-actions/. Accessed: 2021-08-12.
- Johnson, A. A., Ott, M., and Dogucu, M. (2022), Bayes Rules! An Introduction to Bayesian Modeling with R, Boca Raton, FL: Chapman and Hall/CRC. Available at https://bayesrulesbook.com
- Launch Years Initiative. (2021), “Data Science Course Framework,” Available at https://www.utdanacenter.org/sites/default/files/2021-05/data_science_course_framework_2021_final.pdf
- LinkedIn. (2020), “Emerging Jobs Report,” Available at https://business.linkedin.com/content/dam/me/business/en-us/talent-solutions/emerging-jobs-report/Emerging_Jobs_Report_U.S._FINAL.pdf
- Noble, S. U. (2018), Algorithms of Oppression: How Search Engines Reinforce Racism, New York: New York University Press.
- Okabe, M., and Ito, K. (2008), “Color Universal Design (cud) - How to Make Figures and Presentations that are Friendly to Colorblind People -’,” Available at https://jfly.uni-koeln.de/color/
- Packard, B. W.-L. (2015), Successful STEM Mentoring Initiatives for Underrepresented Students: A Research-based Guide for Faculty and Administrators, Sterling, VA: Stylus Publishing, LLC.
- Phillips, G., Beach, L. B., Turner, B., Feinstein, B. A., Marro, R., Philbin, M. M., Salamanca, P., Felt, D., and Birkett, M. (2019), “Sexual Identity and Behavior among US High School Students, 2005–2015,” Archives of Sexual Behavior, 48, 1463–1479. DOI: 10.1007/s10508-019-1404-y.
- Prates, M. O., Avelar, P. H., and Lamb, L. C. (2019), “Assessing Gender Bias in Machine Translation: A Case Study with Google Translate,” Neural Computing and Applications, 32, 6363–6381.
- Preston, A. E. (2004), “Plugging the Leaks in the Scientific Workforce,” Issues in Science and Technology, 20, 69–74.
- R Studio. (n.d.), “R Markdown from RStudio,” Available at https://rmarkdown.rstudio.com/lesson-1.html. Accessed: 2021-08-12.
- Raji, I. D., and Buolamwini, J. (2019), “Actionable Auditing: Investigating the Impact of Publicly Naming Biased Performance Results of Commercial AI Products,” in Proceedings of the 2019 AAAI/ACM Conference on AI, Ethics, and Society, pp. 429–435.
- Tanenbaum, T. J. (2020), “Publishers: Let Transgender Scholars Correct their Names,” Nature, 583, 493–494. DOI: 10.1038/d41586-020-02145-3.
- Thornton, S., Green, B., and Benn, E. (2019), “Friends and Allies: LGBT + Inclusion in Statistics and Data Science,” Significance, 16, 39–41.
- U.S. PIRG. (2014), “Survey Shows Students Opting Out of Buying High-Cost Textbooks,” Available at https://uspirg.org/news/usp/survey-shows-students-opting-out-buying-high-cost-textbooks
- Whittaker, M., Alper, M., Bennett, C. L., Hendren, S., Kaziunas, L., Mills, M., Morris, M. R., Rankin, J., Rogers, E., Salas, M., and West, S. M. (2019), “Disability, Bias, and AI,” AI Now Institute, November.
- Xie, Y. (2016), bookdown: Authoring Books and Technical Documents with R Markdown, Boca Raton, FL: Chapman and Hall/CRC. Available at https://bookdown.org/yihui/bookdown
- Xie, Y. (2021), bookdown: Authoring Books and Technical Documents with R Markdown. R package version 0.22. Available at https://github.com/rstudio/bookdown
- Xie, Y. (2021b), knitr: A General-Purpose Package for Dynamic Report Generation in R. R package version 1.33. Available at https://yihui.org/knitr/