Abstract
Self-efficacy is associated with a range of educational outcomes, including science and math degree attainment. Project-based statistics courses have the potential to increase students’ math self-efficacy because projects may represent a mastery experience, but students enter courses with preexisting math self-efficacy. This study explored associations between pre-course math confidence and coding confidence with post-course statistical intentions and perceived achievement among students in a project-based statistics course at 28 private and public colleges and universities between fall 2018 and winter 2020 (n = 801) using multilevel mixed-effects multivariate linear regression within multiply imputed data with a cross-validation approach (testing n = 508 at 20 colleges/universities). We found that pre-course coding confidence was associated with, respectively, 9 points greater post-course statistical intentions and 10 points greater perceived achievement on a scale 0–100 (0.09, 95% confidence interval (0.02, 0.17), p = 0.02; 0.10, 95% CI (0.01, 0.19), p = 0.04), and that minoritized students have greater post-course statistical intentions than nonminoritized students. These results concur with past research showing the potential effectiveness of the project-based approach for increasing the interest of minoritized students in statistics. Pre-course interventions to increase coding confidence such as pre-college coding experiences may improve students’ post-course motivations and perceived achievement in a project-based course. Supplementary materials for this article are available online.
1 Introduction
Self-efficacy, an individual’s belief that they can accomplish a task despite challenges (Bandura Citation1977), is associated with a broad range of higher education outcomes including achievement (Honicke and Broadbent Citation2016). Self-efficacy is a stronger predictor of educational outcomes than self-concept or motivation (Zimmerman Citation2000) and is also predictive of science, technology, engineering, and math (STEM) degree attainment among first-generation college students (Bettencourt et al. Citation2020). Low-efficacy students may believe that quantitative abilities are innate or acquired in early life, so these students may feel like their efforts will not improve their outcomes, leading to low morale and counterproductive behavior (Claro, Paunesku, and Dweck Citation2016).
Past studies have suggested that low statistics self-efficacy is a barrier to the successful completion of statistics courses (Gal and Ginsburg Citation1994; Gal, Ginsburg, and Shau Citation1997; Finney and Schraw Citation2003). The introductory statistics course can be a particular barrier for many students because students have negative feelings about the course and gain few skills from it (Gal and Ginsburg Citation1994; Slootmaeckers, Kerremans, and Adriaensen Citation2014). Attrition from introductory statistics is a particular concern because populations under-represented in quantitative fields, such as under-represented minorities (URM) and low socioeconomic status (SES) students are more likely to leave these fields by leaving college (Chen Citation2013). The revised Guidelines for Assessment and Instruction in Statistics Education (GAISE) College Report (Carver et al. Citation2016), Nolan and Temple Lang (Citation2010), and others propose that statistics students master a wide array of computational tools at all levels of undergraduate statistics education to remedy these problems (Nolan and Temple Lang Citation2010; Carver et al. Citation2016). This study explores whether pre-course self-efficacy predicts students’ interest in advanced statistical coursework and perceived achievement after taking a multidisciplinary, project-based introductory statistics course aimed at engaging students in applied statistical projects across both divisional and departmental boundaries (Dierker et al. Citation2012).
1.1 Project-Based Statistics Curriculum
Bandura and colleagues (1977) hypothesized that self-efficacy arises from performance accomplishments, vicarious experience, verbal persuasion, and emotional arousal, but performance accomplishments are believed to be the most reliable source of self-efficacy; this component is also most relevant to project-based statistics. A project-based statistics curriculum provides the opportunity for an “enactive mastery experience” that can increase students’ statistical self-efficacy and perceived achievement (Parsons, Croft, and Harrison Citation2011).
A project-based statistics course offers students the opportunity to increase students’ self-efficacy by posing a challenge and supporting students in completing the challenge. Ideally, introductory statistics courses encourage students to continue taking further statistics courses, especially students who previously had no intention to pursue statistics beyond required courses. However, students’ level of pre-course quantitative self-efficacies may affect how students regard their achievement during the class and predict their likelihood of pursuing future statistical coursework. This research evaluates to what extent students’ interest in pursuing further courses in statistics after taking a project-based statistics course is associated with their pre-course self-efficacy.
In a project-based course, students choose their research project, requiring them to think critically about statistical issues (Chance Citation2002; Nolan and Temple Lang Citation2010), recognize the usefulness of data for answering questions of interest to them and to society (Neumann, Hood, and Neumann Citation2013; Horton and Hardin Citation2015), tackle complicated real-world questions that involve more than one or two variables (De Veaux Citation2015), and emphasize practical problem-solving skills that are necessary to answer statistical questions (Garfield, delMas, and Zieffler Citation2012). The project-based statistics course emphasizes conceptual understanding and application.
Introductory statistics courses have used project-based approaches even with large classes (Halvorsen Citation2010). Several studies suggest that across many fields, project-based learning promotes students’ problem solving and reasoning skills, application of knowledge to solve problems, and communication skills more than traditional didactic approaches, such as solving problems isolated from their research context on traditional problem sets (Hickey et al. Citation1999; Hickey, Wolfe, and Kindfield Citation2000; Langer Citation2001; Harada and Yoshina Citation2004; Lynch et al. Citation2005). Students who finish a project have a work product that they can describe at job interviews, put in a portfolio, or present at research conferences to demonstrate their skills. Performance accomplishments are hypothesized to increase self-efficacy and self-confidence beliefs as an individual’s demonstration of mastery (Bandura Citation1977, Citation1986, Citation1990), so we would expect that students’ independent research projects would increase their self-efficacy. A student who completes a project successfully will be more likely to believe in their ability to complete more complex future projects, so they would have higher math self-efficacy. Math self-efficacy would lead the student to be more likely to be interested in taking additional quantitative coursework, majoring in quantitative fields, and attaining a STEM degree (Bettencourt et al. Citation2020).
We organized this project-based statistics course to focus on the decisions and skills involved in statistical inquiry. Funded by the U.S. National Science Foundation and first introduced into the curriculum at a selective liberal arts college, the project-based course follows each of the recommendations of the revised GAISE college report (Aliaga et al. Citation2005; ASA 2014; Carver et al. Citation2016) and the undergraduate data science education recommendations of the National Academies of Sciences, Engineering, and Medicine to increase the use of real-world data applications (National Academies Citation2018). Students learn to manage data, describe data with plots and numerical summaries, and inferential methods to test hypotheses and explore the empirical structure of data (Cobb Citation2007; Gould Citation2010; Horton Citation2015). Students are provided with opportunities to select the most appropriate tools to address their research question(s) and apply the methods using statistical software (e.g., R, SAS, Stata, SPSS). Statistical topics are introduced alongside the development of the research project, so each statistical topic is immediately applied to the student’s research project in addition to standard textbook problems.
Evaluations of the project-based course at the originating liberal arts college suggest that this course attracts more students from populations who are under-represented in statistics to statistics compared to a traditional introductory statistics course (Dierker et al. Citation2015). Although under-represented minority (URM) students reported perceiving the material in the project-based course as more difficult than non-URM students did and scored lower on average on three multiple-choice in-class exams, URM students were twice as likely as non-URM students to report that their interest in conducting research increased after completing the project-based course, and they demonstrated similar levels of increased confidence in applied skills and interest in follow up courses (Dierker et al. Citation2016).
Students completing the project-based course reported more confidence in concrete statistical skills (choosing the correct statistical test, managing data, and writing syntax or code to run statistical analyses) and interest in pursuing advanced statistics coursework than students enrolled in a traditional introductory statistics course (Dierker et al. Citation2018). The project-based statistics course also attracts students with a wider range of math SAT scores (mean (M) = 686, standard deviation (sd) = 69) than traditional introductory statistics (M = 696, sd = 59) (Dierker et al. Citation2015).
Statistical analysis uses several skills of computer programming, such as creating variables, commenting code, debugging code, and managing complex projects (Bentley Citation1985). Faculty support students as they make decisions about how to visualize, explore, and analyze data, and explain their statistical decisions and results orally and in writing, including commenting statistical code. Faculty also support students when the students encounter software errors, so students learn to identify the typographical mistakes or logical errors that cause statistical commands not to function. Because of a focus on programming in the context of data analysis, we have previously compared the project-based course with traditional introductory programming experiences. Compared with traditional introductory programming courses (a general programming course and a computer science major introductory course), the project-based statistics course attracts more female and URM students (Cooper and Dierker Citation2017). Students in the project-based statistics course had a wider range of math SAT scores (M = 685, sd = 69) than students in introductory programming courses (M = 722, sd = 58) and computer science gateway courses (M = 739, sd = 55) (Cooper and Dierker Citation2017).
Project-based courses offer potentially great gains for students’ self-efficacy because projects are performance accomplishments. However, students enter project-based statistics courses with preexisting levels of quantitative self-efficacy. Students with high quantitative self-efficacy see themselves as capable of difficult quantitative material and may be more likely to take courses that challenge and expand their quantitative skills, whereas students who have lower quantitative self-efficacy may not attempt challenging quantitative courses. Greater self-efficacies in mathematics and statistics are associated with greater educational gains and better performance in mathematics and statistics courses (Zimmerman Citation2000; Perepicska, Chandler, and Becerra 2011; Peters et al. Citation2019). To some extent, self-efficacy is circular: students may increase in quantitative self-efficacy as they attempt challenges and complete the challenges, thus adding to their performance accomplishments, whereas students who never attempt challenges do not have as many opportunities to increase their quantitative self-efficacy through performance accomplishments (Kung Citation2009; Peters et al. Citation2017).
Students who complete semester-long statistics projects have created knowledge corresponding to real-world applications of statistics; this type of performance accomplishment may increase students’ self-efficacy. However, students enter a project-based statistics course with existing endowments of math and coding self-efficacy that may modify the course’s outcomes. This study will explore whether pre-course math self-efficacy and coding self-efficacy predict students’ post-course statistical intentions and perceived achievement among students enrolled in project-based statistics courses.
2 Methods
This study explores the association between post-course statistical intentions and perceived achievement and pre-course coding and math confidence in a sample of 801 students attending 28 colleges and universities in the United States. Across these heterogeneous settings, this project-based statistics course constitutes a coherent curriculum due to a shared approach to the semester-long projects, shared materials, communication between instructors, and shared help resources available to students. For the projects, instructors start with real-world data sets, students choose their research questions, course material supports students in answering their research questions, and the final product is a research article or poster in the model of a course-based undergraduate research experience (CURE). The instructors also have access to common materials: a 39-page electronic textbook with code samples, professionally produced instructional videos demonstrating statistical skills in SAS, R, Stata, SPSS, and Python (one video playlist for each statistical programming language or software), and a repository of datasets, quiz questions, and sample exams. Instructors also communicate together to share ideas and resources including datasets and handouts at an annual webinar and through popular business communication software. All students can post on a business communication platform for student questions, and instructors at other universities answer students’ questions. Students also have access to weekly evening office hours by teaching staff at the originating liberal arts college.
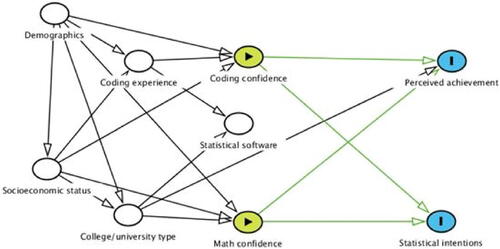
shows the hypothesized relationships between variables. This study explores whether this project-based course’s effectiveness in increasing students’ statistical intentions and perceived achievement is lower among students with less math and coding confidence. We compare students enrolled in this course to each other, rather than evaluating the project-based curriculum by comparing students in this course to students in another course, as done previously (Dierker et al. Citation2017, Citation2018). The outcome measures are aggregate measures of statistical intentions and perceived achievement, as described in the measures subsection.
Fig. 1 Conceptual model. White nodes are control variables determined prior to the course. Green nodes are the exposure variables: coding confidence and math confidence. Blue nodes are outcome variables: perceived achievement and statistical intentions.
2.1 Sample
Students in project-based statistics courses completed computer-administered surveys during the first and last week of the semester, which took about 10–15 min each. Data were drawn from pre-course and post-course surveys administered to students enrolled in an introductory, project-based statistics or research methods course (Dierker et al. Citation2012). This project-based introductory statistics course was taught in 28 courses at 28 universities in the United States (n = 801) between fall 2018 and winter 2020: 11 private liberal arts colleges, 3 flagship state universities, 12 regional city or state universities, and 2 community colleges (). These data include courses from departments other than statistics or mathematics, such as sociology, epidemiology, and psychology; course titles are listed in Appendix 2 (supplementary materials).
Table 1 Enrollment by semester: number of sections, courses, students, and range of number of students per section.
In addition to the 28 US colleges and universities, the course was also taught at a nonprofit private small college in Ghana (n = 116). This college chose not to ask citizenship, race, and ethnicity questions in their survey administration due to cultural sensitivities (Appiah and Adeyeye Citation2020; Erasmus Kofi Appiah, personal communication, November 5, 2021), so these data were not included in this analysis. The outcomes of the implementation of this course in Ghana during prior years have been described elsewhere (Awuah, Gallagher, and Dierker Citation2020).
The course was created in the Department of Psychology at Wesleyan University in Middletown, Connecticut, United States, a private liberal arts college that offered different sections of the project-based introductory course that taught the course in one of three statistics software, so students chose their section based on instructor and schedule: R (51% of students), Stata (21% of students), or SAS (29% of students). Two regional universities taught in R one semester and SPSS another semester. The remaining academic settings used only one statistical software per course. The statistics software included StatCrunch, a web-based statistics software developed by Pearson Education (one community college); SPSS (two private liberal arts colleges, one flagship public university, and eight regional universities); R (two flagship public universities, four regional universities, three liberal arts colleges, and one community college); and SAS (seven liberal arts colleges).
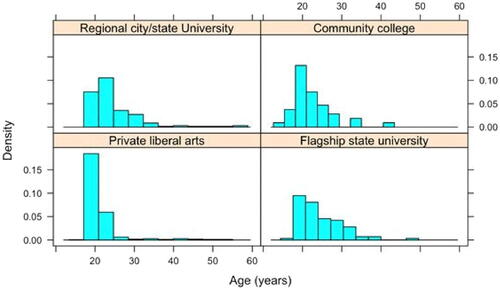
Because interest in taking further quantitative courses is one outcome, an earlier year in school signifies the potential to take more quantitative courses. The full sample comprised less than 1% high school students, 9% first-year undergraduates, 40% second-year, 21% third-year, 19% fourth-year, 8% graduate students, and 2% “other” status, which could include nonmatriculated certificate students. Students at the private liberal arts colleges (interquartile range (IQR) 19, 21 years old) were on average younger with lower variation in age than the students at the flagship state universities (IQR (20, 28)), regional state and city universities (IQR 20, 27), and community colleges (IQR 19, 24) ().
Fig. 2 Distribution of student ages stratified by school type.
These data were designated exempt per 45 CFR 46.104(d)(2) as research that only involves the use of educational tests, surveys, interviews, or observations of public behavior by Wesleyan University’s Institutional Review Board (Project ID 20190701).
2.2 Measures
2.2.1 Outcome Variables
The outcome variables were post-course perceived achievement and statistical intentions. The perceived achievement construct was an existing scale, the Undergraduate Research Student Self-Assessment: Student Assessment of Learning Gains (URSSA-SALG) (Hunter et al. Citation2009).
2.2.2 Perceived Achievement
We defined post-course perceived achievement as the sum of 28 items from three URSSA-SALG subscales with the same Likert-scale answers: thinking and working like a scientist, personal gains from research work, and gains in skills. These items were combined because all areas of potential gain were preceded by a single prompt “How much did you gain in the following areas as a result of your experiences in this course?” and the same 5-point Likert scale ranging from no gains to great gain (Hunter et al. Citation2009.) We used confirmatory factor analysis for a single factor using the principal-factor method without rotation. Although the scale had 31 items, we omitted three items because the topics were not relevant for some students’ fields of study: “Keeping a detailed lab notebook” (loading 0.68), “Conducting observations in the lab or field” (loading 0.70), “Calibrating instruments needed for measurement” (loading 0.66). The remaining 28 items in the perceived achievement factor loaded onto a single factor in the exploratory factor analysis (Table S1), which was normalized to the unit interval (Cronbach’s coefficient alpha = 0.97) (CitationTaber 2018).
2.2.3 Statistical Intentions
The construct of statistical intentions was the sum of 13 Likert scale items (Cronbach’s coefficient alpha = 0.92) normalized to the unit interval including example items “Are you interested in pursuing advanced coursework in statistics or data analysis?” and “In the field in which you hope to be employed when you finish school, how much do you hope to use statistics?” (Table S2).
Table 2 Descriptive statistics of participants and association with pre-course coding and math confidence (n = 801).
Statistical Intentions: Exploratory Factor Analysis
We performed an exploratory factor analysis to create the statistical intentions factor because the items that related to statistical intentions subjectively by face validity were not a prior scale: some items were used in previous research evaluating statistics courses (Wise Citation1985; Schau et al. Citation1995; Gasiewski et al. Citation2012) and some items were original to the project. Beginning with 23 items that concerned motivation to continue in statistics, we identified 13 items with all pairwise correlations exceeding 0.3 in the initial dataset from fall 2018, winter 2019, spring 2019, and summer 2019 (n = 291) (Figure S1).
Using these 13 items, we performed a principal factor analysis with maximum likelihood and determined that these 13 items comprised 1 factor by Kaiser’s rule to retain factors with eigenvalues greater than 1 (Kaiser Citation1960). All items loaded with 0.6 or above in each factor, which gives reliable results in exploratory factor analysis in multiply imputed data using predictive mean matching with small sample sizes (McNeish Citation2017).
As a further analysis, we identified the same 13-item factor using a multiple likelihood principal factor analysis with the 23 items with the oblimin rotation; the scree criterion identified three factors (Rosseel Citation2012), but we discarded two factors because loadings were less than 0.5. When the larger dataset from fall 2019 and winter 2020 (n = 624) became available, we performed confirmatory factor analysis (Knekta, Runyon, and Eddy Citation2019; Revelle Citation2021). The loadings from these factor analyses are in Table S2. We did not modify these constructs after analysis to avoid false significance due to multiple comparisons.
2.2.4 Exposure Variables
Math self-efficacy was measured by the question “How good are you at mathematics?” an item from Looking at the Survey of Attitudes Toward Statistics (Bond Citation2007). Coding self-efficacy was measured as self-confidence for learning programming, agreement with the statement “I have a lot of self-confidence when it comes to learning programming.” from the Adapted Computer Science Attitude Survey (Wiebe et al. Citation2003). Both predictors were scored on a 5-item Likert scale. The Likert scale versions were used in the multivariate analysis. For bivariate analysis, math confidence and coding confidence were dichotomized with positive answers (“very good” and “good”; “strongly agree” and “agree”) versus neutral or negative answers. The single-item measure of mathematical confidence is associated with broader multi-dimensional measures of self-efficacy (Parsons, Croft, and Harrison Citation2011). The dichotomous versions of the math and coding confidence variables allowed the display of pre-course variables associated with high versus low confidence more clearly than the 5-level variable would allow.
2.2.5 Control Variables
The control variables were potential confounding variables between math confidence and coding confidence and perceived achievement, based on past research: demographics (race/ethnicity, gender, year in school), socioeconomic status (first-generation college status, free/reduced lunch status during secondary school), and prior experience with coding and statistical packages.
Demographics included race/ethnicity, male versus nonmale gender, and year in school. Year in school was coded as high school student; first, second, third, and fourth-year undergraduate; graduate or medical student; and other. Race affects student educational outcomes primarily through the effects of racism. One of many mechanisms for the effect of race on educational outcomes is stereotype threat theory, which posits that students from marginalized groups have lower academic performance when negative stereotypes are made salient to them through even subtle cues (Steele and Aronson Citation1995; Spencer, Steele, and Quinn Citation1999). Students reported their race/ethnicity in response to the question “What is your ethnicity or racial background? If you are multiple races, mark all that apply.” with the following possible answers: Hispanic or Latino/Latina; Black, African, African-American, West Indian, or Afro-Latino/Latina; Asian, Southeast Asian, or Middle Eastern; White or Caucasian; Native Hawaiian or Pacific Islander; American Indian or Alaskan Native; Prefer not to answer; Other (please specify). Race/ethnicity was categorized as Black for students who reported Black, African, African American, West Indian, or Afro-Latino/Latina identity. The race/ethnicity variable used in the regression analyses was under-represented minority status, which was coded as 1 for students reporting Black, Hispanic, American Indian, or Native Hawaiian or Pacific Islander race/ethnicity and 0 for others. The dichotomous gender measure is limited by not permitting analysis of differential effects for gender minorities.
Socioeconomic status (SES) was measured by two variables: parents’ educational attainment (i.e., first-generation college status) and free/reduced-price lunch. Students from lower SES backgrounds are likely to have more educational disadvantage on average, and thus have lower math and coding confidence and have lower statistical intentions and perceived achievement (Niu Citation2017).
First course in statistics was a binary variable coded as 1 for respondents who reported that this course was their first course in statistics and 0 for respondents who had taken general statistics in high school, advanced placement, or international baccalaureate statistics in high school, or another statistics course in college. We classified project-based course statistics software as text-based (command-driven) (Stata, SAS, and R) or graphical user interface (menu-driven) (SPSS, StatCrunch).
2.2.6 Missing Data
The multi-item statistical intentions and perceived achievement outcome variables were missing, respectively, for 72 and 239 observations out of 801. Missing data occurred because students selected “not applicable” to at least one of the component items, but they answered other items. It was not feasible to construct the multi-item outcome variables with only items answered by all students or different numbers of questions for each student. Using complete cases risked inducing bias because missingness was not completely at random. We concluded that the students likely chose “not applicable” because their course did not cover the topic or because the topic isn’t relevant to their major (e.g., “Taking greater care in conducting procedures in the lab or field”). We believe that the missing data are missing at random because missingness is related to observed information, such as the student’s institution and year in school, and we address missingness using multiple imputation. Imputations for “not applicable” are the predicted answers that the students would have given under the counterfactual that they had given a valid answer. Some students may have chosen “not applicable” due to self-presentation bias: rather than reporting a negative response that they did not gain in that domain or do not intend further statistics courses, they chose “not applicable,” so the data would be missing not at random because missingness is related to the unobserved data, so it could not be imputed. However, negative responses of no or little gain or intention to take further statistics were common in these self-administered surveys, suggesting many students had low self-presentation bias, so it seems most likely that most missing data are missing at random. Other variables with missing observations were programming confidence (24 cases), math self-efficacy (22 cases), age in years (28 cases), and student’s year in school (1 case). However, we note that missingness at random is an assumption that cannot be definitively tested.
We used multiple imputation with 35 imputations, following the guideline that the number of imputations should exceed the percent of all data with at least one variable missing. We used a multivariate normal imputation model with the following: demographics (gender, year in school, Hispanic, Black, Asian/Southeast Asian/Middle Eastern, white race/ethnicity); socioeconomic status (first-generation, free/reduced lunch in high school); first course in statistics; and school type. We judged that the multiple imputation model was appropriate for the outcomes of statistical intentions (missing 72 observations) and perceived achievement (missing 239) using visual inspection of kernel density plots and the Kolmogorov-Smirnov test (Abayomi, Gelman, and Levy Citation2008; Eddings and Marchenko Citation2012).
2.3 Statistical Analysis
Our statistical analysis used a cross-validation approach, enabled by a delay in full data availability. We formulated all statistical models in the data from fall 2018-summer 2019 (n = 291) and then repeated the models in the fall 2019 and winter 2020 data (n = 508, 20 groups) once these data became available.
For bivariate analysis, we used the Wilcoxon rank-sum test and Cuzick’s test for trend because the continuous variables had nonsymmetric distributions. Cuzick’s test for trend is a generalization of the Wilcoxon rank-sum test to test for differences in a continuous variable across ordered categorical variables. We identified a set of items from the survey that were theoretically important; these items appear in . We identified possible confounders with bivariate analysis using chi-square tests; we did not correct for multiple comparisons because the goal was to identify the most important potential confounders for further analysis.
For multivariate analysis in the multiply imputed data, we used multi-level mixed-effects linear regression with maximum likelihood, clustered by academic setting (Gelman and Hill Citation2007). The outcomes were statistical intentions and perceived achievement, and the primary predictors were pre-course coding self-efficacy and mathematical self-efficacy. We checked the conditions of linear regression by visual inspection of plots of residuals versus fitted values and quantile-quantile plots comparing the residuals with the quantiles of the normal distribution.
Models were formulated using individual and contextual factors from theories of self-efficacy and using Gelman and Hill’s criteria for inclusion of covariates (Gelman and Hill Citation2007). We included theoretically important nonsignificant control variables if inclusion does not change the direction of the main effect (Gelman and Hill Citation2007). The control variables chosen from the analysis of the fall 2018-summer 2019 data were demographics (three variables: male gender, age in years, and under-represented minority vs. not), socioeconomic status (two variables: free/reduced lunch and first-generation college student), first statistics course indicator, and an indicator variable for whether the course used text-based statistical programs (R, Stata, or SAS) vs. graphical user interface statistical programs (SPSS or Statcrunch). Past research suggests that confidence impacts under-represented minorities and females disproportionately, but terms for effect modification by gender and URM status were not significant in the presence of the other variables.
To combine the results from the multiply imputed datasets, the regression coefficients were the mean of the regression coefficients from each imputed dataset. The standard errors for regression coefficients from the multiply imputed datasets were derived from the three sources of variance: within-imputation, between-imputation, and the between imputation divided by the number of imputations. We estimated Cohen’s f2 measure of effect size in the mixed model from the residual variances (Selya et al. Citation2012).
3 Results
3.1 Math and Coding Confidence
Among these project-based statistics students, 45% reported high math confidence and only 19% reported high coding confidence before taking the course. Although coding confidence is more common among students with math confidence than without math confidence (32% versus 9%, p < 0.001), most students with math confidence lack coding confidence. Likewise, 38% of students reported coding experience, but only 34% of students with coding experience reported high coding confidence. Although coding confidence is more common among students with coding experience than without coding experience (34% vs. 11%, p < 0.001), most students with prior coding experience lack coding confidence.
The following pre-course variables were positively associated with coding confidence: male gender (50% of confident re male vs. 33% of nonconfident, p < 0.001); age over 22 years (32% of confident are over 22 vs. 20% of nonconfident, p = 0.002); Hispanic ethnicity (23% vs. 15%, p = 0.02); status as a nongraduate and nonundergraduate student (5% vs. 1%, p = 0.01); taking a course using R (61% vs. 52%, p = 0.03); taking a compressed winter course (all at liberal arts college) (5% vs. 1%, p = 0.006); past AP (24% vs. 15%, p = 0.01) or past college statistics courses (49% vs. 37%, p = 0.006); and coding experience with R (20% vs. 6%, p < 0.001), Stata (11% vs. 3%, p < 0.001), SAS (5% vs. 1%, p = 0.001), HTML (14% vs. 3%, p < 0.001), Java (18% vs. 4%, p < 0.001), Matlab (12% vs. 4%, p < 0.001), and Python (36% vs. 8%, p < 0.001) (). Variables negatively associated with coding confidence include being traditional college age (17–22) (68% of confident vs. 80% of nonconfident, p = 0.002); being a second-year undergraduate (27% of confident vs. 35% of nonconfident, p = 0.05); attending a regional university (21% vs. 25%, p = 0.002); taking a course using SPSS (5% vs. 12%, p = 0.009) or Stata (2% vs. 6%, p = 0.05); and no previous statistics course (29% vs. 40%, p = 0.009) ().
Pre-course variables positively associated with math confidence include male gender (43% vs. 14%, p = 0.001); being a fourth-year undergraduate (26% vs. 18%, p = 0.01); taking a course using R (58% vs. 50%, p = 0.03); AP statistics (24% vs. 12%, p < 0.001) or college statistics (45% vs. 36%, p = 0.01); and coding experience with R (16% vs. 5%, p < 0.001), Stata (8% vs. 1%, p < 0.001), SAS (3% vs. 1%, p = 0.05), HTML (8% vs. 3%, p = 0.001), Java (13% vs. 3%, p < 0.001), Matlab (9% vs. 3%, p < 0.001), and Python (24% vs. 6%, p < 0.001) (). Variables negatively associated with math confidence include being a second-year undergraduate (29% of confident vs. 37% of nonconfident, p = 0.03), attending community college (3% vs. 7%, p = 0.02), taking a course using SPSS (5% vs. 14%, p < 0.001), and no previous statistics course (32% vs. 43%, p = 0.002) ().
The association between confidence and course statistical software suggests that students with higher average coding or math confidence may self-select into project-based statistics courses/sections that use the R statistical software, that instructors who anticipate that their students have greater coding and math confidence may be more likely to choose R, and/or instructors who anticipate low coding confidence may be more likely to choose statistical software with more menu functionality, such as SPSS. Students who took prior statistics courses may have higher average coding or math confidence as a result, or they selected into prior statistics courses because of earlier coding or math confidence.
3.2 Statistical Intentions and Perceived Achievement
Statistical intentions and perceived achievement appear to be associated with pre-course coding and math confidence, as illustrated in a kernel plot (). Students with pre-course coding confidence reported post-course statistical intentions and post-course perceived achievement that are on average, respectively, 9 points and 10 points higher on a 0–100 scale (0.09, 95% confidence interval (0.02, 0.17), p = 0.02, f2 = 0.027; 0.10, 95% CI (0.01, 0.19), p = 0.04, f2 = 0.024), controlling for demographics, socioeconomic status, and prior courses in statistics (, ). The association between pre-course coding confidence and post-course statistical intentions and perceived achievement are small but nonnegligible effects according to Cohen’s measure of local effect size f2. Male and minoritized students reported higher post-course statistical intentions, and older students reported lower post-course perceived achievement. (, ).
Fig. 3 Kernel plot of statistical intentions and perceived achievement gains after the course, stratified by coding confidence and math confidence (n = 801).
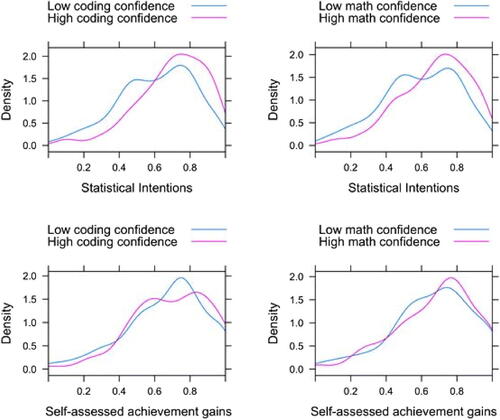
Fig. 4 Multilevel linear regression with outcomes statistical intentions and perceived achievement, normalized to 1, limited to students in the United States in the replication sample from fall 2019 and winter (January) 2020 (n = 508, 20 groups).
Note: The model was formulated in the prior data and applied to these data. These data were multiply imputed with 35 imputations. Minoritized status included students who reported any of the following identities: Black, Hispanic, American Indian or Alaskan Native, or Native Hawaiian or Pacific Islander. These data were designated exempt per 45 CFR 46.104(d)(2) as research that only involves the use of educational tests, surveys, interviews, or observations of public behavior by Wesleyan University’s Institutional Review Board (Project ID 20190701).
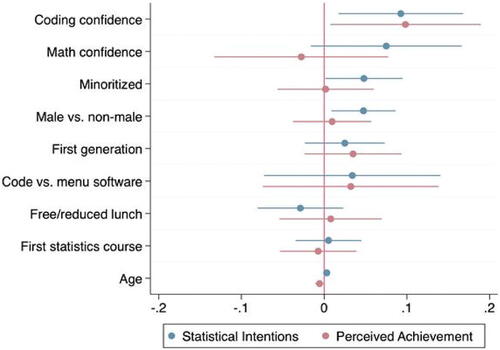
Table 3 Multilevel linear regression with outcomes statistical intentions and perceived achievement, normalized to 1, limited to the testing dataset from Fall 2019 and Winter 2020 (n = 508, 20 groups).
3.3 Evaluation of Potential Effect Modification by Gender and URM Status
We tested for effect modification by gender and underrepresented minority (URM) status in eight separate models: two outcomes (perceived achievement and statistical intentions) by two predictors (math confidence and coding confidence) by two potential effect modifiers (gender and under-represented minority status). We could not reject the null hypothesis that there was no effect modification by under-represented minority status or gender.
4 Discussion
This study of a project-based introductory statistics course finds that pre-course coding confidence is associated with higher statistical intentions and greater perceived achievement, but pre-course math confidence is not associated with statistical intentions or perceived achievements. Students enter a project-based statistics course with levels of coding confidence that were formed over the students’ lifetimes. In this class, male students entered the class with higher average coding confidence. This confidence is associated with subsequent achievement, and achievement is associated with subsequent confidence (Bandura Citation1990; Kung Citation2009). For low confidence, the cycle requires interruption. Statistics students may benefit from brief interventions to improve students’ coding self-efficacy, such as engaging in values affirmation and increasing the salience of students’ past successes (Siegle and McCoach Citation2007; Peters et al. Citation2017).
Minoritized students in the course reported greater average post-course statistical intentions than nonminoritized students. These findings are encouraging for the project-based statistics model and concur with past findings that the project-based course is accessible to students who are under-represented in statistics (Dierker et al. Citation2015, Citation2016). Pre-course coding confidence had a modest effect on statistical intentions and perceived achievement, as the 95% confidence intervals were close to the null value of no outcome difference between confident and not confident. Pre-course math confidence was not associated with statistical intentions and perceived achievement.
4.1 Nontraditional Undergraduates
We would expect older, nontraditional students to tend to have lower confidence based on past research in math education (Hendy, Schorschinsky, and Wade Citation2014; Jameson and Fusco Citation2014) and employment outcome disparities (Purcell, Wilton, and Elias, Citation2007). However, greater coding confidence was more common in nontraditional undergraduate students in bivariate analysis and each year of age is associated with greater predicted post-course statistical intentions in the regression analysis. This protective effect of age may be due to greater coding experience, and the older students have had more experiences with coding through employment or past educational experiences. Older college students are more likely to be taking courses for instrumental reasons such as job advancement, so they may be implicitly engaging in values affirmation to improve their persistence in the course in the face of obstacles, which improves quantitative self-efficacy (Peters et al. Citation2017). Second, “life experience and common sense” improves statistics abilities in ways that are orthogonal to students’ mathematical abilities (DeVeaux and Velleman Citation2008), so pursuing statistics may be more appealing to older students than to younger students in these courses.
4.2 Students’ Statistical Intentions Are Feasible
One goal of a project-based statistics course is for all students to increase their self-efficacy and interest in taking advanced courses. We have previously demonstrated that the project-based model yields a greater interest in pursuing advanced coursework than traditional statistics courses (Dierker et al. Citation2018). Half of the students taking this class were second-year undergraduates or earlier, so they still had time during their undergraduate education to take more advanced statistics courses and choose quantitative majors; however, year in school did not predict either statistical intentions or perceived achievement, suggesting that students did not answer these questions with regard to the feasibility of implementing their intentions within their current degree program.
4.3 Statistical Software Choice
Prior experience with code-based statistical and mathematical software (R, SAS, Stata, Matlab) was associated with pre-course coding confidence, but prior experience with SPSS was not associated with pre-course coding confidence. However, students who used code-based statistical software (R, SAS, and Stata vs. SPSS and StatCrunch) in the project-based course did not have greater statistical intentions or perceived achievement. Project-based statistics instructors seem to adapt their project-based courses to students’ pre-course coding and math self-efficacy: students with lower pre-course coding and pre-course math self-efficacy were more likely to enroll in courses using SPSS, which may have a less steep learning curve because it is menu-driven. Stata can be used with either code or a graphical user interface; although students with pre-course experience with Stata reported greater pre-course coding and math confidence, students with lower pre-course coding confidence were more likely to enroll in courses using Stata. Instructors appeared to choose their course’s statistical software by correctly anticipating their students’ pre-course coding self-efficacy.
4.4 Strengths and Limitations
4.4.1 Statistical Strengths and Limitations
We addressed the potential for false significance due to multiple comparisons by identifying factors using exploratory factor analysis, formulating the analysis, and performing the full analysis of the data between fall 2018 and summer 2019 (n = 291). We then implemented the model with minimal changes in new, previously unavailable data from fall 2019 and winter 2020 (n = 508). The only changes between the model building and model implementation stages were to correct oversights (omitting a socioeconomic control variable from the multivariate model and bivariate analysis of previous coding experience) and evaluate potential effect modification.
Because a randomized experiment could not assign people to different levels of confidence, no causal inference would be possible even with the most rigorous statistical design, following Paul Holland’s dictum (Citation1986) that causation requires even potential manipulation. However, this study did not attempt to model the assignment mechanism to math and coding confidence, or match on important factors using a propensity matching method because of the lack of temporal ordering: for instance, higher math or coding confidence likely contributed to many variables examined in the bivariate analysis, such as decisions to take statistics during high school or college, or decisions to learn programming languages before taking the project-based statistics.
The project-based framework was designed for a first course in statistics for undergraduates in a selective liberal arts college. In these data, this curriculum was used in a variety of settings, including advanced statistics courses or research methods courses for psychology, sociology, or public health, as well as high schools (see list of course names in Appendix 2, supplementary materials). We have not defined measures of intervention fidelity or collected data from instructors to assess fidelity. However, the shared materials, communication platform for instructors, and communications platform for students at all universities to ask questions of instructors at all universities unify these courses.
This study could not evaluate either whether the specific statistical software (e.g., R, SAS, SPSS, Stata, or StatCrunch) or text-based versus graphical user interface statistics software predicted greater perceived achievement or higher statistical intentions because of the endogeneity of statistical software choice. We have seen that students may have self-selected into courses according to their level of coding confidence and instructors at institutions with lower average coding confidence chose graphical user interface statistics software, correctly anticipating their students’ level of coding confidence.
As with any curriculum using computation, this project-based curriculum requires that students can access statistical software on computers, in cloud-based statistical software platforms, or in university computer labs where a campus instructional technology department has installed statistical software. Instructors must also have access to computers with statistical software installed for in-class demonstrations. However, students in multiple types of institutions have been able to access computational resources to complete their projects.
We addressed missing data using multiple imputation to address missing data and portray variability in the missing data. Multiple imputation assumes that data are missing at random, which we believe is the most likely explanation for the pattern of missing data.
4.4.2 Survey Limitations
This survey was written originally for full-time traditional-age college students who are not employed in full-time jobs, so the survey does not ask about labor market status, whether the job is on a career path in a quantitative field, and whether the curriculum helps students in their current job. Questions about employment ask about future employment intentions, but some students may have current employment in which they aim to advance. This study also used a single-item measure for math confidence, not a multi-item measure for statistical or mathematical self-efficacy (Finney and Schraw Citation2003). However, the single-item math confidence measure is associated with multi-item self-efficacy measures (Parsons, Croft, and Harrison Citation2011) and with achievement.
The survey did not ask students to report their grades in their statistics course or any other academic course, and the survey results were not linked to students’ academic records, so we do not have any objective measure of students’ achievement in the course. Even in the absence of objective measures of students’ achievement, improving students’ willingness to take further quantitative courses represents meaningful progress toward improving racial and gender diversity in quantitative fields, based on earlier research finding that this course attracts more under-represented students than traditional statistics courses (Dierker et al. Citation2015).
5 Conclusions
Project-based statistics courses have great potential to improve students’ statistics self-efficacy because the project is a performance accomplishment. This research reveals a confidence disparity in gains from this project-based course. Students who begin the course with greater coding confidence gain more statistical intentions and have greater perceived achievements. This research finds that minoritized students have greater gains in statistical intentions, which concurs with past research that suggests that the course attracts under-represented students who may not otherwise take statistics courses and improves their interest in further statistics courses. Experiments can evaluate whether students in project-based statistics courses may benefit from using explicit confidence-building exercises at the beginning of the course.
Supplementary Materials
In this supplement we provide results from the confirmatory factor analysis for the Undergraduate Research Student Self-Assessment: Student Assessment of Learning Gains scale; the correlation analysis and exploratory factor analysis for the statistical intentions scale; and a list of titles of courses implementing the project-based curriculum.
Ethical Standard Statement
These data were designated exempt per 45 CFR 46.104(d)(2) as research that only involves the use of educational tests, surveys, interviews, or observations of public behavior by Wesleyan University’s Institutional Review Board (Project ID 20190701).
Supplemental Material
Download Zip (701.2 KB)Disclosure Statement
The authors report no potential conflicts of interest.
References
- Abayomi, K., Gelman, A., and Levy, M. (2008), “Diagnostics for Multivariate Imputations,” Journal of the Royal Statistical Society, Series C, 57, 273–291. DOI: 10.1111/j.1467-9876.2007.00613.x.
- Aliaga, M., Cuff, C., Garfield, J., Lock, R., Utts, J., and Witmer, J. (2005), “Guidelines for Assessment and Instruction in Statistics Education (GAISE): College Report,” American Statistical Association. Available at http://it.stlawu.edu/∼rlock/gaise/.
- American Statistical Association Undergraduate Guidelines Workgroup (2014), 2014 Curriculum Guidelines for Undergraduate Programs in Statistical Science, Alexandria, VA: American Statistical Association. Available at https://www.amstat.org/education/curriculum-guidelines-for-undergraduate-programs-in-statistical-science-.
- Appiah, E. K., and Adeyeye, O. P. (2020), “Importance of Managing Language within the Socio-Cultural Context of Ghana: Diversity and Inclusion Perspective,” International Journal of Community Diversity, 20, 11–23. DOI: 10.18848/2327-0004/CGP/v20i01/11-23.
- Awuah, R., Gallagher, K. M., and Dierker, L. C. (2020), “Taking Project-Based Statistics Abroad: Learning Experiences and Outcomes of a Project-based Statistics Course in West Africa,” Statistics Education Research Journal, 19, 18–31. DOI: 10.52041/serj.v19i3.54.
- Bandura, A. (1977), “Self-Efficacy: Toward a Unifying Theory of Behavior Change,” Psychological Review, 84, 191–251. DOI: 10.1037//0033-295x.84.2.191.
- Bandura, A. (1986), Social Foundations of Thought and Action: A Social-Cognitive Theory, Englewood, NJ: Prentice-Hall.
- Bandura, A. (1990), “Perceived Self-efficacy in the Exercise of Personal Agency,” Journal of Applied Sport Psychology, 2, 128–163.
- Bentley, J. (1985), “Programming Pearls: Bumper-Sticker Computer Science,” Communications of the Association of Computing Machinery, 28, 896–901. DOI: 10.1145/4284.315122.
- Bettencourt, G., Manly, C. A., Kimball, E., and Wells, R. (2020), “STEM Degree Completion and First-Generation College Students. A Cumulative Disadvantage Approach to the Outcomes Gap,” Review of Higher Education, 35, 753–779. Available at https://scholarworks.umass.edu/cfssr_publishedwork/35. DOI: 10.1353/rhe.2020.0006.
- Bond, M. E. (2007), “Looking at the Survey of Attitudes Toward Statistics (SATS[copyright]) [Measurement instrument],” Breakout Session at the Meeting of the United States Conference on Teaching Statistics (USCOTS), Columbus, OH.
- Carver, R., Everson, M., Gabrosek, J., Horton, N., Lock, R., Mocko, M., Rossman, A., Holmes Rowell, G., Velleman, P., Witmer, J., and Wood, B. (2016), GAISE College Report ASA Revision Committee, “Revised Guidelines for Assessment and Instruction in Statistics Education College Report 2016.” Available at https://www.amstat.org/asa/files/pdfs/GAISE/GaiseCollege_Full.pdf.
- Chance, B. L. (2002), “Components of Statistical Thinking and Implications for Instruction and Assessment,” Journal of Statistics Education, 10. Available at DOI: 10.1080/10691898.2002.11910677.
- Chen, X. (2013), STEM Attrition: College Students’ Paths into and out of STEM Fields (NCES 2014-001), Washington, DC: National Center for Education Statistics, Institute of Education Sciences, U.S. Department of Education. Available at https://nces.ed.gov/pubs2014/2014001rev.pdf.
- Claro, S., Paunesku, D., and Dweck, C. S. (2016), “Growth Mindset Tempers the Effects of Poverty on Academic Achievement,” Proceedings of the National Academy of Sciences, 113, 8664. DOI: 10.1073/pnas.1608207113.
- Cobb, G. W. (2007), “The Introductory Statistics Course: A Ptolemaic Curriculum?,” Technology Innovations in Statistics Education, 1. DOI: 10.5070/T511000028.
- Cooper, J., and Dierker, L. (2017), “Increasing Exposure to Programming: A Comparison of Demographic Characteristics of Students Enrolled in Introductory Computer Science Programming Courses Versus a Multidisciplinary Data Analysis Course,” International Research in Higher Education, 2, 92–100. DOI: 10.5430/irhe.v2n1p92.
- De Veaux, R. (2015), “What’s wrong with Stat 101?” Presentation given at the United States Conference on Teaching Statistics (USCOTS). Available at https://www.causeweb.org/cause/sites/default/files/uscots/uscots15/presentations/DickOpening.pptx.
- De Veaux, R. D., and Velleman, P. F. (2008), “Math is Music; Statistics is Literature: Why are There no 6-year-old Novelists?,” Amstat News, September, 54–58. Available at http://www.statlit.org/pdf/2008-DeVeaux-Velleman-Math-vs-Statistics.pdf.
- Dierker L, Kaparakis E, Rose J, Selya A, Beveridge D. (2012), “Strength in Numbers: A multidisciplinary, project-based approach to introductory statistics education,” Journal of Effective Teaching, 12(2), 4–14.
- Dierker, L., Cooper, J., Selya, A., Alexander, J., and Rose, J. (2015), “Evaluating Access: Comparing Enrollment Patterns in Traditional Versus Multidisciplinary, Project-based Introductory Statistics Courses,” Journal of Interdisciplinary Studies in Education, 4, 22–37.
- Dierker, L., Alexander, J., Cooper, J. L., Selya, A., Rose, J., and Dasgupta, N. (2016), “Engaging Diverse Students in Statistical Inquiry: A Comparison of Learning Experiences and Outcomes of Under-Represented and Non-Underrepresented Students Enrolled in a Multidisciplinary Project-Based Statistics Course,” International Journal for the Scholarship of Teaching and Learning, 10. DOI: 10.20429/ijsotl.2016.100102.
- Dierker, L., Ward, N., Alexander, J., and Donate, E. (2017), “Engaging Underrepresented High School Students in Data-driven Storytelling: An Examination of Learning Experiences and Outcomes for a Cohort of Rising Seniors Enrolled in the Gaining Early Awareness and Readiness for Undergraduate Program (GEAR UP),” Journal of Education and Training Studies, 5, 54–63. DOI: 10.11114/jets.v5i4.2187.
- Dierker, L., Flaming, K., Cooper, J., Singer-Freeman, K., Germano, K., and Rose, J. (2018), “Evaluating Impact: A Comparison of Learning Experiences and Outcomes of Students Completing a Traditional Versus Multidisciplinary, Project-based Introductory Statistics Course,” International Journal of Education, Training and Learning, 2, 16–28. DOI: 10.33094/6.2017.2018.21.16.28.
- Eddings, W., and Marchenko, Y. (2012), “Diagnostics for Multiple Imputation in Stata,” Stata Journal, 12, 353–367. DOI: 10.1177/1536867X1201200301.
- Finney, S. J., and Schraw, G. (2003), “Self-Efficacy Beliefs in College Statistics Courses,” Contemporary Educational Psychology, 28, 161–186. DOI: 10.1016/S0361-476X(02)00015-2.
- Gal, I., and Ginsburg, L. (1994), “The Role of Beliefs and Attitudes in Learning Statistics: Towards an Assessment Framework,” Journal of Statistics Education, 2, 3. DOI: 10.1080/10691898.1994.11910471.
- Gal, I., Ginsburg, L., and Schau, C. (1997), “Monitoring Attitudes and Beliefs in Statistics Education,” in The Assessment Challenge in Statistics Education, eds. I. Gal and J. B. Garfield, Amsterdam: IOS Press, pp. 37–51.
- Garfield, J., delMas, R., and Zieffler, A. (2012), “Developing Statistical Modelers and Thinkers in an Introductory, Tertiary-level Statistics Course,” ZDM: The International Journal on Mathematics Education, 44, 883–898. DOI: 10.1007/s11858-012-0447-5.
- Gasiewski, J. A., Eagan, M. K., Garcia, G. A., Hurtado, S., and Chang, M. J. (2012), “From Gatekeeping to Engagement: A Multicontextual, Mixed Method Study of Student Academic Engagement in Introductory STEM Courses,” Research in Higher Education, 53, 229–261. DOI: 10.1007/s11162-011-9247-y.
- Gelman, A. and Hill, J. (2007), Data Analysis Using Regression and Multilevel/Hierarchical Models. Cambridge.
- Gould, R. (2010), “Statistics and the Modern Student,” International Statistical Review, 78, 297–315. DOI: 10.1111/j.1751-5823.2010.00117.x.
- Halvorsen, K. T. (2010), “Formulating Statistical Questions and Implementing Statistics Projects in an Introductory Applied Statistics Course,” 8th Annual Conference on Teaching Statistics, Invited Paper. July 11–16. Available at https://icots.info/icots/8/cd/pdfs/invited/ICOTS8_4G3_HALVORSEN.pdf.
- Harada, V. H., and Yoshina, J. M. (2004), “Moving from Rote to Inquiry: Creating Learning that Counts,” Library Media Connection, 23, 22–24.
- Hendy, H. M., Schorschinsky, N., and Wade, B. (2014), “Measurement of Math Beliefs and Their Associations with Math Behaviors in College Students,” Psychological Assessment, 26, 1225–1234. DOI: 10.1037/a0037688.
- Hickey, D. T., Kindfield, A. C. H., Horwitz, P., and Christie, M. A. (1999), “Advancing Educational Theory by Enhancing Practice in a Technology-supported Genetics Learning Environment,” Journal of Education, 181, 25–55.
- Hickey, D. T., Wolfe, E. W., and Kindfield, A. C. H. (2000), “Assessing learning in a technology-supported genetics environment: Evidential and consequential validity issues,” Educational Assessment, 6, 155–196. DOI: 10.1207/S15326977EA0603_1.
- Holland, P. (1986), “Statistics and Causal Inference,” Journal of the American Statistical Association, 81, 945–960. DOI: 10.1080/01621459.1986.10478354.
- Honicke, T., and Broadbent, J. (2016), “The Influence of Academic Self-Efficacy on Academic Performance: A Systematic Review,” Educational Research Review, 17, 63–84. DOI: 10.1016/j.edurev.2015.11.002.
- Horton, N. J. (2015), “Challenges and Opportunities for Statistics and Statistics Education: Looking Back, Looking Forward,” The American Statistician, 69, 138–145. DOI: 10.1080/00031305.2015.1032435.
- Horton, N. J., and Hardin, J. S. (2015), “Teaching the Next Generation of Statistics Students to ‘Think with Data:’ Special Issue on Statistics and the Undergraduate Curriculum,” The American Statistician, 69, 259–265. DOI: 10.1080/00031305.2015.1094283.
- Hunter, A. B., Weston, T. J., Laursen, S. L., and Thiry, H. (2009), “URSSA: Evaluating Student Gains from Undergraduate Research in Science Education,” Council on Undergraduate Research Quarterly, 29, 15–19.
- Jameson, M. M., and Fusco, B. R. (2014), “Math Anxiety, Math Self-concept, and Math Self-Efficacy in Adult Learners Compared to Traditional Undergraduate Students,” Adult Education Quarterly, 64, 306–322. DOI: 10.1177/0741713614541461.
- Kaiser, H. F. (1960), “The Application of Electronic Computers to Factor Analysis,” Educational and Psychological Measurement, 20, 141–151. DOI: 10.1177/001316446002000116.
- Knekta, E., Runyon, C., and Eddy, S. (2019), “One Size Doesn’t Fit All: Using Factor Analysis to Gather Validity Evidence When Using Surveys in Your Research,” CBE life sciences education, 18(1), rm1. DOI: 10.1187/cbe.18-04-0064.
- Kung, H. Y. (2009), “Perception or Confidence? Self-Concept, Self-Efficacy and Achievement in Mathematics: A Longitudinal Study,” Policy Futures in Education, 7, 387–398. DOI: 10.2304/pfie.2009.7.4.387.
- Langer, J. A. (2001), “Beating the Odds: Teaching Middle and High School Students to Read and Write Well,” American Educational Research Journal, 38, 837–880. DOI: 10.3102/00028312038004837.
- Lynch, S., Kuiper, J., Pyke, C., and Szesze, M. (2005), “Examining the Effects of a Highly Rated Science Curriculum Unit on Diverse Students: Results from a Planning Grant,” Journal of Research in Science Teaching, 42, 921–946. DOI: 10.1002/tea.20080.
- McNeish, D. (2017), “Exploratory Factor Analysis With Small Samples and Missing Data,” Journal of Personality Assessment, 99, 637–652. DOI: 10.1080/00223891.2016.1252382.
- National Academies of Sciences, Engineering, and Medicine (2018), Data Science for Undergraduates: Opportunities and Options, Washington, DC: The National Academies Press. DOI: 10.17226/25104.
- Neumann, D., Hood, M., and Neumann, M. (2013), “Using Real-Life Data When Teaching Statistics: Student Perceptions of this Strategy in an Introductory Statistics Course,” Statistics Education Research Journal, 12, 59–70. Available at https://iase-web.org/documents/SERJ/SERJ12(2)_Neumann.pdf. DOI: 10.52041/serj.v12i2.304.
- Niu, L. (2017), “Family Socioeconomic Status and Choice of STEM Major in College: An Analysis of a National Sample,” College Student Journal, 51, 298–312. Available at https://link.gale.com/apps/doc/A503260900/AONE?u=googlescholar&sid=bookmark-AONE&xid=16693ec2.
- Nolan, D., and Temple Lang, D. (2010), “Computing in the Statistics Curricula,” The American Statistician, 64, 97–107. DOI: 10.1198/tast.2010.09132.
- Parsons, S., Croft, T., and Harrison, M. (2011), “Engineering Students’ Self-confidence in Mathematics Mapped onto Bandura’s Self-efficacy,” Engineering Education, 6, 52–61. DOI: 10.11120/ened.2011.06010052.
- Perepiczka, M., Chandler, N., and Becerra, M. (2011), “Relationship between graduate students’ statistics self-efficacy, statistics anxiety, attitude toward statistics, and social support,” The Professional Counselor: Research and Practice, 1(2), 99–108. DOI: 10.15241/mpa.1.2.99.
- Peters, E., Shoots-Reinhard, B., Tomkins, M. K., Schley, D., Meilleur, L., Sinayev, A., Tusler, M., Wagner, L., and Crocker, J. (2017), “Improving Numeracy Through Values Affirmation Enhances Decision and STEM Outcomes,” PLoS One, 12, e0180674. DOI: 10.1371/journal.pone.0180674.
- Peters, E., Tomkins, M. K., Knoll, M. A. Z., Ardoin, S. P., Shoots-Reinhard, B., and Meara, A. S. (2019), “Despite High Objective Numeracy, Lower Numeric Confidence Relates to Worse Financial and Medical Outcomes,” Proceedings of the National Academy of Sciences, 116, 19386–19391. DOI: 10.1073/pnas.1903126116.
- Purcell, K., Wilton, N., and Elias, P. (2007), “Hard Lessons for Life-long Learners? Age and Experience in the Graduate Labour Market,” Higher Education Quarterly, 61, 57–82. DOI: 10.1111/j.1468-2273.2006.00338.x.
- Rosseel, Y. (2012), “lavaan: An R package for structural equation modeling,” Journal of Statistical Software. DOI: 10.18637/jss.v048.i02.
- Revelle, W. (2021), An Introduction to Psychometric Theory with Applications in R (Unpublished Manuscript), Department of Psychology, Northwestern University, Evanston, IL. Available at https://personality-project.org/r/book/.
- Schau, C., Stevens, J., Dauphinee, T., and Del Vecchio, A. (1995), “The Development and Validation of the Survey of Attitudes toward Statistics,” Educational and Psychological Measurement, 55, 868–875. DOI: 10.1177/0013164495055005022.
- Selya, A. S., Rose, J. S., Dierker, L. C., Hedeker, D., and Mermelstein, R. J. (2012), “A Practical Guide to Calculating Cohen’s f2, a Measure of Local Effect Size, from PROC MIXED,” Frontiers in Psychology, 3, 111. DOI: 10.3389/fpsyg.2012.00111.
- Siegle, D., and McCoach, D. B. (2007), “Increasing Student Mathematics Self-Efficacy Through Teacher Training,” Journal of Advanced Academics, 18, 278–312. DOI: 10.4219/jaa-2007-353.
- Slootmaeckers, K., Kerremans, B., and Adriaensen, J. (2014), “Too Afraid to Learn: Attitudes towards Statistics as a Barrier to Learning Statistics and to Acquiring Quantitative Skills,” Politics, 34, 191–200. DOI: 10.1111/1467-9256.12042.
- Spencer, S. J., Steele, C. M., and Quinn, D. M. (1999), “Stereotype Threat and Women’s Math Performance,” Journal of Experimental Social Psychology, 35, 4–28. DOI: 10.1006/jesp.1998.1373.
- Steele, C. M., and Aronson, J. (1995), “Stereotype Threat and the Intellectual Test Performance of African-Americans,” Journal of Personality and Social Psychology, 69, 797–811. DOI: 10.1037//0022-3514.69.5.797.
- Taber, K. S. (2018), “The Use of Cronbach’s Alpha When Developing and Reporting Research Instruments in Science Education,” Research in Science Education, 48, 1273–1296. DOI: 10.1007/s11165-016-9602-2.
- Wiebe, E., Williams, L., Yang, K., and Miller, C. (2003), “Computer Science Attitude Survey,” Report No. TR-2003-1, Dept. of Computer Science, NC State University, Raleigh, NC. Available at https://repository.lib.ncsu.edu/bitstream/handle/1840.4/778/TR-2003-01.pdf.
- Wise, S. L. (1985), “The Development and Validation of a Scale Measuring Attitudes Toward Statistics,” Educational and Psychological Measurement, 45, 401–405. DOI: 10.1177/001316448504500226.
- Zimmerman, B. J. (2000), “Self-Efficacy: An essential Motive to Learn,” Contemporary Educational Psychology, 25, 82–91. DOI: 10.1006/ceps.1999.1016.