Abstract
As the use of data in courses that incorporate statistical methods has become more prevalent, so has the need for tools for working with such data, including those for data creation and adjustment. While numerous tools exist that support faculty who teach statistical methods, many are focused on data analysis or theoretical concepts, and there remains a need for tools that assist faculty when making data-based examples and assignments. In this article, we describe a free application, available both online and through an R package, which we developed for instructors of courses that incorporate introductory statistical methods. The app treats the process of coming up with data for examples and assignments synergistically, beginning with either data creation (through random number generation) or adjustment (when the user has data) and ending with an assessment of the data’s suitability for the desired analysis. The app enables the quick creation of many versions of variables for multiple versions of assignments and is compatible with file types associated with popular interdisciplinary software such as Excel, R, and SPSS. We highlight the app’s features and discuss survey feedback provided by faculty that demonstrates the desire and need for and effectiveness of such an app. Supplementary materials for this article are available online.
1 Introduction
1.1 Helping Students Develop Statistical Reasoning
The use of data for statistics education has been examined in a substantial amount of literature, with a major publication being the Guidelines for Assessment and Instruction in Statistics Education (GAISE) College Report published by the American Statistical Association (ASA) in 2005. The GAISE Report includes recommendations for statistics education at the college level, with a focus on both what to teach in introductory statistics courses as well as how to teach such courses. The six recommendations in the report, which was updated in 2016, consist of:
“Teach statistical thinking.
Teach statistics as an investigative process of problem-solving and decision-making.
Give students experience with multivariable thinking.
Focus on conceptual understanding.
Integrate real data with a context and purpose.
Foster active learning.
Use technology to explore concepts and analyze data.
Use assessment to improve and evaluate student learning.” (Carver et al. Citation2016, p. 3)
The guidelines highlight how statistics teachers can use data to help students develop their statistical reasoning through class activities and assignments.
Many publications on using data for statistics education have focused on student learning. Various articles, such as those by Garfield and Ben-Zvi (Citation2007), Garfield and Everson (Citation2009), Tishkovskaya and Lancaster (Citation2012), and Neumann, Hood, and Neumann (Citation2013), have shown the importance of using real data, technology, and active learning in introductory statistics classes to help students develop statistical reasoning. Some papers, including those by Singer and Willett (Citation1990), Willett and Singer (Citation1992), and Rumsey (Citation2002), have found that students are more motivated to ask questions and engage in investigations when real world scenarios and data are presented in class. And others, such as those by Hogg (Citation1991), Pan and Tang (Citation2005), Bude et al. (Citation2007), and Neumann, Neumann, and Hood (Citation2010, Neumann, Hood, and Neumann Citation2013), have shown that practical applications with relevant data are factors in student success, engagement, and interest.
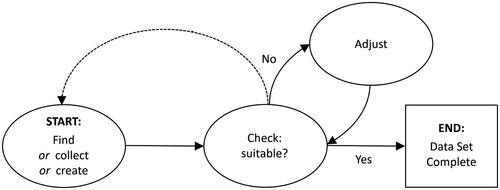
When it comes to teachers coming up with data for examples, assignments, or assessments, we advocate for what we term a “holistic” process in this article. This process involves teachers (a) obtaining data—whether that involves finding real world data, collecting data, or creating it (e.g., through random number generation or trial and error)—and then (b) checking the suitability of the data for the intended lesson, assignment, or assessment. By not decoupling these two steps, teachers can ensure data are as desired for their intended instructional purposes. In situations where the data are not suitable, teachers can either start over at the first step of the process or adjust the data they already have—repeatedly if needed—until it is suitable. shows a flowchart containing different routes for coming up with data.
Fig. 1 Flowchart outlining the full process of coming up with data for examples, assignments, and assessments. Bold arrows indicate flow for which the proposed application—which will be described in Sections 3 and 4—is intended, while the dashed arrow indicates flow that does not involve the application.
1.2 Finding and Using Existing Datasets
There are many repositories of datasets, such as those included in the Data and Story Library (Data Description n.d.), the CAUSE Resource Library (Consortium for the Advancement of Undergraduate Statistics Education n.d.), and Useful Websites for Teachers (American Statistical Association n.d.). Additional repositories are listed by Singer and Willett (Citation1990), Tishkovskaya and Lancaster (Citation2012), and Neumann, Hood, and Neumann (Citation2013), and many authors and publishers have made datasets from textbooks available.
While the existence of these repositories is a clear positive, especially for the reasons introduced in Section 1.1, there are still various downsides to using online datasets. One downside is that the analyses performed on these datasets are sometimes available online and, for the initiated student, such analyses can be found easily. A related downside is that analyses can be passed directly between students, such as from one section of a class to another or from one semester to the next. Another potential pitfall is that it takes time for statistics teachers to search for appropriate datasets, and in some situations, they might not successfully find data that meet their desires or needs when teaching particular statistical concepts. For instance, the data they find might not be appropriate for the concept and/or it might not pertain to the specific discipline in which they teach and in which they prefer to focus their examples and problems. Other potential drawbacks include data messiness (Neumann, Hood, and Neumann Citation2013) and small sample sizes (Singer and Willett Citation1990), both of which can lead to discussions that may not be appropriate for the level of student and distract students from the statistical concepts of interest. Additionally, Singer and Willett (Citation1990) note that it might be challenging to use real data for in-class exams where there may be a lack of computers or time to have students download data and run analyses. Instead, they suggest instructors provide scenarios and generate computer output for students to interpret. However, these types of exam questions do not assess whether students can determine what type of analyses to do, which is often an important learning outcome of the course.
1.3 Collecting Data
Collecting data in class, such as via a class survey or an experiment, is another way to produce a dataset (Hogg Citation1991; Garfield and Ben-Zvi Citation2008). Even more, students can collect their own data. Neumann, Neumann, and Hood (Citation2010) used real survey data collected by students throughout an introductory statistics course, and student feedback showed an increased interest in and understanding of statistics.
However, data collected in such ways can be problematic. In addition to the potential issues mentioned in Section 1.2, there might be missing data, sampling bias, or a lack of anonymity of the subjects. Plus, teachers do not know ahead of time whether the theoretical model is appropriate or whether the assumptions of statistical methods are satisfied.
1.4 Creating Data from Scratch and Adjusting Existing Data
Some teachers create new datasets or adjust existing ones for class activities or course assessments, or to illustrate certain concepts like violations of the assumptions of simple linear regression or other statistical procedures. In fact, this is often done as a result of the drawbacks discussed in Section 1.2. Two main limitations to these options, however, are the time required to do so using existing software and the need for the teacher to have facility using such software.
Teachers with large class sizes may also wish to be able to create multiple datasets for group projects or to minimize academic integrity issues during examinations or other assessments, especially in remote classrooms. Supiano (Citation2020) discusses certain challenges faculty have encountered regarding cheating, including when teaching remotely, whereas various sources (such as Searle and Firey Citation1980; Bernardi et al. Citation2008; Manoharan Citation2017) discuss how the use of individualized assignments has been shown to be an effective deterrent to cheating. However, due to lack of time or available resources, teachers might simply use available data. For these same reasons they might not create different versions of their assessments.
1.5 Assessing and Addressing the Data-Related Needs of Statistics Educators
We conducted a survey to learn more about the experiences of faculty who work with data in their courses that incorporate introductory statistical methods. A description of the survey, as well as a presentation and discussion of the results, can be found in Section 5. In response to the desires and needs of faculty, we developed a platform-free application, named StatTeacherAssistant, to support teachers of introductory statistics by simplifying the processes of creating new data, adjusting existing data, and checking the data’s suitability. The application provides educators with a user-friendly tool which enables them to easily and quickly:
make multiple, unique datasets that can be used for assessments, projects, and problem sets either by adjusting existing data that they import or input manually, or by creating new data (through random number generation, for example);
create data that violate common assumptions of inferential methods—violations such as nonconstant variance and nonlinear relationships when working with regression;
run exploratory analyses and fundamental inferential methods, as well as check assumptions for the inferential methods without needing a statistical package or coding background; and
import and export numerous different types of data files (.csv, .xlsx, .rda, .RData, .rds, .sav, and .mat, among others) associated with software commonly used in introductory statistics courses (Excel, R, and SPSS to name a few), which includes the ability to directly convert from one file type to another.
The article proceeds as follows. In Section 2, we discuss existing software for statistics education, including strengths and drawbacks. In Section 3, we describe the StatTeacherAssistant application in detail, and we then provide examples of its use for introductory statistics teachers in Section 4. In Section 5, we describe and discuss the results of two surveys given to statistics faculty. The first survey considers the different ways that faculty use data in the classroom, while the second survey focuses on faculty evaluations of the StatTeacherAssistant app. A summary of the article follows in Section 6.
2 Existing Software for Statistics Education
Free online tools have been developed for use by introductory statistics teachers and their students that support recommendations made in the GAISE report. Of these online tools, many include statistical calculators that can be used for exploratory data analysis and to perform the basic statistical inference methods covered in introductory classes. These applications include the collection at the Rice Virtual Laboratory in Statistics (RVLS by Lane Citation1999), the Statistics Online Computational Resource (SOCR by Dinov Citation2006), and the applets developed by Rossman et al. (Citation2009). Other popular tools such as StatKey (Morgan et al. Citation2014), VassarStat (Lowry Citation2015), and ArtofStat (Agresti, Franklin, and Klingenberg Citation2020) are designed with specific introductory statistics textbooks associated with them, though the tools can be used independently. Rguroo (Soflytics Corp Citation2022) is a new web-based statistical package that is free for teachers, though it requires an account and has a small fee for student users.
When it comes to inputting data (either manually or via upload), all of the applications mentioned above allow users to enter in their own data by hand. Some also allow users to copy and paste data from a spreadsheet (RVLS, StatKey, VassarStats, Rossman/Chance, ArtofStat, and Rguroo). StatKey allows uploads of .txt, .csv and .tsv files, and Rguroo supports a wide range of import file types. RVLS is a Java-based applet which most browsers, unfortunately, no longer support. Users of this application need to modify their browser settings in order to be able to use the apps. The java applets on the original SOCR website are now deprecated, and the website has links to some updated HTML5 apps and the SOCR Analytical Toolbox (SOCRAT) for data visualization and analysis.
In terms of data modification, only two of the applications mentioned above allow for the manipulation of the uploaded data files, and the features offered are limited in scope. The Data Transformer app in VassarStats’ Utilities collection allows users to try different transformations to make skewed data approximately normal. However, users cannot export the data or results. Rguroo has a built-in transformation button that allows users to build new variables from existing ones, and while there are video tutorials linked on each window to provide help, there is a learning curve to do this. More complicated transformations require users to know R functions and basic coding. As before, new variables that are created can be exported as .csv files.
Regarding generating data from scratch, Rguroo has a random number generator that allows users to select one of many families of distributions, and the new data can be exported as a .csv file. Rguroo additionally allows for multiple columns of the same type of distribution to be generated at once, but new variables with different parameters, or those generated from different distributional families, need to be created individually. These new variables are stored in different tabs, which makes exporting the data cumbersome. ArtofStat has an app where data from a discrete uniform distribution can be simulated and exported to a .csv file, but does not enable users to choose from other distributional families.
Obviously, there is proprietary software—such as Excel, SPSS, Minitab, JMP, StatCrunch (Pearson Education Citation2022), Fathom (The Concord Consortium Citation2022), Genstat (VSN International Citation2022), SAS, and MATLAB—that instructors can use to generate and adjust data. However, most of these have licensing costs, some use specialized packages, and all require users to have a sufficient comfort level with the program or knowledge of the computing language to be able to manipulate the data. The latter two points are also true for the popular statistical programming language R. In contrast, the app we present in this article is free and enables instructors to generate new data or adjust existing data easily without requiring them to create an account or know the syntax of any statistical software.
3 Description of the Application
We now describe the StatTeacherAssistant application and its functionalities when working with datasets. The app was made using the Shiny package (Chang et al. Citation2021) in R (R Core Team Citation2021) and is bolstered by numerous other R packages, including ggplot2 (Wickham Citation2016) and rio (Chan et al. Citation2021). It is available in two formats. First, there is a web-based version of the app, which is available at https://educationapps.shinyapps.io/StatTeacherAssistant. Second, the app can be run directly using R, though users do not have to have a background in R to use it. This second option can be particularly advantageous in situations where users want to use the app but have limited internet access. For users who have experience using R, the app is accessed by running the runStatTeacherAssistantApp() function after downloading (and loading) the StatTeacherAssistant package from CRAN. For users who do not have experience using R but still want to run the app through R, a set of instructions can be found in the supplementary materials.
The tool was designed to address various issues and drawbacks presented in Section 2 while focusing holistically on the process of coming up with data for examples, assignments, and assessments. In addition to providing users with the ability to create or adjust data, one of the highlights of the app is that it supports the use of interesting and real data. The modification process in the app includes options that maintain desirable aspects of existing real world data while allowing users to make tweaks to illustrate particular statistical concepts as well as make multiple versions of quite similar yet still different data. While the modified data are not technically “real” by the true definition of the word, the primary benefits and goals of using real data in the introductory statistics classroom can be preserved—such as the use of interesting and thought-provoking examples, the presence and impact of outliers, and violations of assumptions of statistical procedures, to name a few. Thus, the app can aid teachers who use real(istic) data in the classroom as well as those who do not.
The app allows teachers to modify or create realistic data that they can use to assess their students’ learning and to provide data that their students can analyze to help them develop their statistical reasoning and understanding of statistical concepts. Therefore, the app supports faculty in meeting four of the recommendations (1–3 and 6), from the GAISE Report. We now present additional strengths of the app followed by its abilities.
3.1 Strengths of the Application
The app possesses various strengths that help it stand out from other existing software for statistics education, particularly its focus on the full process of coming up with data for the classroom. (a) The app, while built using the popular statistical programming language R, does not require the user to know how to code in R and instead fully uses a point-and-click interface. (b) For teachers who use the web-based version, the app works in commonly-used web browsers. (c) The app is available for free, and users do not need to create an account and log in; instead, they have immediate and full access to the app’s functionalities. (d) Each tab in the app contains step-by-step instructions that explain what users can do in the respective tab and guide users through the full process of coming up with data by navigating them through the tabs systematically. These instructions were aimed to simplify the usability of the app while simultaneously minimizing the time it takes for users to create and/or adjust datasets that meet their needs. (e) Users have the option to enter their own data or import datasets with a variety of file extensions (e.g., .csv, .txt, .xls, .xlsx, .mat, .sas7bdat, .sav, .rda, .RData, and .rds) compatible with statistical programs used in wide-ranging disciplines (e.g., business, natural sciences, social and behavioral sciences, and engineering). (f) The application has a number of features designed to assist teachers of statistics that are not available or are more difficult to use in other tools. In particular, users are able to effortlessly randomly generate and save new data from various distributional families and adjust existing data in various ways, including the ability to adjust data so that the residuals in a regression analysis have nonconstant variance. The newly created dataset can be analyzed easily within the app to determine their suitability for desired statistical methods as well as for checking whether the associated assumptions have been met. Users can then export the dataset using an assortment of file formats, enabling the dataset to be immediately available for examples and assignments. (g) The design of the app allows users to quickly and easily make multiple versions of datasets for assignments. Due to the random processes employed by the app when making new variables—including multiple versions of existing ones—students are not able to obtain answers from previous uses of data. (h) The option to import and export files with a wide range of formats enables instructors who no longer have access to certain proprietary software (e.g., due to an expired license), or those who need to convert a file to a new format for a course that uses different statistical software, the means to work with existing datasets.
3.2 Main Abilities of the Application
We now explain how the app guides the user through the process of coming up with suitable data by describing the app’s features—from inputting or creating data, to adjusting it, to checking its suitability, and lastly to downloading it. We note that both the web-based and R versions of the app function the same way, and the instructions below hold for both.
3.2.1 Inputting Data
The app provides users with two methods for inputting existing data, both of which are found in the “Input Data” tab: (a) uploading a file that contains the dataset or (b) manually inputting data by either typing it or copying and pasting it from a spreadsheet. For situations where users want to upload an existing dataset, the app is compatible with file types associated with popular statistical software used in various disciplines. For instance, the app allows users to upload CSV and text files, as well as data files in the form of Excel spreadsheets (either .xlsx or .xls) or others used in MATLAB (.mat), R (.rda, .RData, or .rds), SAS (.sas7bdat), SPSS (.sav), and Stata (.dta). The app is also compatible with other file types, a list of which can be accessed on the “Help” tab of the app. If users instead wish to manually input data, they can do so by creating a spreadsheet in the app and then typing or pasting data into the table.
3.2.2 Randomly Generating Data
In addition to enabling users to work with existing data, the app allows for the random generation of data in the “Generate Data” tab. The newly created dataset can be the main dataset that users continue to work with or it can be added—on either the left- or right-hand side—to an existing dataset that was uploaded or entered in the previous step.
The app allows users to randomly generate both quantitative and categorical data, with multiple options provided for both. For quantitative data, users are presented with the option to choose either the shape of the distribution to sample from or the distribution itself. If they elect to choose the shape, users select from a list consisting of options such as “normal,” right skewed, and severely right skewed, among others. On the other hand, if they prefer to choose the distribution itself, users select from a list of distributional families—both continuous and discrete, including normal, t, F, and Poisson, among others—and then input the desired parameters. Users also specify the sample size and the total number of samples to draw at random from the specified distribution. For categorical data, users select the family of distributions—either binomial or multinomial—along with the respective parameters, the sample size, and the number of samples to draw, and they have the option to update the category labels.
3.2.3 Adjusting Existing Data
Once users have data to work with—after inputting existing data and/or randomly generating new data—they have the option to adjust it, including the ability to create new versions of variables, in the “Adjust Data” tab. There, they can make changes to a single variable or a group of variables all at once. The app offers users the following options when adjusting variables:
transform data using a linear function,
transform data using a custom function of a variable (e.g., polynomial, logarithmic, exponential, or trigonometric),
combine variables,
add random (normal) noise,
add outlier(s),
create a response variable such that the constant variance assumption for regression is violated,
round the numbers (to a nearest digit, to a floor or ceiling, or to a minimum/maximum value),
adjust category counts (for categorical data),
specify the format of missing data (e.g., replace a blank cell with a period), and
copy, remove, or rename variables.
The app allows users to work with individual observations by either removing or adding them manually, as well as the option to view the dataset as a table or spreadsheet.
3.2.4 Checking the Suitability of New or Existing Data
Users have the ability to examine the suitability of their data at any point using descriptive or inferential methods commonly taught in introductory and some intermediate statistics (or statistics-based) courses. The descriptive methods include univariate and bivariate procedures for both quantitative and categorical variables and involve the calculation of summary statistics and the plotting of graphs. The inferential procedures include hypothesis testing and confidence interval procedures for means (one or more, including one-way ANOVA, where users are shown a normal QQ plot, a residual plot, Levene’s test results, and Tukey’s HSD pairwise comparisons results, among other output, all in one place) and proportions (one or two), as well as Chi-square tests for categorical data. For each of the inferential methods, common numerical and graphical output is provided to help with assumption checking. In addition, regression procedures are included in both the descriptive and inferential groupings to allow users to view the output most appropriate for their desired regression analysis.
If at any point users are not satisfied with the suitability of at least one variable in the dataset, they can return to the “Adjust Data” stage, make changes there, and then return to the “Check Data” stage to check the suitability of the new data.
3.2.5 Downloading Data
Once users have finished checking the suitability of their data, they proceed to the “Download Data” tab. There, they have the option to download either the entire dataset or a subset of variables that they manually select. This gives users the flexibility to quickly and easily save different versions for multiple assignments or groups of students. They can also reorder the variables from left to right and format missing data as desired. Next, users specify the file name and select the desired file type from a list of common file extensions. While not identical to the list available when uploading data, the list of extensions when downloading a dataset consists of the following options: .csv, .xlsx, .mat, .txt, .rda, .RData, .rds, and .sav. In fact, because certain file types (e.g., CSV) are so widely used and compatible with many programs, users can download datasets which are importable into a multitude of such programs, such as Excel, JMP, MATLAB, Minitab, R, SAS, SPSS, Stata, and StatCrunch. Further, the upload and download options in the app even allow users to quickly convert a dataset between file extensions (e.g., .sav to .csv) even if they do not want to make any changes to the dataset itself, something particularly desirable if users cannot access the software associated with a file containing a dataset. When downloading, the file is saved in the user’s default location for downloads.
4 Example of the Application’s Usage
In Section 3 we described the features offered by the app. We now demonstrate the app’s ability to assist users when creating and adjusting datasets. Providing step-by-step directions, we work through an example of a full process of coming up with data from start to finish, including a step where we randomly generate data for a variable which we add to an uploaded dataset. When doing so, we work with fictional data involving the assessment of the efficacy of a new blood pressure drug. The variables include the factor Group (Treatment vs. Control) and Decrease (which measures the decrease in blood pressure, in mmHg, after the person takes their assigned drug for a set period of time).
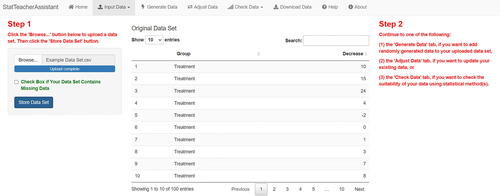
In the app, the user begins on the “Home” tab, which lists options for how they can either input or randomly generate data, as is shown in . Suppose the user has a CSV file that contains data pertaining to the blood pressure drug example described previously. They then start by uploading the file to the app in the “Input Data” tab. The app automatically recognizes the file extension used instead of requiring the user to specify the file type, establishing a seamless upload process for the user. As soon as the file is uploaded, the dataset is displayed in an easy-to-read table, as can be seen in .
Fig. 2 The user begins on a home screen that explains the three options for starting out in the app.
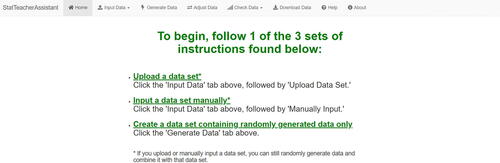
Fig. 3 The user has the option of first uploading a dataset, which is displayed once uploaded.
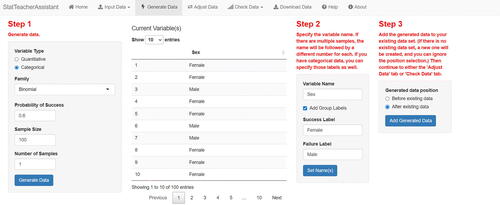
After inputting their data, the user has the option of randomly generating data and adding it to their dataset. In order to demonstrate the app’s ability to achieve this, we add a Sex variable to the existing dataset. When randomly generating data, the user has control over various features and works left to right through the display panels shown when specifying their desired inputs. For instance, shows the inputs and output when creating one new variable by randomly sampling n = 100 values (with category labels changed from “1” and “0” to “Female” and “Male,” respectively) from a Binomial distribution with a probability of success (female) of p = 0.6.
Fig. 4 Creation of a new variable (Sex) whose values were randomly sampled from the Binomial(100, 0.6) distribution, with descriptive labels added for the categories.
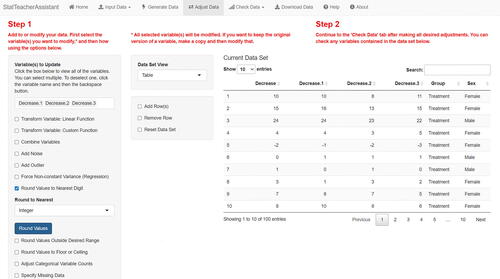
Once they have finished randomly generating data and combining it with the uploaded dataset, the user navigates to the “Adjust Data” tab, where they are able to adjust any variable in the combined dataset. Suppose the user wants to create three new versions of the Decrease variable. To do so, the user first makes three copies of Decrease using the “Copy Variable” option. In order to streamline the process when making new versions of variables, the app places the copies at the beginning of the dataset (and moves the original version directly before the copies to preserve the natural order) and automatically selects all of the copies of the first copied variable for further updating. Other variables can be added if desired. At this point the user can use the “Add Noise” feature to add noise to each value of the selected variables by drawing at random from the normal distribution they specify, followed by the “Round Values to Nearest Digit” feature to round the new values to the nearest specified digit (in this case, the nearest integer). shows the updated data for the three new versions of Decrease after using the features just described. We note that the user has the ability to rename the variables if they wish.
Fig. 5 Updated dataset after the user has followed three steps: (a) made three copies of the Decrease variable, (b) added random noise from the standard normal distribution to the values of the three copies, and (c) rounded the updated values of the three copies to the nearest integer.
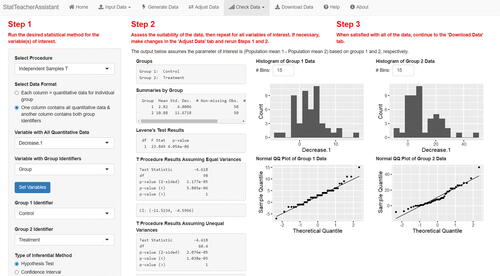
After making their desired adjustments, the user moves to the “Check Data” tab, where they can assess the suitability of the data for their desired analysis. Suppose the user plans on asking their students to run an independent samples t procedure for the two treatment groups using one of the versions of Decrease. shows some of the inputs and output of the independent samples t procedures—for both hypothesis testing and confidence intervals—using Decrease.1 (one of the three new versions of Decrease) and the grouping variable Group. The app allows the user to easily set essential inputs, such as the test value or confidence level, and it displays a set of output central to the analysis (e.g., descriptive summaries, test results, and numerical and graphical results for assumption checking) automatically to simplify the data checking step for the user.
Fig. 6 Independent samples t procedure (hypothesis test and confidence interval) inputs and output using one of the new Decrease variables. Additional inputs and output not shown in the figure are displayed in the app after scrolling down.
It is recommended that the user assess the output for each new version of Decrease (and, in general, for all variables and analyses they want their students to use and run). If at any time they are not satisfied with the results associated with a particular variable, the user can return to the “Adjust Data” tab and further update the data for that variable until they are satisfied.
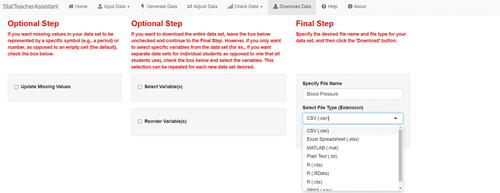
Once the user is content with their data, they continue to the “Download Data” tab. There, they are first presented with three optional features:
the ability to input a symbol or other character (e.g., a period) to represent any missing data in the dataset, as opposed to a blank cell,
the ability to manually select specific variables from the full dataset—something particularly valuable when using multiple versions of assignments, and
the ability to reorder the variables selected.
Then the user specifies the file name and selects the desired file extension from a set of common extensions, inputs that can be seen in .
Fig. 7 When downloading their new dataset, the user specifies the file name and selects the desired file extension from a drop-down menu. The app also offers optional features regarding the treatment of missing data and the selection of specific variables.
5 Assessments
We now describe two different surveys that were given to faculty who teach courses that incorporate introductory statistical methods. The first survey, presented in Section 5.1, considers how faculty access and create data to use in their classes, while the second survey, discussed in Section 5.2, asked faculty who used the StatTeacherAssistant app for their feedback regarding their experiences using it. (Both surveys were exempt from review by the Fairfield University Institutional Review Board and included a required question that asked participants if they give consent for their responses to be used anonymously for the study.) The results of the two surveys suggest that there is both a desire and a need for the StatTeacherAssistant app, as we explain in Section 5.3.
5.1 Assessment of Statistics Faculty’s Experiences Working with Data in the Classroom
A survey was sent to 46 faculty teaching courses that incorporate introductory statistical methods at Fairfield University, a comprehensive university with approximately 5000 undergraduate and graduate students, during the 2020–2021 academic year. These faculty teach in one of four different schools and colleges across the university—the College of Arts & Sciences, the School of Business, the School of Nursing & Health Studies, and the Graduate School of Education & Allied Professions—and have all taught a course that incorporates at least some introductory statistical methods. The survey focused on the experiences of faculty in terms of finding, creating, and modifying data in their statistics-based courses. Fifteen faculty, including many from different schools and departments across the university, responded to the survey.
The questions focused on common types of datasets that statistics faculty use in their introductory classes for examples and assignments. One set of questions focused on existing data, which we defined as data found online or in a textbook. Another set of survey questions focused on the creation of new data (e.g., through trial and error or random number generation). Modified existing data and data collected from a survey, class activity, or lab experience were other types of data sources we considered. Lastly, faculty members were asked about whether they create multiple versions of individual variables or entire datasets for class examples or assignments.
Faculty responded to Likert-scale questions regarding how often they use each method of obtaining data, how easy it is for them to find or generate data, and how satisfied they are with the time it takes them to get the data. The responses are summarized in .
Table 1 Faculty responses about how often they use different types of data for classes.
Table 2 Faculty responses about satisfaction with time it takes to obtain data for classes.
Table 3 Faculty responses about ease of obtaining data for classes.
Table 4 Percent of respondents (not including NAs) that (a) sometimes, often, or always use different types of data for classes, (b) were either unsatisfied or very unsatisfied with the time it takes to obtain data for classes, and (c) found it either somewhat difficult or extremely difficult to get the different types of datasets.
The results in and reveal that faculty are using a variety of data formats and sources in their classes, including creating and modifying datasets. and show that some faculty are dissatisfied with the time it takes them to find, modify, or create datasets. And at least 45% of the faculty who responded (not including the NAs) indicated that it was either somewhat difficult or extremely difficult to find, modify, or generate data to use in their classes, as seen in and .
5.2 Assessment of the StatTeacherAssistant Application
Another survey—focused on assessing the StatTeacherAssistant application—was sent to the same 46 full-time and part-time faculty members at Fairfield University during the 2020–2021 academic year. The survey contained a combination of Likert-scale, “check all that apply,” and open-ended questions asking faculty for their feelings and thoughts about the StatTeacherAssistant application after using it. Responses were obtained from six faculty across three colleges and schools—the School of Business, the School of Nursing & Health Studies, and the College of Arts & Sciences—as well as two areas within the College of Arts & Sciences—(a) mathematics and statistics, and (b) natural sciences. We now discuss the feedback obtained regarding the StatTeacherAssistant app.
The survey contained the following four Likert-scale statements about the app:
I found the app easy to use.
I found the features offered by the app to be helpful for use in my course(s) that involve introductory statistical methods.
I plan on using the app to come up with data for my course(s) that involve introductory statistical methods—for example, making new data from scratch, modifying existing data, or making multiple versions of individual variables or entire datasets.
I think the app would save me time in constructing new or modified datasets for use in my course(s) that involve introductory statistical methods.
All six faculty members responded to these four statements, with their responses summarized in . For each of the statements, multiple respondents (a majority, in fact) provided positive responses—consisting of either “Agree” or “Strongly Agree.” In fact, there was only one statement—the fourth—to which there was more than one negative response. It is interesting to note that even while two respondents indicated they do not plan on using the app, one of them believes the app would help them save time. It is unclear why they do not plan on using the app, but we are glad they see its value.
Table 5 Faculty responses to Likert-scale statements about the StatTeacherAssistant application.
The survey then provided a “check all that apply” question listing purposes for which the faculty member might use the app, as well as open-ended questions asking what they liked about the app. Five of the six respondents provided reasons for why they might use the app, with each selecting at least one of the options listed below and some selecting all:
coming up with brand-new data for examples and various types of assignments (homework, quizzes, exams, etc.) [n = 3],
making multiple versions of individual variables or entiredatasets for various types of assignments (homework, quizzes, exams, etc.) [n = 4],
coming up with data that is not “nice” [n = 4],
checking the suitability of existing data for examples or assignments [n = 3], and
running statistical methods and obtaining output when making examples, activities, practice problems, or solutions to assignments [n = 3].
When responding to the positive open-ended questions about the app, three users praised the app’s ease of use, as well as liking:
“[how] it is a comprehensive tool [that] covers most of the fundamental statistics analys[e]s,”
“the ability to change datasets and then test them,” and
“[the] overall layout and organization.”
The survey also included a question containing a list of reasons for which the faculty member might not use the app, in addition to open-ended questions asking what they did not like about the app along with suggestions for improvement. Three respondents found no reasons not to use the app and in fact plan on using it, two specified they already are able to do everything they want and need when working with data in their courses, and one indicated they found the app unreliable due to an error they experienced when using it. Additionally, two of the users felt it would be beneficial to add instructions to make the app easier to use, while one felt most of the features are beyond the scope of the statistical methods covered in their course(s).
5.3 Discussion of the Results of the Two Surveys
The results of the survey from Section 5.1 make it clear that some teachers of statistics are unsatisfied with the time and effort currently needed to find and/or create data for assignments.
As evidenced by the survey results discussed in Section 5.2, a majority of the faculty respondents liked the StatTeacherAssistant application and expressed numerous ways in which it could help them when working with data in their course(s) that involve introductory statistical methods. Additionally, in response to the issues and suggestions brought up by respondents, we made updates to the app to simplify the user experience. For instance, we fixed the plotting issue which caused error messages in certain situations. And, we clarified how to use the different features offered by the app while simultaneously strengthening the focus on the full process of generating and/or adjusting data. To this end, we added (a) a “Home” tab explaining the options for starting out in the app, and (b) detailed instructions at the top of each tab in the app (all presented in bold, colored text to make them stand out) that guide the user through the app one step at a time, as seen in . Further, while the feedback was positive overall, it also suggests the app might be of more use to faculty teaching courses with a stronger focus on inferential statistical methods rather than ones that have a lesser focus on such methods (e.g., courses that only cover univariate descriptive methods when discussing statistics). While the response rates were lower than we had hoped for, we gave faculty an extended period of time to respond to the surveys and followed up on multiple occasions, and we know that the COVID-19 pandemic made it difficult for many faculty to find time to respond to the surveys and explore the app. Even so, the results indicate a need for this app.
6 Conclusion
In this article we described the StatTeacherAssistant application, which is designed to support instructors of statistics-based classes, particularly those involving introductory statistical methods. The free app is available online or can be easily run in R. The survey feedback discussed makes two things clear: (a) there are instructors of such courses who both want and need resources that facilitate the data creation and adjustment process for examples, assignments, and assessments, and (b) the StatTeacherAssistant app helps achieve exactly that. It is our hope that other faculty find the app useful as they prepare their classes.
Supplementary Materials
Instructions for installing and running R and the StatTeacherAssistant app through R, in addition to the two surveys discussed in Section 5, are included in the supplementary materials.
Supplemental Material
Download Zip (54.7 KB)Acknowledgments
We are grateful to the editor as well as the anonymous associate editor and reviewers for their valuable comments which strengthened the article. We are also thankful to our colleagues who took the time to respond to the surveys and explore the app.
References
- Agresti, A., Franklin, C., and Klingenberg, B. (2020), Statistics: The Art and Science of Learning from Data (5th ed.), Upper Saddle River, NJ: Pearson.
- American Statistical Association. (n.d), “Useful Websites for Teachers.” Available at https://www.amstat.org/asa/education/Useful-Websites-for-Teachers.aspx.
- Bernardi, R. A., Baca, A. V., Landers, K. S., & Witek, M. B. (2008), “Methods of Cheating and Deterrents to Classroom Cheating: An International Study,” Ethics & Behavior, 18, 373–391. DOI: 10.1080/10508420701713030.
- Bude, L., Van De Wiel, M., Imbos, T., Candel, M., Broers, N., and Berger, M. (2007), “Students’ Achievements in a Statistics Course in Relation to Motivational Aspects and Study Behavior,” Statistics Education Research Journal, 6, 5–21. DOI: 10.52041/serj.v6i1.491.
- Carver, R. H., Everson, M., Gabrosek, J., Horton, N. J., Lock, R. H., Mocko, M., Rossman, A., Roswell, G. H., Velleman, P., Witmer, J. A., and Wood, B. (2016), “Guidelines for Assessment and Instruction in Statistics Education (GAISE) College Report 2016.” Available at https://commons.erau.edu/publication/1083.
- Chan, C., Chan, G. C., Leeper, T. J., and Becker, J. (2021), rio: A Swiss-army knife for data file I/O. R package version 0.5.27.
- Chang, W., Cheng, J., Allaire, J. J., Sievert, C., Schloerke, B., Xie, Y., Allen, J., McPherson, J., Dipert, A., and Borges, B. (2021), shiny: Web Application Framework for R. R package version 1.6.0.
- Consortium for the Advancement of Undergraduate Statistics Education. (n.d), “Resource Library.” Available at http://causeweb.og/cause/resources/library/261.
- Data Description. (n.d), “The Data And Story Library.” Available at http://dasl.datadescription.com.
- Dinov, I. (2006), “SOCR: Statistics Online Computational Resource,” Journal of Statistical Software, 16, 1–16. DOI: 10.18637/jss.v016.i11.
- Garfield, J., and Ben-Zvi, D. (2007), “How Students Learn Statistics Revisited: A Current Review of Research on Teaching and Learning,” International Statistical Review, 75, 372–396. DOI: 10.1111/j.1751-5823.2007.00029.x.
- Garfield, J., and Ben-Zvi, D. (2008), Developing Students’ Statistical Reasoning: Connecting Teaching and Practice, Dordrecht: Springer.
- Garfield, J., and Everson, M. (2009), “Preparing Teachers of Statistics: A Graduate Course for Future Teachers,” Journal of Statistics Education, 17. Available at http://jse.amstat.org/v17n2/garfield.html. DOI: 10.1080/10691898.2009.11889516.
- Hogg, R. (1991), “Statistical Education: Improvements are Badly Needed,” The American Statistician, 45, 342–343. DOI: 10.2307/2684473.
- Lane, D. (1999), “Rice Virtual Lab in Statistics,” Behavior Research Methods, Instruments and Computers, 31, 24–33. DOI: 10.3758/bf03207689.
- Lowry, R. (2015), Concepts and Applications of Inferential Statistics: Author. Available at http://vassarstats.net/.
- Manoharan, S. (2017), “Personalized Assessment as a means to Mitigate Plagiarism,” IEEE Transactions on Education, 60, 112–119. DOI: 10.1109/TE.2016.2604210.
- Morgan, K. L., Lock, R. H., Lock, P. F., Lock, E. F., and Lock, D. F. (2014), “StatKey: Online Tools for Bootstrap Intervals and Randomization Tests,” in Sustainability in Statistics Education. Proceedings of the 9th International Conference on Teaching Statistics, ICOTS9.
- Neumann, D., Hood, M., and Neumann, M. (2013), “Using Real-life Data When Teaching Statistics: Student Perceptions of This Strategy in an Introductory Statistics Course,” Statistics Education Research Journal, 12, 59–70. DOI: 10.52041/serj.v12i2.304.
- Neumann, D., Neumann, M., and Hood, M. (2010), “The Development and Evaluation of a Survey that Makes Use of Student Data to Teach Statistics,” Journal of Statistics Education, 18. DOI: 10.1080/10691898.2010.11889478.
- Pan, W., and Tang, M. (2005), “Students’ Perceptions on Factors of Statistical Anxiety and Instructional Strategies,” Journal of Instructional Psychology, 32, 205–214.
- Pearson Education. (2022), StatCrunch. London, UK: Pearson Education. Available at https://www.statcrunch.com.
- R Core Team. (2021), R: A Language and Environment for Statistical Computing. Vienna, Austria: R Foundation for Statistical Computing.
- Rossman, A., Chance, B., Garcia, F., Lima, C., Holmes, E., and Gill, R. (2009), “Rossman/Chance Applet Collection.” Available at http://www.rossmanchance.com/applets/.
- Rumsey, D. (2002), “Statistical Literacy as a Goal for Introductory Statistics Courses,” Journal of Statistics Education, 10. DOI: 10.1080/10691898.2002.11910678.
- Searle, S., and Firey, P. (1980), “Computer Generation of Data Sets for Homework Exercises in Simple Regression,” The American Statistician, 34, 51–54. DOI: 10.2307/2682999.
- Singer, J., and Willett, J. (1990), “Improving the Teaching of Applied Statistics: Putting the Data Back into Data Analysis,” The American Statistician, 44, 223–230. DOI: 10.2307/2685342.
- Soflytics Corp. (2022), Rguroo, Encino, CA. Available at https://www.rguroo.com/.
- Supiano, B. (2020), “Students Cheat. How Much Does it Matter?” Chronicle of Higher Education. Available at https://www.chronicle.com/article/students-cheat-how-much-does-it-matter.
- The Concord Consortium. (2022), Fathom, Concord, MA: The Concord Consortium. Available at https://fathom.concord.org.
- Tishkovskaya, S., and Lancaster, G. (2012), “Statistical Education in the 21st Century: A Review of Challenges, Teaching Innovations and Strategies for Reform,” Journal of Statistics Education, 20, 1–55. Available at http://jse.amstat.org/v20n2/tishkovskaya.pdf. DOI: 10.1080/10691898.2012.11889641.
- VSN International. (2022), Genstat, Hemel Hempstead, UK: VSN International. Available at https://vsni.co.uk/software/genstat.
- Wickham, H. (2016), ggplot2: Elegant Graphics for Data Analysis, New York: Springer.
- Willett, J. B., and Singer, J. D. (1992), “Providing a Statistical “Model”: Teaching Applied Statistics using Real-World Data,” in Statistics for the Twenty-First Century, MAA Notes, 26, eds. F. Gordon and S. Gordon, pp. 83–98. Washington DC: Mathematical Association of America.