 ?Mathematical formulae have been encoded as MathML and are displayed in this HTML version using MathJax in order to improve their display. Uncheck the box to turn MathJax off. This feature requires Javascript. Click on a formula to zoom.
Abstract
An anonymous survey was given to n = 73 students in an asynchronous online statistical literacy course at a mid-sized Hispanic Serving Institution. Informed by teaching experience, literature on lexical ambiguity, and everyday usage of statistics words and phrases, the first author designed the survey to yield insight into how students view phrases such as “average person,” “random person,” and “outlier person,” and to explore possible connections or patterns with such phrases. Findings suggest that students view phrases such as “random person” in a way much further from standard usage than they do phrases such as “anonymous person.” Considerations such as diversity, agency, and variable identification are identified as possibly affecting usage and meriting further investigation. Recommendations for teaching and future research are provided. Supplementary materials for this article are available online.
© 2023 The Author(s). Published with license by Taylor and Francis Group, LLC.
1 Introduction
Some famous people don’t exist. Examples include Japanese pop band member Eguchi Aimi, South Korean virtual influencer Rozy, celebrity Allegra Coleman, Titanic character Jack Dawson, the General Mills character Betty Crocker, USA national personification Uncle Sam, and the recently-discontinued Quaker Oats icon Aunt Jemima. A generative adversarial network can be used to generate realistic-looking but fake photographs of human faces (e.g., https://www.whichfaceisreal.com/). There may also be some nonexistent people in the language used by college students enrolled in introductory, nonmajor statistics courses.
1.1 Motivation
From interacting with college students in our statistical literacy course, we observe that they frequently refer (orally and in written work) to an “average person,” a “random person,” etc. in a way that is incoherent, inconsistent, or inaccurate with respect to statistical meaning. Students in our course are assigned a team data collection project whose proposal includes the explicit instruction “Clearly describe your method for selection. Saying something vague like ‘we’ll just ask 50 average students’ or ‘50 random people’ is not clear and, besides, the word random refers to a process or procedure, not to a person!” and the evaluation rubric shared in advance specifically lists the word random as an example of statistics terms to be sure are used appropriately. And yet, more than a few project writeups turned in near the end of each semester still say something like “we surveyed 50 random people.” This motivated the first author to design and implement a survey to better understand the patterns and dynamics of this idiosyncratic usage in the hopes this understanding could later be used to develop more effective pedagogy or curriculum.
Mathematics educators have long noted that idiosyncratic usage cannot simply be dismissed as harmless because it can cause or reinforce content misconceptions. For example, Zazkis (Citation2010, p. 40) reports pre-service elementary school teachers asking “whether the number 14 could be considered as ‘evenly divisible’ by 2, because the division resulted in an odd number.” On a related note, van de Walle (Citation2007) argues against the phrase “reducing fractions [to ‘lowest terms’]” instead of “simplify” because the former may lead a student to think the fraction is becoming smaller in magnitude. Students who use the word “borrow” instead of “regroup” when performing a subtraction algorithm may not realize a fair trade is occurring. There are also words in statistics that may cause or reinforce misconceptions, as discussed later in Section 1. We now examine the situation of a student using a valid mathematics/statistics content word but having in mind a different meaning from that word’s use in an everyday context.
1.2 Lexical Ambiguity
The phrase “expected value” may lead students to imagine a likely value that they “expect” to happen (van Staden Citation2009). A “normal distribution” may make students think of a distribution that is “typical” rather than very special, and someone might say “He’s taller than normal for a three-year-old” when they simply mean “he’s taller than the average height of three-year-old boys” and may still be well within the range of what is “normal” (Utts Citation2015, p. 155). Students using the everyday meaning of “independent” as “separate” may (mis)represent “independent events” with a Venn diagram of disjoint circles (Kelly and Zwiers Citation1986).
Lexical ambiguity characterizes words with different meanings in different contexts, and this has been well-documented in statistics education, primarily through the work of collaborators led by Jennifer Kaplan (Kaplan, Fisher, and Rogness Citation2009, Citation2010; Kaplan, Rogness, and Fisher Citation2012, Citation2014). Kaplan, Fisher, and Rogness (Citation2009) share (in section 2 of their paper) how doing the first work on this topic in statistics education was informed by prior work in mathematics education and science education going back as far as Durkin and Shire (Citation1991). Others have explored lexical ambiguity using other terms, frameworks, or contexts.
Rangecroft (Citation2002) discusses and distinguishes among “statistical English,” “mathematical English,” and “ordinary English,” and such varieties of language are sometimes referred to as “registers,” such as when discussing bilingual learners (Lesser et al. Citation2013). For example, Jourdain and Sharma (Citation2016) note that significant has different meanings in ordinary English, mathematical English (e.g., significant digits), and statistical English (statistically significant results). Even within a statistics context, students may not always be able to tell when the phrase “significant result” refers to statistical significance or practical significance and Gephart, Jr. (Citation1988) discusses how the lay meaning of the term significant has contributed to the overuse of statistical significance tests among economists. Many strategies for helping emergent bilingual learners navigate lexical ambiguity and other language dynamics (Winsor Citation2007; Fischer and Perez Citation2008; Huang and Normandia Citation2008) are found helpful by all students.
A statistics word’s meaning may be different from, similar to, or have no counterpart to everyday usage. Lesser and Winsor (Citation2009, p. 8) states that the latter is the most challenging,
…consistent with the findings of Lavy and Mashiach-Eizenberg (Citation2009). The existence of these situations is acknowledged by Martynenko (Citation2003) and by the American Statistical Association ([ASA] Citation2005), one of whose goals for introductory statistics is that “Students should recognize that words such as ‘normal,’ ‘random,’ and ‘correlation’ have specific meanings in statistics that may differ from common usage.” Similarly, Beyth-Marom, Fidler, and Cumming (Citation2008) discuss ‘correlation.’
There is empirical evidence that statistics students allow everyday use (some of which may be considered slang) of a word to overshadow statistical use. In a 2008 pilot study, n = 67 (45 women, 22 men) students taking a statistics service course at a university in the southeastern United States were asked during the first week of class (before related instruction) to define five lexically ambiguous words (including average and random) and to use each one in a sentence (Kaplan, Fisher, and Rogness Citation2009). For each word, the statistical meaning was not the one most chosen by students and sometimes was chosen by almost no one; Kaplan, Fisher, and Rogness (Citation2010) found that about 16% of students continued to give a colloquial definition of average when asked for a statistical definition at the end of an introductory course.
Studying patterns of word usage can lead to improvements in curriculum or pedagogy and recommendations that address lexical ambiguity. For example, Kaplan and colleagues (Kaplan, Rogness, and Fisher Citation2012; Kaplan, Gabrosek, et al. Citation2014) found that everyday meanings of the word spread were associated with misconceptions (i.e., unduly fixating on whether a histogram is bumpy or smooth, and thinking that histograms must have less variability if they are smooth) that justified their recommendation to discontinue use of that word in statistics class and replace it with the word variability.
Kaplan, Rogness, and Fisher (Citation2014) found helpful a teaching experiment designed to exploit the lexical ambiguity of the word random, in which the teacher gave multiple-choice questions to activate students’ colloquial and statistical definitions for the word and then introduce a visual mnemonic (ibid, p. 13) with a hat and a rainbow zebra to reinforce those respective meanings. The colloquial use is illustrated by unexpectedly encountering people in rainbow zebra costumes on a street while statistical use is evoked by the hat ready to hold well-mixed slips of paper for a drawing with known probability structure.
Sometimes multiple meanings of words such as individuals and population might interfere with our paper’s “process, not person” theme if students confuse statistical measurements with the people from whom the measurements are taken. To assess this particular potential confusion, tell students “Suppose we measure heights of all 1000 students attending our school. What is the population in this context?” and see whether they answer “the 1000 measured heights” or instead “the 1000 students.” Finally, we note that distinguishing between person and process is not even trivial in everyday society, given that many Americans deny that systemic racism exists (Bartlett Citation2020) or view racism as simply isolated, rare actions by “bad apples” or “lone wolves.”
1.3 Goals and Situating the Study
The present study, informed by noticing frequent undue application of statistics terms to people, aims for insight into just how students view the phrases “average person,” “random person,” and “outlier person,” and to describe any possible patterns among phrases. We did not assume and do not claim these phrases are collectively exhaustive (e.g., we could have also included “normal person”) or equally problematic. We selected the phrases because we have observed them frequently in our classes, in society, or in the literature (see Appendix B from the appendices listed at the end of this section) and we want to go beyond anecdotal observation and get a more substantial sense of how and why students either use or reject them. The survey focused most on “average person” and “random person,” reflecting how: (a) those phrases seem so commonly used in everyday conversation, (b) those phrases may be inherently problematic (see Appendix B and Section 6.2), (c) “average” and “random” have been among words given the most attention in statistics education lexical ambiguity research (e.g., by Kaplan’s team), and (d) there may be connections between these “person” phrases and misconceptions involving statistics terms, leading us to wonder about questions such as these:
If a student views an “outlier person” as someone who should be ignored, would they also have the misconception that outlier values should always be ignored?
If a student is unduly attached to the representativeness heuristic (e.g.,Hirsch and O’Donnell Citation2001), would they think of a “random person” as needing to be representative of a population of people by having no traits that are unusual?
Are students who freely speak of an “average person” more likely to use the generic word “average” instead of specifying the most appropriate specific measure of center for a given data analysis context?
While the design/scope of our study does not allow us to give definitive answers to such questions, they arguably help make a plausible case for the importance of our focus.
We acknowledge that words or grammatical constructions sometimes shift over time from being viewed as nonstandard to being accepted (e.g., Lee Citation2019). In the present study, we seek to better understand how students view certain phrases that include a statistical term but where the full phrase may not be helpful in a statistics education context (unless made into a teaching moment). Thus, the present article is informed by, but differs from, the lexical ambiguity papers mentioned earlier because it involves phrases, not individual words. Another distinctive feature of the present article is that it uses phrases far more likely to be heard in an everyday or slang context than in any statistics textbook. A rare example of a study which involved phrases that are found in statistics textbooks is Lesser, Wagler, and Salazar (Citation2016), who interviewed students using a coin-flipping simulation applet to explore what they thought intact phrases such as “in the long run” and “longest run [of heads]” meant. That study suggested that knowing the meaning of individual common words (e.g., in, the, long, run) did not ensure that a student would understand a more conceptual and idiomatic phrase (“in the long run”) as an intact entity. Also, it turns out that even short phrases such as “at least” and “at most” give university students great difficulty (Nolan Citation2002), possibly because students rely unduly on a “key word” approach (Huang and Normandia Citation2008) and interpret “least” as “less than.”
Our article appears to be the first to investigate what person-oriented phrases such as “average person,” “random person,” and “outlier person” mean to students. For example, while there is empirical research (e.g., Kaplan, Gabrosek, et al. Citation2014) on how students interpret the word random, there appears to be none on the phrase random person. It is also worth noting that phrases such as “random person” (unlike “in the long run”) are generally not found in statistics textbooks, but instead are in everyday or slang speech by students and others. As a reflection of usage in society, the phrases “average person” and “random person” yield millions of hits in a Google search, followed by “anonymous person” and then “outlier person.” Some usage is slang, as reflected by the Urban Dictionary (urbandictionary.com) entries for “average guy,” “average lady,” “random person,” “outlier,” and “anonymous.”
In Section 2, we describe the setting and method for conducting the survey. Results and discussion are in Sections 3 and 4, respectively, followed by other considerations in Section 5. We conclude with Section 6, which includes practical suggestions for teaching as well as for future research. To keep the body of the paper streamlined, separate supplementary materials (consisting of the raw data, data tables, and coding) is posted as a separate link and these mnemonically-named Appendices are included before the References section of this article:
A for assessment instrument (the survey),
B for background on each phrase (for interested scholars),
C for coding (technical process details for researchers),
D for didactics (for instructors)
2 Method
2.1 Setting
The study was conducted in the southwestern United States at a mid-sized research university, where half the student population is first-generation and about 80% is Hispanic/Latinx. The study involved a multi-section, 15-week statistical literacy course that is required for several majors and is in the university’s Core Curriculum. The course has a prerequisite of intermediate algebra and its textbook is Utts (Citation2015). Due to the pandemic, all three fall 2020 sections of this course were offered online, using the Blackboard learning management system for course communications, assessments, content delivery, office hours, grade information, etc. All three sections were selected for this study and combined into a single dataset because those sections had the same syllabus, delivery modality (asynchronous), and instructor (the first author) with support from the same graduate teaching assistant (the second author).
2.2 Survey
The survey (package #1671835-1) was exempted from review by our institution’s IRB on October 22, 2020 by meeting Exemption category 45 CFR 46.104(d)(1) for research “conducted in established or commonly accepted educational settings, that specifically involves normal educational practices that are not likely to adversely impact students’ opportunity to learn required educational content or the assessment of educators who provide instruction.” No students under 18 years of age were surveyed due to IRB constraints. The survey was made available to the students in the Blackboard learning management system, using its built-in online Survey tool that automatically makes survey responses anonymous, a trait intended to help students feel comfortable answering honestly without worrying about revealing misconceptions. Also, the survey (Appendix A) avoided demographic questions to give students even further confidence that they could not be identified by their answers, and because we found no prior studies on this topic that gave reason to expect effects from demographic variables. Respondents saw full information about the survey to establish informed consent before they clicked a link to access the survey.
Designed to be completed within about 10 min, the survey consisted of 4 short essay items, 3 multiple-choice items (each with one choice allowed), and 4 multiple-answer items (each with multiple choices allowed). The short essay Items 1, 2, 3, and 8 ask students to give an example of the phrase or give a reason why the phrase does not make sense. Offering both options ensured students would not automatically assume the phrase was (not) valid. Items were displayed one-at-a-time without backtracking so that, for example, students would be forced to say whether or not a phrase made sense to them before they saw it used in a later item.
Having the survey available (November 29–December 2, 2020) during the penultimate week of the course allows it to be viewed as a baseline reading of usage by students who received only a modest level of explicit related instruction in the sense that they were exposed months earlier to project instructions (as noted in Section 1.1), but without real-time discussions to reinforce and discuss due to the course’s asynchronous online format. The survey window occurred shortly after students turned in data collection projects and seven weeks after the midterm exam (which included concepts of anonymity, random sampling, random assignment, outliers, and the mean).
Seventy-three of the 109 enrolled students (67.0%) completed the survey and received the promised modest reward of two extra points on their (noncumulative) finals-week exam. The obtained response rate is quite respectable for an asynchronous online course without regular meetings, and is higher than, for example, the typical percentage of students in such classes who complete end-of-course student evaluations. For an empirical benchmark of the latter, data reported this century from a variety of colleges around the world (e.g., Nulty Citation2008) indicates that course evaluations conducted online typically yield a response rate of only about 1/3. Our research study was not able to use certain strategies often suggested for boosting course evaluation participation rates such as offering class time to get it done (“class time” does not apply to asynchronous course sections).
Among the 73 respondents, there were virtually no instances of students skipping items: out of 73*11 = 803 opportunities for responses, only 4 were missing: 2 from one student and 1 each from two other students. While the survey did not collect demographic information, it was estimated (by entering respondents’ first names into R’s gender package https://www.r-project.org/nosvn/pandoc/gender.html that uses a 1970–2012 Census database) that about 80% of respondents are female, which is representative of the typical enrollment in this course, and only somewhat over the percentage in Kaplan, Fisher, and Rogness (Citation2009).
2.3 Data and Research Considerations
Our study incorporates many strategies (e.g., of Reid, Robinson, and Bunsen Citation1995) to bolster rigor, including peer debriefing, triangulation (of researcher), and (as part of an audit trail) allowing access to the deidentified raw data (https://figshare.com/s/17446709fafab15a55c2), the original survey questions (Appendix A), as well as details on our coding process in Appendix C and supplementary materials. Access to the deidentified data was provided at the time of original manuscript submission, rather than waiting until publication (Heyard and Held Citation2022). Readers less interested in those details may proceed now to the results.
Table 1 Rates at which students deemed phrases valid.
3 Results
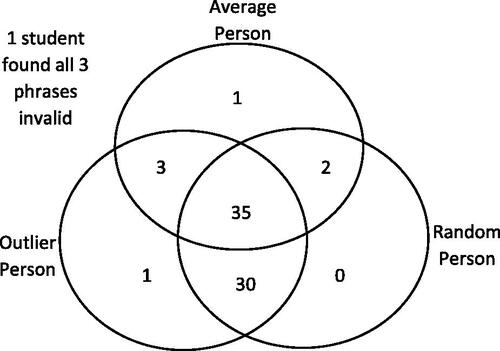
We begin this section with summary findings about the rate at which students find the phrases valid and then drill down by looking further at items related to one phrase at a time. From , we see that students are much more likely to find “outlier person” or “random person” to be valid than “average person.” (“Average pedestrian” is a special case of “average person” that will be discussed later in the section.) The Venn diagram in additionally shows that the biggest two-category intersection for Items 1–3 was finding both “outlier person” and “random person” to be valid. It also makes clear that it was rare for a student to find exactly one of the three phrases to be valid.
Fig. 1 Phrase(s) for Items 1–3 the n = 73 students found valid.
3.1 Outlier Person
This phrase appeared in only the open-ended Item 3. The modal code (“a person’s status as an outlier depends on their setting or on other people’s backgrounds”) had a relative frequency (16.7%) lower than the modal relative frequency for any of the other three open-ended items. Tabulated results of coding for this item (and the other open-ended items) are in an Excel file in this paper’s supplementary materials.
3.2 Random Person
When students were asked (Item 2) “Briefly state any example of a ‘random person’ (or state why you think that concept does not make sense),” the number of different codes (9) fitting their responses was the smallest among the survey’s four open-ended items. Most of the student responses fit one of these two codes: “someone you don’t know” or “did not use purposive sampling.” The open-ended Item 2 was complemented by two subsequent fixed-choice items also involving random. Items 9 and 10 each had students choose which of three sentences is/are good, and item approval rates are in .
Table 2 Rates of student approval (n = 73) for Items 9 and 10 statements related to random.
For Item 9, note that the ordering of statements by student approval rates was the opposite of the order of the researcher-rated degree of correctness, with more than twice as many students approving of the “worst” statement as of the “best” statement. The disaggregated breakdown shows the additional pattern that every person who found the best statement invalid found at least one of the inferior statements (usually the worst one) to be valid.
For Item 10, however, a large majority of the students approved the statement rated as best by the researchers and the smallest percentage of students approved the statement rated as worst. The disaggregated breakdown (see supplementary materials) shows 90% of the students who viewed “it was so random” as statistically invalid were able to (correctly) recognize the “pick one at random” statement as valid. This result contrasts with the finding that 64% of the students who rejected the “random people” usage did not embrace the best statement (“randomly selected people”).
3.3 Average Person
When asked (Item 1) “Briefly state any example of an ‘average person’ (or state why you think that concept does not make sense),” students gave a wide variety of responses, with no more than 10% of them falling into a single code category, except for 21% in the modal category which refers to observing that the idea of “average person” does not make sense because it ignores a person’s not-so-visible special or unusual traits.
The open-ended Item 1 was complemented by a subsequent item (Item 7) having students choose which of three statement(s) is/are valid and by Items 4–6 involving measures of location that students might associate with an average. The student approval rates for all three statements in Item 7 were very close together, with the percentage of students who approved of the statement using “average worker” (the only statement of the three rated by researchers as incorrect) being roughly the same (actually, very slightly more) as those that found “average person” to be valid in . A disaggregated breakdown showed that those who approved of that “average worker” statement had a uniform distribution in terms of whether or not they approved of either of the other two statements in Item 7.
focuses on the association between whether a student felt “average person” was a valid phrase (Item 1) with what statements in Item 7 the same student viewed as valid. Among those who found “average person” a valid phrase, the distribution remains fairly uniform, but there is a nonuniform pattern (with a slight majority favoring the “On average, a worker…” phrase) among those who found it an invalid phrase, and it is curious that nine people viewed “average person” as invalid but a phrase using “average worker” to be valid.
Table 3 Rated validity of average person versus phrases approved in Item 7.
Other fixed-choice items involving “average” were Items 4, 5, and 6, which solicited a measure of location for the word “average” with each context (). Items 4, 5, and 6 were each designed to have a “best” answer (denoted in boldface): the mean, mode, and median, respectively. Because Item 5 could also be a median and Item 6 could also be a mean, it may be unsurprising that only Item 4 had its best answer chosen by the majority (or even plurality) of students.
Table 4 Response rates (n = 73) by answer choices of Items 4, 5, and 6.
3.4 Average Pedestrian
Item 8 was an open-ended question to see if students who accepted the concept of “average person” might question it in a specific setting (pedestrian deaths) with a (bimodal) distribution where the application of a particular average (i.e., the mean) might not be optimal. Almost half of the student responses to Item 8 fit one of these codes: “40 is not a representative summary of the dataset (beyond just not being one of the values),” “40 is not a value in the data set,” and “average person is defined with a mean, and this is how a mean is calculated.”
From , we saw that students were more than twice as likely to find “average person” (or “average worker” in Item 7, for that matter) a valid concept than the specifically-contextualized “average pedestrian” phrase, which suggests that the role of context may be a factor. In (which omits answers that were mixed or unclear), we see the further pattern that a strong majority of students tended to find the “average pedestrian” example invalid whether or not they had previously indicated that “average person” was a valid concept.
Table 5 Association (n = 56) between average pedestrian and average person phrases.
3.5 Anonymous Person
This phrase appeared only in Item 11, where students chose which statement(s) is/are valid. The researchers independently agreed that (1) was the best (and only correct) statement, and ranked (2) above (3) because (3) could suggest that the survey conductors concealed their own identities (which an IRB would not allow) while (2) could possibly be interpreted as “students were anonymous to the person conducting the survey.” Of the four 3-statement items in the survey, this item’s statements had the strongest alignment between researcher ordering and student approval rates (see ). The disaggregated breakdown shows that most of the students who chose (1) chose only (1), a pattern that also happened on Item 10.
Table 6 Rates of student approval (n = 73) for Item 11 related to anonymous.
4 Discussion
4.1 Outlier Person
With only one survey item (Item 3), “outlier person” could use further exploration, especially in relation to other phrases in this study, such as whether the 40-year-old “average pedestrian” in Item 8 is seen as an “outlier person.” It is interesting to juxtapose “outlier person” with “average person” in the sense that the ecological fallacy occurs when we make inferences about an individual based on aggregate data (e.g., group mean), and the exception fallacy occurs when we make inferences about a group based on knowledge of a few exceptional individuals. Just as with an “average person,” it is important to see if or how students distinguish between applying the word outlier to the measurement value versus the person from which the measurement was taken. It would also be interesting to explore whether students who use “outlier person” are less likely to consider all options (modify, include, exclude) for handling an outlier datum. An unanticipated Item 3 finding is that 3 of the 73 students focused on lie/liar even though that has nothing to do with the meaning of outlier, despite the occasionally-heard phrase “out and out liar.” (It turns out the etymology of outlier referred to a person who lies outside a community’s norms, but this use of “lies” just means “stands/behaves/is” rather than telling falsehoods.)
4.2 Random Person
The majority of open-ended responses for Item 2 seemed consistent with an everyday or popular culture meaning of “random.” It is also striking and concerning that the clear researcher-rated best use of the word was seen as valid by only 48% of the students. In addition to concerns about this term in its own right, we suggest looking at possible connections among words to the extent that the rationale for not saying “random person” may also be a rationale for not saying “anonymous person” (at least one student team’s project proposal mentioned surveying a certain number of “anonymous students”) because a person is not inherently anonymous or confidential – those words describe the survey method.
4.3 Average Person (Item 1), Average Pedestrian (Item 8), Average (Items 4–7)
The concept of “average person” or “average type of person” seems ingrained in our society, used even by highly educated people. Few people seem aware of how the construct may fall apart in specific real-world situations (as discussed in Appendix B) and even if they were, they might find the (idealized) concept too convenient to abandon. And yet, the phrase has many more meanings to students and much less of a consensus than random person. The fact that students did not really distinguish among the statements of Item 7 may suggest that they viewed the distinctions as just a matter of semantics but not of meaning.
The level of student agreement with the abstract concept of “average person” seems supported by students’ high performance on “average household size” (Item 4). With Items 4, 5, and 6, the modal student answer was always the mean even though it was the clear best answer only once (i.e., on Item 4). This could be due to a general student tendency, independent of context, to assume mean is the primary or most likely measure of center intended when the word average is used, as reflected in familiar contexts ranging from college GPA to Excel’s AVERAGE function.
With respect to Item 7, if students hadn’t considered average person to be a valid phrase, one would expect that they also would not have considered average worker to be valid. Now, in statement (1), the word average is used to describe the salary and worker is used to describe whose salary it is. Perhaps student approval rates were about the same (though slightly lower) for (1) as for (3) because both statements involved the placement of the word average directly before worker.
Perhaps (1) would have had a higher rate of approval without the word “worker.” We note that “average worker salary” would clearly be better than “average worker’s salary” or than “worker’s average salary.” Perhaps a practice that would help make explicit to students that the adjective average is referring not to the noun worker, but to the noun salary, is to use a hyphen (i.e., average worker-salary) or perhaps to say “average work salary.”
We now move from “average worker” to “average pedestrian.” A particularly substantial student comment about whether “average pedestrian” was valid was:
“No, it would not be reasonable. While 40 may be the numerical average of the ages added up together and then devided [sic] by the number of individuals, it is not an accurate reflection of the contexts in which pedestrian fatalities occur. As stated by the prompt itself, pedestrian deaths are more likely to be the elderly (due to failing vision, hearing, or slower reflexes) and children (who are smaller and harder to see, and not able to accurately estimate the speed and distance of a car.) To utilize the numerical average would not only be unreasonable, but also disingenious [sic].”
This student’s response, while stating that the numerical average is 40, completely rejects that the average adequately represents this distribution and gives thoughtful and detailed reflection on the context. In general, however, students may have struggled with Item 8 because it forced reflecting on two modes, while most students focused on the mean as the measure of center in Items 4, 5, and 6 whether or not it was the most appropriate measure of location.
4.4 Anonymous Person
Only Item 11 related to “anonymous person,” so this phrase would also benefit from further exploration. While it is encouraging that roughly three-quarters of the students approved of the statement that best applied anonymous to the survey, it is discouraging that roughly half of the students approved of the phrase “anonymous students” and almost one-third approved of a survey being conducted anonymously. This also brings up the importance of distinguishing between person and process. Students are not inherently anonymous, researchers are not inherently anonymous, but a survey can be conducted with a process that makes responses anonymous in relation to others. Perhaps it would be helpful in future research or teaching to leverage the unpacking of a similar phrase such as “anonymous donor” where the word anonymous ultimately describes a particular action or process rather than being a permanent characteristic of a person.
5 Other Possible Considerations
5.1 Identifying Variables
While distinguishing a measurement from the person from which it is taken may seem pedantic semantics, it may have implications for student learning. For example, it may yield or at least be associated with a lack of clarity when students identify variables. Students at this institution were given a writing assignment that included naming the variables in an experiment (Begley Citation2009) where scientists dressed a newborn in gender-neutral clothes, misled adults about the baby’s sex, and had adults describe the baby’s emotional state. Many students just stated “babies” as the explanatory variable instead of something more specific like “perceived gender of baby.”
5.2 Agency
A major citation style guide (APA Citation2020, p. 118) advises that “many writers overuse the passive voice. Use the active voice as much as possible to create direct, clear, and concise sentences. For example, use the active voice to describe the actions of participants and others involved in your study…” Active voice seems well-suited for writing about statistics to make more explicit that a researcher formulated a hypothesis, checked assumptions, and made any of the many decisions that go on behind the scenes that involve the assembly of statistics (Huberty Citation2000; Best Citation2002; Schield Citation2010). An active voice approach would seem to support discouraging the use of “random person” (a phrase which deemphasizes that a researcher chose a process with random selection) or “outlier person” (a phrase which deemphasizes that there was a researcher who chose a criterion to flag an observed value as an outlier).
5.3 Undue Personalization
While making a personal connection with a statistical context can motivate students, Smucker and Manouchehri (Citation2020, p. 1) caution that “when students engage with the context too personally, they may also make assumptions that are not supported by statistical evidence (Watson Citation2007). Students may focus so closely on the story behind data that they prefer making conclusions based on their informal knowledge of the data’s context over patterns in the data itself (Pfannkuch Citation2011; Ben-Zvi et al. Citation2012; Biehler et al. Citation2018).” While this comment was made while discussing a teaching experiment involving third-graders, it is clear that personalization also results in various pitfalls with adult learners, such as the availability heuristic, conjunction fallacy, or forgotten base rates (see Utts Citation2015), confusion between the famous birthday problem (“any two people match”) and the birthmate problem (“someone matches with me”), or the inability to have an aggregate view of data instead of, say, a case value view (Konold et al. Citation2015).
5.4 Diversity, Equity, and Inclusion (DEI)
Language choices have DEI implications, and DEI considerations can influence what language gets used. As an example of the latter, Lee (Citation2019) gives an example (involving “they”) how a major style guide (APA Citation2020) recommends new language/grammar to reflect more evolved understandings of gender and gender identity. In recent decades, many people and organizations have moved from identity-first language to person-first language as the former can be perceived as reducing a person to (or describing their identity with) a single trait. Supporting research includes a pseudorandomized experiment where surveyed Brazilian teenagers responded with a substantially more negative perception, attitude and stigma if they received the version that used the term “epileptics” instead of the phrase “people with epilepsy” (Fernandes, De Barros, and Li Citation2009). And so, it is not unreasonable to imagine the phrase “average person” being viewed differently than “person with certain measurements being near the average.”
Teachers should be careful in situations where a student’s body measurement might be an outlier. For example, we would not collect data on students’ own weights (even if done at home; Bargagliotti et al. Citation2020, p. 89), lest a student be singled out. The “outlier person” idea can also be problematic from its association with eugenics to identify a race as superior or inferior or from the “model minority” trope often applied to Asian-Americans.
DEI sensibilities arguably affirm that “no one is an average person” and that educational admissions or assessment systems designed for the “average student” may therefore be inaccurate or even unjust for many students. Rose (Citation2016, pp. 29–30) warns us that the concept of an “average man” as a type of person validates “people’s natural urge to stereotype others.”
Beyond that general warning against essentializing, there are concrete issues that connect more explicitly to the practice of statistics. Assuming that some “average person” concept can cover everyone may be problematic, given that it was not so long ago that medical studies in the United States commonly enrolled only college-aged white males (for history of the gender angle, see Liu and DiPietro Mager Citation2016) and that the United States is still struggling as a society to grapple with what it means to provide equal protection under the law to all. For example, because most people in the US are not Black, one might say the “average American” is not a Black person, so will Black students feel included by discussions that refer to an “average person”? That said, a more complex discussion of this topic is needed because there can be statistical reasons why some researchers might continue to target a limited range of participants for studies. For example, Hulsizer and Woolf (Citation2009) note that researchers may use homogeneous, less-diverse populations in order to obtain high internal validity and therefore make a stronger case for causality. Since many view racism as nonsystemic (Bartlett Citation2020) isolated, rare acts by “bad apples” or “lone wolves,” it could be interesting for students to reflect on possible parallels with our “person vs. process” distinctions.
6 Concluding Thoughts
6.1 Suggestions for Future Research
Because our survey was not designed to disaggregate responses by demographic variables (nor does any published study that we have seen on language in statistics), another future direction is to see if there are demographic differences in how phrases are used. Because social science researchers have identified gender differences in language use (e.g., Newman et al. Citation2008), a future study could investigate, for example, whether females are more likely than males to find valid the phrase “random person.”
A future survey could investigate relationships between student views of these phrases and their performance on content items from the ARTIST collection (https://apps3.cehd.umn.edu/artist/) on randomness, means, outliers, etc. Or one could see if students whose objection to “average pedestrian fatality” is that the mean (40) was not in the data would also be less likely to know the conceptual property that the mean need not be a value in the dataset (Strauss and Bichler Citation1988). Other items could address the questions raised in the first paragraph of Section 1.3, because there are certainly assessment items to detect reliance on, for example, the representativeness heuristic (Dashley Citation2010). Also, one could see if confusion between person and process relates to other documented misconceptions such as students viewing “males” and “females” as separate measurement variables instead of two of the possible values of the categorical variable “gender” (Lesser Citation2013).
Another future direction is to develop (and validate) an instrument with closed-form items whose choices include usage based on common misconceptions, starting in the direction of Items 7, 9, 10, and 11, such as the “white Christian females” item in Appendix D. This instrument could be used in a randomized experiment to see which of two educational approaches results in better use of language and better success in avoiding misconceptions about embedded statistical terms, as measured by related ARTIST items. Such evidence could then, in turn, inform the writing of curriculum, etc.
A pitfall to address in any future survey is that while incorrect usage may reveal some type of misconception, correct usage may still conceal one. For example, just because a student uses a correct phrase for random in, say, Item 9 or Item 10 does not mean they have full understanding of the statistical meaning because they may have in mind the slang meaning of “haphazard” and think that “randomly selected” means that the researcher was haphazardly choosing people (or cards). So, for example, when students give an answer to Item 9, they could be asked a follow-up question about which of these statements is the closest equivalent: “we casually selected….”, “we haphazardly selected….”, or “we used a probability-based tool to select….”. In this sense, an educator must be informed by the results of both our phrases study and the (e.g., Kaplan, Gabrosek, et al. Citation2014) study of the individual statistics word within the phrase. (Another way to better get at what respondents have in mind, of course, would be to do an interview.)
While we kept the survey short to make a respectably high response rate more likely, we also acknowledge that it could have been insightful to have more items for the phrases “outlier person” and “anonymous person.” A future study could also explore the phrase “normal person,” “independent person” (i.e., someone who has their separate identity, income, housing, etc., though independent events cannot be separate/disjoint) or “biased person” who consistently overestimates some quantity for reasons that may or may not be due to personal prejudice/bias.
6.2 Recommendations for Pedagogical Trajectories
Appendix D offers specific sequences of strategies for each phrase considered in this study and readers are strongly encouraged to reflect on these strategies. For now, we make two general observations that cut across the phrases, and these observations draw from results of our study, reflections inspired by the process of doing this study, and our respective teaching experiences. First, we agree with the advice of Lavy and Mashiach-Eizenberg (Citation2009, p. 8) for individual words: “When presenting a new statistical concept informally in class, a discussion in which the relation between the concepts’ meaning in statistics and its meaning in everyday use should be initiated. Namely, nuances comprising the new concepts, both in their everyday use and in their statistical meaning, need to be compared and discussed.”
Our second observation is that our theme of applying statistics terms to a process (or trait), not a person, should be connected to getting students to think beyond specific individuals and outcomes to an underlying process or distribution. That goal is reflected in recent statements such as “Simply put, randomization is a process, not an outcome.” (Owora et al. Citation2022, p. 21) or in claiming a weather or election forecast was not necessarily “wrong” just because the outcome did not match the model’s prediction this time. An understanding of a random variable or process is needed for the Pre-K-12 GAISE Report II’s objective to identify possible outcomes of a random variable and what it means for a particular outcome to be “plausible or not plausible compared to chance variation” (pp. 19, 76). This seems consistent with trying to get students beyond the lowest (i.e., nonstatistical) level of statistical understanding described by Shaughnessy (Citation1992, p. 485) as “responses based on beliefs, deterministic models, causality, or single outcome expectations; no attention to or awareness of chance or random events.” Section 6.3 suggests alternative phrasings.
6.3 Last Thoughts
This paper is not the final word, but rather the raising of questions to spark dialogue and teaching moments, and offering practical suggestions to consider for statistics curriculum and instruction. Addressing cases where these phrases come up may not only sharpen statistical conceptual knowledge but also reinforce institutional DEI objectives (see Section 5.4).
Less preferable wordings can be improved with little or no increase in word count. “We surveyed 10 random people.” can become “We surveyed 10 randomly selected people.” and “The outlier person was 7 tall.” can become “The outlier height was 7
. ” Rewriting average person may have more options since “The average male is 6
tall.” could be changed to one of these:
The average male-height is 6;
The average height of males is 6;
The average of male heights is 6;
Males’ average height is 6; or
Men’s average height is 6.
We note that using a switched order of words such as “male average height” instead of “average male height” might go against the widely (even if not consciously) used grammatical principle known as “the rule of ablaut reduplication” for multiple adjectives.
By having our language reinforce that statistics is a process, not just a product, we hopefully reinforce that statistics is not a recipe, but an active endeavor where assumptions are named (and checked), context is considered, methodology is selected (and justified), etc. (More rationale for avoiding product-over-process language is given by Waller and Marzocchi Citation2020 and Sfard Citation2008.) By empowering students to critique phrases such as “average person” or “random person,” we position them not only for more careful use of language but also for deeper understanding of statistics content.
Supplementary Materials
Supplementary materials include the deidentified raw data, tabulations of student responses to the survey’s open-ended and closed items, and the codebook and coding process.
Supplemental Material
Download Zip (139.8 KB)Acknowledgments
The authors appreciate the excellent feedback from the journal editors and referees, as well as from the peer debriefers in the first author’s spring 2021 graduate course in qualitative research methods.
References
- American Psychological Association (APA). (2020), Publication Manual of the American Psychological Association (7th ed.), Washington, DC: APA. DOI: 10.1037/0000165-000.
- American Statistical Association. (2005), “Guidelines for Assessment and Instruction in Statistics Education: GAISE College Report,” available at https://www.amstat.org/docs/default-source/amstat-documents/2005gaisecollege_full.pdf
- Artigli, G. G., Gualano, B., Franchini, E., Scagliusa, F. B., Takesian, M., Fuchs, M., et al. (2010), “Prevalence, Magnitude, and Methods of Rapid Weight Loss Among Judo Competitors,” Medicine and Science in Sports and Exercise, 42, 436–442. DOI: 10.1249/MSS.0b013e3181ba8055.
- Bargagliotti, A., Franklin, C., Arnold, P., Gould, R., Johnson, S., Perez, L., and Spangler, D. A. (2020), Pre-K-12 Guidelines for Assessment and Instruction in Statistics Education II (GAISE II): a Framework for Statistics and Data Science Education, Alexandria, VA: American Statistical Association. https://www.amstat.org/asa/files/pdfs/GAISE/GAISEIIPreK-12_Full.pdf
- Bartlett, B. (2020), “The Right’s Farcical Denial of Systemic Racism,” available at https://newrepublic.com/article/159589/conservatives-systemic-racism-denial
- Bauer, L., and Calude, A. S. (2020), Questions about Language: What Everyone Should Know about Language in the 21st Century, New York: Routledge.
- Begley, S. (2009), “Pink Brain, Blue Brain: Claims of Sex Differences Fall Apart,” Newsweek, 154, 28.
- Behara, D. N., and Das, B. (2012), “Structural Anthropometric Measurements of the Canadian Adult Population: The Fallacy of the ‘Average Person’ Concept,” Theoretical Issues in Ergonomics Science, 13, 380–392. DOI: 10.1080/1463922X.2010.505271.
- Ben-Zvi, D., Aridor, K., Makar, K., and Bakker, A. (2012), “Students’ Emergent Articulations of Uncertainty while Making Informal Statistical Inferences,” ZDM Mathematics Education, 44, 913–925. DOI: 10.1007/s11858-012-0420-3.
- Best, J. (2002), “People Count: The Social Construction of Statistics,” in Proceedings of the Joint Statistical Meetings, Section on Statistical Education, Alexandria, VA: American Statistical Association. http://statlit.org/pdf/2002BestASA.pdf
- Beyth-Marom, R., Fidler, F., and Cumming, G. (2008), “Statistical Cognition: Towards Evidence-based Practice in Statistics and Statistics Education,” Statistics Education Research Journal, 7, 20–39. https://iase-web.org/documents/SERJ/SERJ7(2)_Beyth-Maron.pdf DOI: 10.52041/serj.v7i2.468.
- Biehler, R., Frischemeier, D., Reading, C., and Shaughnessy, J. M. (2018), “Reasoning about Data,” in International Handbook of Research in Statistics Education, eds. D. Ben-Zvi, J. Garfield, and K. Makar, pp. 139–193, Cham, Switzerland: Springer International.
- Bowen, C. M. K. (2022), “The Art of Data Privacy,” Significance, 19, 14–19. DOI: 10.1111/1740-9713.01608.
- Campos, M. M. (2006), “Finding the Most Typical Record in a Group,” available at https://oracledmt.blogspot.com/2006/07/finding-most-typical-record-in-group.html
- Carpenter, T. P., Dossey, J. A., and Koehler, J. L., eds. (2004), Classics in Mathematics Education Research, Reston, VA: National Council of Teachers of Mathematics.
- Choudhury, D. R., and Das, M. N. (1992), “Use of Combinatorics for Unique Detection of Unknown Numbers of Outliers Using Group Tests,” Sankhyā: The Indian Journal of Statistics, Series B, 54, 92–99.
- Cleveland, W. S. (1994), The Elements of Graphing Data, Murray Hill, NJ: AT&T Bell Laboratories.
- Dashley, T. K. (2010), “Using Prediction And Classroom Voting Via Clickers To Address Secondary School Students’ Overreliance On The Representativeness Heuristic,” unpublished master’s thesis, The University of Texas at El Paso. Open Access Theses & Dissertations. 2667.
- Durkin, K., and Shire, B. (1991), “Lexical Ambiguity in Mathematical Contexts,” in Language in Mathematical Education: Research and Practice, eds. K. Durkin and B. Shire, pp. 71–84, Philadelphia, PA: Open University Press.
- Fernandes, P. T., De Barros, N. F., and Li, L. M. (2009), “Stop Saying Epileptic,” Epilepsia, 50, 1280–1283. DOI: 10.1111/j.1528-1167.2008.01899.x.
- Fischer, J., and Perez, R. (2008), “Understanding English through Mathematics: A Research-based ELL Approach to Teaching All Students,” Research Monograph of TODOS, 1, 43–58. https://www.todos-math.org/assets/documents/Monographs/1.monograph1new.pdf
- GAISE College Report ASA Revision Committee. (2016), “Guidelines for Assessment and Instruction in Statistics Education: College Report 2016,” available at https://www.amstat.org/education/gaise/
- Gephart, R. P. Jr., (1988), Ethnostatistics: Qualitative Foundations for Quantitative Research, Newbury Park, CA: Sage Publications.
- Gladwell, M. (2008), Outliers: The Story of Success, New York: Little, Brown and Company.
- Good, T. L., and Grouws, D. A. (1979), “The Missouri Mathematics Effectiveness Project: An Experimental Study in Fourth-Grade Classrooms,” Journal of Educational Psychology, 71, 355–362. DOI: 10.1037/0022-0663.71.3.355.
- Hanel, P. H. P., and Vione, K. C. (2016), “Do Student Samples Provide an Accurate Estimate of the General Public?,” PLoS One, 11, e0168354-10. DOI: 10.1371/journal.pone.0168354.
- Hemenway, D. (1982), “Why Your Classes are Larger than Average,” Mathematics Magazine, 55, 162–164. DOI: 10.2307/2690083.
- Henrich, J., Heine, S. J., and Norenzayan, A. (2010), “The Weirdest People in the World?,” Behavioral and Brain Sciences, 33, 61–83. DOI: 10.1017/S0140525X0999152X.
- Heyard, R., and Held, L. (2022), “When Should Data and Code Be Made Available?,” Significance, 19, 4–5. DOI: 10.1111/1740-9713.01623.
- Hirsch, L. S., and O’Donnell, A. M. (2001), “Representativeness in Statistical Reasoning: Identifying and Assessing Misconceptions,” Journal of Statistics Education, 9, 1–22. DOI: 10.1080/10691898.2001.11910655.
- Holmes, P. (2006), “iPod Shuffle not Random,” Teaching Statistics, 28, 71–74. DOI: 10.1111/j.1467-9639.2006.00253.x.
- Huang, J., and Normandia, B. (2008), “Comprehending and Solving Word Problems in Mathematics: Beyond Key Words,” in Reading in the Secondary Content Areas, eds. Z. Fang and M. Schleppegrell, pp. 64–83, Ann Arbor, MI: The University of Michigan Press.
- Huberty, C. J. (2000), “Judgment in Quantitative Research,” The Mathematics Educator, 10, 5–10.
- Huck, S. W. (2012), Reading Statistics and Research (6th ed.), Boston: Pearson.
- Hulsizer, M. R., and Woolf, L. M. (2009), A Guide to Teaching Statistics: Innovations and Best Practices, Chichester, UK: Wiley-Blackwell.
- Jourdain, L., and Sharma, S. (2016), “Language Challenges in Mathematics Education: A Literature Review,” Waikato Journal of Education, 21, 43–56. DOI: 10.15663/wje.v21i2.269.
- Kader, G., Franklin, C., Jacobbe, T., and Maddox, K. (2020), “How Long Are the Words in the Gettysburg Address?” Statistics Teacher, available at https://www.statisticsteacher.org/2020/11/12/gettysburg-address/
- Kaplan, J. J., Fisher, D. G., and Rogness, N. T. (2010), “Lexical Ambiguity in Statistics: How Students Use and Define the Words: Association, Average, Confidence, Random and Spread,” Journal of Statistics Education, 18, 1–22. DOI: 10.1080/10691898.2010.11889491.
- Kaplan, J. J., Fisher, D. G., and Rogness, N. T. (2009), “Lexical Ambiguity in Statistics: What Do Students Know about the Words Association, Average, Confidence, Random, and Spread?,” Journal of Statistics Education, 17, 1–19. DOI: 10.1080/10691898.2009.11889535.
- Kaplan, J. J., Gabrosek, J. G., Curtiss, P., and Malone, C. (2014), “Investigating Student Understanding of Histograms,” Journal of Statistics Education, 22, 1–30. DOI: 10.1080/10691898.2014.11889701.
- Kaplan, J. J., Rogness, N. T., and Fisher, D. G. (2012), “Lexical Ambiguity: Making a Case Against Spread,” Teaching Statistics, 34, 56–60. DOI: 10.1111/j.1467-9639.2011.00477.x.
- Kaplan, J. J., Rogness, N. T., and Fisher, D. G. (2014), “Exploiting Lexical Ambiguity to Help Students Understand the Meaning of Random,” Statistics Education Research Journal, 13, 9–24. https://iase-web.org/ojs/SERJ/article/view/296/196. Also see https://qubeshub.org/community/groups/hilt_statistics/activity_page/zebra_hat
- Kelly, I. W., and Zwiers, F. W. (1986), “Mutually Exclusive and Independence: Unravelling Basic Misconceptions in Probability Theory,” in Proceedings of the Second International Conference on Teaching Statistics, eds. R. Davidson and J. Swift, pp. 96–100. Available at https://iase-web.org/documents/papers/icots2/Kelly.Zwiers.pdf
- Konold, C., Higgins, T., Russell, S. J., and Khalil, K. (2015), “Data Seen Through Different Lenses,” Educational Studies in Mathematics, 88, 305–325. DOI: 10.1007/s10649-013-9529-8.
- Kouritzin, M. A., Newton, F., Orsten, S., and Wilson, D. C. (2008), “On Detecting Fake Coin Flip Sequences,” IMS Colleges Markov Processes and Related Topics: A Festschrift for Thomas G. Kurtz, 4, 107–122.
- Kramer, S. (2020), “The ‘Class Size Paradox’: How Individual- and Group-Level Perspectives Differ, and Why It Matters in Research,” available at https://medium.com/pew-research-center-decoded/the-class-size-paradox-how-individual-and-group-level-perspectives-differ-and-why-it-matters-b62071f4e909
- Lavy, I., and Mashiach-Eizenberg, M. (2009), “The Interplay between Spoken Language and Informal Definitions of Statistical Concepts,” Journal of Statistics Education, 17, 1–9. DOI: 10.1080/10691898.2009.11889502.
- Lee, C. (2019), “Welcome, Singular ‘They’, “American Psychological Association blogpost. Available at https://apastyle.apa.org/blog/singular-they
- Lesser, L. (2013), “Using Context to Classify Variables,” Teaching Statistics, 35, 29–31. DOI: 10.1111/j.1467-9639.2012.00527.x.
- Lesser, L., Wagler, A., Esquinca, A., and Valenzuela, M. G. (2013), “Survey of Native English Speakers and Spanish-Speaking English Language Learners in Tertiary Introductory Statistics,” Statistics Education Research Journal, 12, 6–31. https://iase-web.org/ojs/SERJ/article/view/302 DOI: 10.52041/serj.v12i2.302.
- Lesser, L., Wagler, A., and Salazar, B. (2016), “Flipping Between Languages? An Exploratory Analysis of the Usage by Spanish-Speaking English Language Learner Tertiary Students of a Bilingual Probability Applet,” Statistics Education Research Journal, 15, 145–168. DOI: 10.52041/serj.v15i2.245.
- Lesser, L., and Winsor, M. (2009), “English Language Learners in Introductory Statistics: Lessons Learned from an Exploratory Case Study of Two Pre-service Teachers,” Statistics Education Research Journal, 8, 5–32. https://iase-web.org/ojs/SERJ/article/view/393 DOI: 10.52041/serj.v8i2.393.
- Levitin, D. (2018), A Field Guide to Lies: Critical Thinking in the Information Age, London: Penguin.
- Liu, K. A., and DiPietro Mager, N. A. (2016), “Women’s Involvement in Clinical Trials: Historical Perspective and Future Implications,” Pharmacy Practice, 14, 1–9. DOI: 10.18549/PharmPract.2016.01.708.
- Martin, D. B. (2009), “Does Race Matter?,” Teaching Children Mathematics, 16, 134–139. DOI: 10.5951/TCM.16.3.0134.
- Martynenko, G. (2003), “Semiotics of Statistics,” Journal of Quantitative Linguistics, 10, 105–115. DOI: 10.1076/jqul.10.2.105.16712.
- Newman, M. L., Groom, C. J., Handelman, L. D., and Pennebaker, J. W. (2008), “Gender Differences in Language Use: An Analysis of 14,000 Text Samples,” Discourse Processes, 45, 211–236. DOI: 10.1080/01638530802073712.
- Nolan, V. (2002), “Influence of Attitude towards Statistics, English Language Ability and Mathematical Ability in the Subject Quantitative Techniques at the Vaal Triangle Technikon, South Africa,” in Proceedings of the Sixth International Conference on Teaching Statistics: Developing a Statistically Literate Society, Cape Town, South Africa, ed. B. Phillips, Voorburg, The Netherlands: International Statistical Institute. https://iase-web.org/documents/papers/icots6/8a5_nola.pdf
- Nulty, D. D. (2008), “The Adequacy of Response Rates to Online and Paper Surveys: What Can Be Done?”, Assessment & Evaluation in Higher Education, 33, 301–314. DOI: 10.1080/02602930701293231.
- Owora, A. H., Dawson, J., Gadbury, G., Mestre, L. M., Pavela, G., Mehta, T., Vorland, C. J., Xun, P., and Allison, D. B. (2022), “Randomisation Can Do Many Things – But It Cannot ‘Fail’,” Significance, 19, 20–23. DOI: 10.1111/1740-9713.01609.
- Parker, M. (2020), “Does the Average Person Exist?”, available at https://www.youtube.com/watch?v=NbiveCNBOxk
- Perkins, K. K., and Wieman, C. E. (2005), “The Surprising Impact of Seat Location on Student Performance,” The Physics Teacher, 43, 30–33. DOI: 10.1119/1.1845987.
- Peterson, R. A. (2001), “On the Use of College Students in Social Science Research: Insights from a Second-Order Meta-Analysis,” Journal of Consumer Research, 28, 450–461. DOI: 10.1086/323732.
- Pfannkuch, M. (2011), “The Role of Context in Developing Informal Statistical Inferential Reasoning: A Classroom Study,” Mathematical Thinking and Learning, 13, 27–46. DOI: 10.1080/10986065.2011.538302.
- Rampell, C. (2011), “Discovered: The Happiest Man in America” The New York Times, March 5. Available at https://economix.blogs.nytimes.com/2011/03/07/the-happiest-man-in-america-annotated/ or https://www.nytimes.com/2011/03/06/weekinreview/06happy.html
- Rangecroft, M. (2002), “The Language of Statistics,” Teaching Statistics, 24, 34–37. DOI: 10.1111/1467-9639.00080.
- Raper, S. (2017), “The Shock of the Mean,” Significance, 14, 12–17. DOI: 10.1111/j.1740-9713.2017.01087.x.
- Reid, D. K., Robinson, S. J., and Bunsen, T. D. (1995), “Empiricism and Beyond: Expanding the Boundaries of Special Education,” Remedial and Special Education, 16, 131–141. DOI: 10.1177/074193259501600302.
- Roe, M., Shin, H., Ukkusuri, S., Blatt, A., Majka, K., et al. (2010), “The New York City Pedestrian Safety Study and Action Plan Technical Supplement,” New York City Transportation Dept. Available at https://www.nyc.gov/html/dot/downloads/pdf/nyc_ped_safety_study_action_plan_technical_supplement.pdf
- Rose, T. (2016), The End of Average: How We Succeed in a World That Values Sameness, New York: HarperOne.
- Scheaffer, R. L., Watkins, A., Gnanadesikan, M., and Witmer, J. A. (1996), “Random Rectangles,” in Activity-Based Statistics, New York: Springer. DOI: 10.1007/978-1-4757-3843-8_21.
- Schield, M. (2010), “Assessing Statistical Literacy: Take CARE,” in Assessment Methods in Statistical Education: An International Perspective, eds. P. Bidgood, N. Hunt, and F. Joliffe, pp. 133–152, Chichester, UK: Wiley.
- Schield, M. (2021), Statistical Literacy 2021B: Seeing the Story behind the Statistics, Instant Publisher. http://www.statlit.org/Schield.htm
- Sfard, A. (2008), Thinking as Communicating: Human Development, the Growth of Discourses, and Mathematizing, New York: Cambridge University Press.
- Shaughnessy, J. M. (1992), “Research in Probability and Statistics: Reflections and Directions,” in Handbook of Research on Mathematics Teaching and Learning, ed. D. A. Grouws, New York: Macmillan, pp. 465–494.
- Smucker, K., and Manouchehri, A. (2020), “The Impact of Self-Collected Data on Students’ Statistical Analysis,” in Mathematics Education across Cultures: Proceedings of the 42nd Meeting of the North American Chapter of the International Group for the Psychology of Mathematics Education, eds. A. I. Sacristán, J. C. Cortés-Zavala, and P. M. Ruiz-Arias, pp. 1336–1340, Mexico. Cinvestav/AMIUTEM/PME-NA. https://pmena2020.cinvestav.mx/Portals/pmena2020/Proceedings/PMENA42-BRR-1655452-Smucker-et-al.pdf DOI: 10.51272/pmena.42.2020-205.
- Sternin, J., Sternin, M., and Pascale, R. (2010), The Power of Positive Deviance: How Unlikely Innovators Solve the World’s Toughest Problems, Cambridge, MA: Harvard Business Press.
- Stigler, S. M. (1990), The History of Statistics: The Measurement of Uncertainty before 1900, Cambridge, MA: Harvard University Press.
- Stigler, S. M. (1999), Statistics on the Table: The History of Statistical Concepts and Methods, Cambridge, MA: Harvard University Press.
- Strauss, S., and Bichler, E. (1988), “The Development of Children’s Concepts of the Arithmetic Average,” Journal for Research in Mathematics Education, 19, 64–80. DOI: 10.5951/jresematheduc.19.1.0064.
- Triola, M. F. (2010), Elementary Statistics (11th ed.), Boston, MA: Addison-Wesley.
- Ulbrich, C. (2018), “Totally Average Woman,” available at https://CAUSEweb.org/cause/resources/fun/songs/totally-average-woman
- Utts, J. M. (2015), Seeing through Statistics (4th ed.), Stamford, CT: Cengage.
- van de Walle, J. (2007), Elementary and Middle School Mathematics: Teaching Developmentally (6th ed.), Boston, MA: Pearson.
- van Staden, P. J. (2009), “Improbable versus Unexpected Outcomes,” Teaching Statistics, 31, 90–90. DOI: 10.1111/j.1467-9639.2009.00393.x.
- Vogt, W. P. (2007), Quantitative Research Methods for Professionals, Boston, MA: Pearson.
- Waller, P. P., and Marzocchi, A. S. (2020), “From Rules that Expire to Language that Inspires,” Mathematics Teacher: Learning and Teaching PK-12, 113, 544–550. DOI: 10.5951/MTLT.2019.0178.
- Wang, T. V., Potter van Loon, R. J. D., van den Assem, M. J., and van Dolder, D. (2016), “Number Preferences in Lotteries,” Judgment and Decision Making, 11, 243–259. DOI: 10.1017/S1930297500003089.
- Watson, J. M. (2007), Statistical Literacy at School: Growth and Goals, New York: Routledge.
- Wilensky, U. (1995), “Paradox, Programming, and Learning Probability: A Case Study in a Connected Mathematics Framework,” The Journal of Mathematical Behavior, 14, 253–280. DOI: 10.1016/0732-3123(95)90010-1.
- Winsor, M. S. (2007), “Bridging the Language Barrier in Mathematics,” The Mathematics Teacher, 101, 372–378. DOI: 10.5951/MT.101.5.0372.
- Zazkis, R. (2010), “Using Code-Switching as a Tool for Learning Mathematical Language,” For the Learning of Mathematics, 20, 38–43.
- Zimmer, B. (2010, October 29), “Creeper! Rando! Sketchball!”, The New York Times. Available at https://www.nytimes.com/2010/10/31/magazine/31FOB-onlanguage-t.html. Retrieved March 7, 2022.
APPENDIX A:
Assessment Instrument (the Survey)
Briefly state any example of an “average person” (or state why you think that concept does not make sense).
Briefly state any example of a “random person” (or state why you think that concept does not make sense).
Briefly state any example of an “outlier person” (or state why you think that concept does not make sense).
In the statement “The average family has 2.1 children.”, I would interpret the word ‘average’ as: (A) the mean (B) the median (C) the mode (D) more than one of the above are possible (E) none of the above
In the statement “The average person has 10 fingers.”, I would interpret the word ‘average’ as: (A) the mean (B) the median (C) the mode (D) more than one of the above are possible (E) none of the above
In the statement “The average household earns $70,000 per year.”, I would interpret the word ‘average’ as: (A) the mean (B) the median (C) the mode (D) more than one of the above are possible (E) none of the above
Jo, Tony, and Melissa are project teammates trying to agree on wording for a statement.
Jo writes “On average, a worker earns $50,000 per year.”
Tony writes “The salary of the average worker is $50,000 per year.”
Melissa writes “The average worker salary is $50,000 per year.”
Select each person that you think wrote a good sentence (in other words, you can select 0,1,2, or 3 of them).
We know that pedestrian deaths are more likely to be older individuals (who may not be able to have the vision, hearing or reflexes to avoid a car) and children (who are harder to see because of their small size and who may underestimate danger from cars when playing in or crossing the street). In a random sample of 7 pedestrians killed on New York City streets, the pedestrians’ ages (in sorted order) were: {5, 10, 15, 55, 60, 65, 70}. Because (5 + 10 + 15 + 55 + 60 + 65 + 70)/7 = 40, would it be reasonable to say ”the average pedestrian in a fatal accident was 40 years old”? Why or why not?
Jo, Tony, and Melissa are project teammates trying to agree on wording for a statement.
Jo writes “We surveyed 10 randomly selected people.”
Tony writes “We surveyed 10 random people.”
Melissa writes “We randomly surveyed 10 people.”
Select each person that you think wrote a good sentence (in other words, you can select 0,1,2, or 3 of them).
Select each person that you think wrote a sentence that illustrates the statistical meaning of the word “random” (in other words, you can select 0,1,2, or 3 of them).
Jo says, “While at a party, I ran into someone wearing a rainbow-colored zebra costume – it was so random!”
Tony says, “Conference attendees put their business cards in a bag and then someone reached in to pick one at random to pick the door prize winner.”
Melissa says, “It was a random act of violence – the shooter did not know any of his victims.”
Jo, Tony, and Melissa are project teammates trying to agree on wording for a statement.
Jo writes, “We conducted an anonymous survey of 10 students.”
Tony writes, “We conducted a survey of 10 anonymous students.”
Melissa writes, “We anonymously conducted a survey of 10 students.”
Select each person that you think wrote a good sentence (in other words, you can select 0,1,2, or 3 of them).
APPENDIX B:
Background on Survey Phrases
Following up on Section 1, we offer historical and pedagogical background specific to each phrase studied and how this relates to or motivates the specific items in our (Appendix A) survey.
Outlier Person
As noted in Section 1.3, this phrase is not used as often (by students or in society) as “average person” or “random person,” so only one survey item was used for it. But lest a reader think that the phrase outlier person might be used by a student but never by a statistics journal, consider this example of Choudhury and Das (Citation1992, p. 93): “For example, the detection of a rare disease like AIDS from tests of blood samples collected from a large number of individuals, if the blood samples of, say, 200 individuals are mixed, there is a risk that the group sample which contains the blood of an outlier person may not indicate positive result due to too much dilution.” Typing “outlier person” into a Google Scholar search brings up examples of usage in other journal articles as well.
With his “average man” concept, Quetelet viewed deviation in either direction as a sign of inferiority. Today, however, there is more interest in focusing on deviation in a desirable direction as something to study and emulate. Malcolm Gladwell (Citation2008) discusses how to learn from people or entities whose successes are truly outliers, and Sternin, Sternin, and Pascale (Citation2010) describes how to increase their visibility.
Random Person
Random person requires much attention, given how commonly students or even educators (e.g., Martin Citation2009) use this phrase. Most of the blame may be on the prevalence of the use of the phrase in slang or popular culture (including a shortened pejorative form “rando”; Zimmer Citation2010). Random was one of the lexically-ambiguous words investigated in the Kaplan, Fisher, and Rogness (Citation2009) study, in which nearly half (29 of 61) of the students defined random consistent with this description: “An occurrence that has no definite aim or purpose, unplanned, haphazard, spontaneous, different.”
While we are unaware that any statistics textbooks say “random people,” they do often refer to a “random number generator” or “table of random numbers” even though the obtained numbers are not inherently “random numbers” but simply the numbers from a particular realization of a random process. Lest the reader assume that no one would actually ever view an individual number as having an inherent degree of randomness, note that lottery players’ chosen numbers underrepresent “less random-looking” numbers such as multiples of 10 (Wang et al. Citation2016).
This point would also apply to the well-known “Random Rectangles” activity (Scheaffer et al. Citation1996) in which students collect and compare the results of various types of 5-rectangle samples (not all of which come from a type of random sampling) in order to estimate the mean area of a set of 100 rectangles of varied dimensions. The playful alliteration of the activity’s title belies how people tend to overestimate how well their judgment sample represents the population. With this particular activity, there is a general tendency to underrepresent 11 rectangles, and therefore overestimate the population parameter, not unlike the tendency to underrepresent the shortest words in the Gettysburg Address activity (Kader et al. Citation2020).
There are many classroom demonstrations that can help students recognize the limitations of intuition about randomness, such as the Random Rectangles and Gettysburg Address activities mentioned earlier. An even quicker in-class demonstration is to ask students to choose a whole number between 1 and 10, and observe that people are much more likely to choose a number at or near the middle (the “center stage effect”). For another example, students asked to give the professor two 200-flip sequences of coin flips, where one sequence is real and the other is made-up, are often surprised that the professor can identify the fake about a large majority of the time because students tend to unduly stick to short runs in their made-up sequence (Kouritzin et al. Citation2008). Classes can discuss how the iPod Shuffle was complained about by customers who assumed it was not truly random when the same song sometimes came up twice in the same playlist (Holmes Citation2006). Kaplan, Gabrosek, et al. (Citation2014) cites evidence that even scientists are not great at talking accurately about randomness.
Since we are fallible at recognizing or representing randomness, there is all the more motivation to see what students think the phrase random person might mean. Three of our survey’s 11 items involve random or random person, with Item 10 directly informed by the Kaplan mnemonic image mentioned in Section 1.2 and with Item 9 directly informed by wording our students have used on project proposals and writeups in our class. Also, Item 9’s “randomly surveyed” phrase was inspired by the example shared by Huck (Citation2012, p. 109) of a sentence from a published study (Artigli et al. Citation2010): “During the [judo] competitions, the participants were approached randomly and invited to participate in the study.” Huck adds (p. 110) that “It is possible, of course, that a subset of all the judo competitors were randomly selected. However, it is my hunch that the word casually, if substituted for the word randomly, would more accurately describe how the judo athletes were approached.”
Average Person
Average was another of the lexically-ambiguous words investigated in the Kaplan, Fisher, and Rogness (Citation2009) study, in which a plurality (25 of 64) of students answered not with a measure of location but with one of these nonstatistical words/phrases: ordinary, normal, typical, mediocre, not extraordinary, common, neither outstanding nor poor, standard. This variety of conceptions suggests that students may also have varying ideas about what is meant by an average person.
Just as random person evoked confusion between process and person, there may be a similar confusion for average person – a confusion between the measurement and the person from which the measurement came. But this is subtle because the phrase average person appears to be used in a much bigger circle of people – a circle that includes many professionals who may never have thought about the limitations of the phrase average person. Typing the phrase into Google Scholar brings up academic journal articles with titles starting “What does the average person know about….” A paper (Good and Grouws Citation1979) considered a classic in mathematics education research (Carpenter, Dossey, and Koehler Citation2004) refers to performance “by the average student in the experimental group.” Even those who would acknowledge the limitations of the phrase may find it to be a convenient shorthand and its use to be a hard habit to break.
Another important consideration is how everyday language may interfere with learners using language correctly in a statistical context. Pfannkuch (Citation2011, p. 35) quotes an example of a 10th-grade teacher who said (in a videotaped teaching episode), “From these samples, it appears the median average student who doesn’t own a cell phone sleeps half an hour longer….” Pfannkuch (Citation2011, p. 35) explains that there is an “echo of [19th-century Belgian statistician, sociologist, and astronomer Adolphe] Quetelet who introduced into societal thought the concept of the “average man” in the 1840s (Stigler Citation1990). Today media reports will often narrate a story about the “average student” or “average family” using statistical data. Possibly the influence of everyday language—that is prior knowledge or the historical-context – is impinging on the teacher’s reasoning when she tries to synthesize the statistical domain with the contextual domain.” Stigler (Citation1999, p. 61) adds, “With Quetelet, the essential idea was that of comparison—the entire point was that there were different average men for different groups…and it was for the study of the nature and magnitude of those differences that he had introduced the idea.” The Google Books Ngram Viewer shows that the phrase average person has consistently been much more frequently used (in a very large corpus of books) than the phrases random person, outlier person, or anonymous person. (Also interesting is that average person had a high local maximum around the time of WWII and also a small local maximum around the 1830s, near the time of Quetelet’s work.) Because of this relative prevalence, items related to average comprised roughly half of the survey with Items 1 and 5 (average person), 4 (average family), 6 (average household), 7 (average worker), and 8 (average pedestrian).
Item 8 was designed to see if students would question whether the average person concept makes sense when using the mean to summarize a dataset where the trait of interest has a bimodal distribution not well represented by the mean. As illustrated in Item 8, the distribution of ages of pedestrians involved in fatalities (e.g., Roe et al. Citation2010) is bimodal because the pedestrians most often killed are the very young (who may lack the situational awareness or understanding of danger to stay out of cars’ way) and the very old (who may lack optimal reflexes, sight, or hearing). The mean of the ages of pedestrians killed is between (and not near) the modes, a different kind of outlier than students usually see.
A reason we included items related to average person is that the average person concept has appeared to be problematic in contexts such as physical body measurements. For example, Behara and Das (Citation2012) examined 19 structural anthropometric measurements of a stratified sample of Canadian adults and found that percentile ranks of body dimensions are not uniformly proportional to height and that no one is average in all 19 body dimensions and few are average even in several dimensions.
This “jagged” nature also appears when Harvard professor Todd Rose reviewed issues that arose when, for example, airplane cockpits were designed only for the “average pilot” instead of designed with flexibility for varied individual profiles within the middle 90% on each dimension (Rose Citation2016; Parker Citation2020). Rose also explains how individuals usually cannot be meaningfully and unambiguously ranked in one dimension because individual profiles are typically multidimensionally varied. He goes on to argue that the one-dimensional sorting and ranking implicit in the average person concept is not valid nor effective and must be rejected to embrace breakthroughs such as personalized medicine, competency-based credentialing at universities, and context-based hiring at companies. The implausibility of an “average person” is perhaps reflected by the fact that the very rare instances that a “statistical composite” person might actually appear to exist are considered quite newsworthy (Rampell Citation2011) or amusing (Ulbrich Citation2018).
All that said, we acknowledge the human temptation to refer to an “average person” as rhetorical shorthand, even if such a person may not actually exist or be readily identifiable, as discussed in Section 5.4. But just as we advocate replacing the individual word “average” with the specific measure at hand, we can similarly recommend replacing “average person” with a phrase focusing on the salient attribute in the given context (see Section 6.3). Another usage observed (and readily avoidable by rewording) is when “average person” is used to refer to the mean on a per-person basis rather than on a per-group basis (Kramer Citation2020). For a more qualitative example of substitution, consider the concept of “reasonable person” in how the U.S. Department of Education’s Title IX Final Rule (https://www2.ed.gov/about/offices/list/ocr/docs/titleix-summary.pdf) defines sexual harassment to include “any unwelcome conduct that a reasonable person would find so severe, pervasive, and objectively offensive that it denies a person equal educational access.”
Anonymous Person
As noted earlier, this phrase is not as commonly used (by students or in society) as “average person” or “random person,” and so only one survey item (Item 11) used it. That item came from wording seen in past student project proposals and reports, as well as the common everyday occurrence of phrases such as “anonymous donor,” where the word anonymous ultimately describes a particular action or process rather than being a permanent characteristic of a person.
APPENDIX C:
Coding
In this Appendix (and in the Excel file in supplementary materials), we give interested researchers additional detail on coding, including our positionality, coding process, and interrater reliability.
As mentioned in Section 2.2, seven of the survey’s 11 items had fixed choices and the other four items were open-ended. As a form of researcher triangulation, all student responses to these four items were coded without discussion by two different researchers. The first author is a non-Hispanic white male in his mid-50s, with much experience in conducting, publishing, and teaching about quantitative and qualitative research. The second author is in his mid-20s, with Hispanic ethnicity, an undergraduate major in statistics and minor in philosophy, and having a fresh, recent perspective on research and teaching as a graduate student in statistics. Also, the second author found his intermediate proficiency in Spanish helpful in ascertaining meaning in nonstandard English wording found in some of the student responses at this Hispanic Serving Institution. The researchers’ diverse and complementary backgrounds helped more things get noticed and discussed. For example, the second researcher’s easygoing temperament and skateboarder identity affected his coding (ACT instead of COMP) of this student-offered example of average person: “I think about a person who just goes through life not overthinking, living in the moment, a nice person.”
For each of the open-ended items, codes were generated mostly in advance, based on experience and the literature, and the approach was therefore closer to a priori coding than to grounded theory. However, the code list was also expanded and refined upon encountering unexpected student responses. Section 4.1 mentions a particularly idiosyncratic example of such a code when three students interpreted an “outlier person” as someone who lies!
After the researchers independently coded each of the four open-ended items in February 2021, they compared their codes and had discussion to see which of the differences could be reconciled and which would remain separate. The discussion identified some categories as not meaningfully different from each other (or one as a special case of another) and a consensus was reached to merge them to consolidate findings. An example from the outlier section would be: “an outlier person would be me who is spiritual in my family who is all religious,” which one researcher coded as the first category for Item 3 and the other researcher coded as the third category. Five particular initial disagreements were subjected to peer debriefing in early March 2021 by graduate students in a research methods course (see Acknowledgments). The results of these nine students independently choosing a code from our list validated the degree of our challenge in that in none of those five pieces of text did a majority of the nine graduate students agree on the best code. Nevertheless, their comments and insights helped us resolve those instances.
Unitizing (identifying appropriate blocks of text for coding) the open-ended items was straightforward because each of the 4*73 = 292 possible open-ended responses (which included the survey’s 4 omissions noted in Section 2.2) were a unique student-item combination and all but 18 of them were no more than two sentences. While most of these open-ended responses could be fully described with a single code, there were 27 that required two and 3 that required three codes. This is why the sum of the code frequencies in each table for open-ended items (1, 2, 3, 8) exceeds 73. Percentage of agreement was calculated using the standard formula A/(A + D), where A = number of agreements and D = number of disagreements. This provided a lower bound of pre-discussion agreement.
An attempt to get an even more fine-tuned assessment of pre-discussion agreement used a modified, “partial credit” system. In the 16 instances where one researcher used one more code than the other did for the same piece of text, the extra code was treated as a half-disagreement, though treating it as a full disagreement generally did not affect the percentage agreement by more than a few percentage points. An example is when one student responded to the phrase “average person” with “When I think of an average person I think of someone who is just fine in life, they have a decent home, job, looks, nothing too ‘wow’ they’re just there minding their own business.” The first author coded this response as the average person having what is typical (e.g., job, home, kids) and average by avoiding extremes, negative traits, or specialized skills. The second author coded the response as only the former trait, so the avoidance trait of the code was treated as a half-disagreement since it was not included by the second author.
In addition to the Extra Code partial credit, there is another type of partial credit that we referred to as Train-of-Thought. This partial credit was applied when the authors’ codes differed, but there was a similarity in the thought process that led to one author demonstrating that his code was a specialized code of the other’s or the opposite occurring where one demonstrated that the specialized code did not actually fit. This specialization aspect was most clearly defined by a word or two that brought in a specific concept. This can be seen in the student response to “outlier person”: “someone that lives their lives in a special way, not rich or poor, than what others would be considered normal.” One author coded it as being different from the crowd or from a particular reference group in an overall sense (the general code), but the other author coded it as a person who is beyond social norms in terms of their beliefs or behaviors. While both codes fit the description (i.e., same “Train-of-Thought”), the latter was designated as the final code because of the usage of “would be considered normal” in the student’s response.
shows that the final level of percentage agreement on coding was very high and that the pre-discussion agreement percentages are respectable within their own right. One potential exception would be the “outlier person” phrase, which not only had the greatest number of codes to choose from, but also yielded wording that proved to contain its own lexical ambiguity: such as interpreting the word “commonly” as “most common” (therefore, coded as the mode) or involved a code that could be viewed as a special case of the other rater’s code.
Table 7 Agreement between coders.
Another aspect of interrater reliability was implemented with the four survey items (7, 9, 10, 11) which ask the respondent to choose which of three sentences is/are acceptable. For analysis and display purposes, the researchers wanted to establish a reasonable ordering for each set of three statements using the criterion “degree of correctness” in a qualitative manner. The two researchers independently came up with their four 3-statement orderings and found they had 100% agreement in the orderings. For further validation, the authors then asked for an independently generated set of orderings from a statistics professor who has experience with statistics education research, but who knew no details about this particular study. This outside professor’s orderings matched the orderings the researchers had separately previously obtained (personal [e-mail] communication with the first author, 3/25/2021). (We will see, however, that these consensus orderings only sometimes aligned with orderings of students’ approval ratings of the statements or with the order presented on the survey, for that matter.) The idea of “degree of correctness” was not unlike how a teacher might strive to offer partial credit and was inspired by the sequence of (increasingly correct) interpretations Vogt (Citation2007, p. 13) gives of an obtained p-value.
APPENDIX D:
Didactics
To make the concepts and findings discussed more practical for instructors, this appendix offers for each phrase an instructional sequence, guidance, and examples.
Average (Person)
First, we recommend following the guidance of neuroscientist Daniel Levitin (Citation2018) and others to avoid the imprecise individual noun average in the first place because it is too ambiguous of a word – not only because of confusion with everyday meanings, but also because even when used in relation to a summary statistic, it can be more than one particular measure of location (as survey Items 4, 5, and 6 suggest). And if an instructor is going to have to say something like “32 is the average, by which I mean the mean in this example,” it would be much shorter and more clear just to use the specific measure of location and say “32 is the mean.” As time permits, students could also be made aware that there are more types of “average” (the median, the midrange, etc.), more types of means (e.g., geometric mean), multiple choices of what unit to average over (e.g., Hemenway Citation1982), and how dotplots can tell very different stories despite having the same mean and same standard deviation (e.g., Cleveland Citation1994, p. 215). A classroom “ban” on the word average as noun or adjective (thus, still allowing its use as a verb when “we average over the [students, items, etc.]”) may be a way to force greater clarity.
Even when there is agreement on which type of average in a given context, students need to be taught to also be clear on the characteristic to which the measure is being applied. Instructors can ask students if they all agree on what it means to say (Schield Citation2021, p. 159) that “The average city in California is bigger than that in Iowa.” Schield explains that it does not tell us if the measure is population or area and advises that we should “connect the measure of center (average, median or modal) with the measure it modifies in a single adjective-noun phrase.” In general, any critique of the “average person” concept requires distinguishing the measurement from the person from which the measurement is taken. Sometimes the language in mainstream textbooks falls a bit short such as a population defined (Triola Citation2010, p. 4) as “the complete collection of all individuals (scores, people, measurements, and so on) to be studied.” Teachers can avoid this potential ambiguity (noted at the end of Section 1.2) using “units” as Utts (Citation2015) does instead of “individuals.”
Second, we recommend making sure students know not just computational but also conceptual properties (Strauss and Bichler Citation1988), especially that the mean need not be a value in the dataset. This particular property may help students think beyond an actual value being a literal representative of it, and a next natural step is to reflect upon when the mean is not just absent in the dataset, but also not at all representative of the dataset, and a real-world context such as Item 8 from the survey can be used as an exploration in class of this very point. Another approach can be to have students discuss equally accurate, but not equally meaningful, statements such as “On average, a human on the planet earns less than $2,000/year” and “On average, a human has half of a womb which delivers two children.” Bauer and Calude (Citation2020, p. 110) note that the quip that the average person has 1 ovary and 1 testicle “ignores the reality of the distribution of ovaries and testicles, which is that for the most part, they come in mutually exclusive sets of two.…. ‘Testicles and ovaries have a mean distribution of one of each per person’ is not the same as ‘Normal people have one ovary and one testicle,’ but ‘The average person has one ovary and one testicle’ casually invites both readings.”
To prime reasoning for an exploration of multiple traits with real-world context, a teacher could first use a concrete demonstration with the first 100 positive integers (using a chart such as https://www.mathplayground.com/interactive/_hundreds/_chart.html). Properties that each apply to the large majority of these numbers include “not prime” (75%), “not triangular” (87%), “not square” (90%), and “have no 8” (82%). And yet, if asked, “Do most of these numbers have all four of these very common attributes?,” the surprising answer of NO is straightforward to verify by going through each category one at a time and crossing out its complement on the chart.
Classes could discuss, for example, how Behara and Das (Citation2012) examined 19 structural anthropometric measurements of a stratified sample of n = 40 male and n = 40 female Canadian adults and found that percentile ranks of body dimensions are not uniformly proportional to height and that no one was average in all 19 body dimensions and few were average even in several dimensions. Discussing such a result (from this or other data) gives the instructor a reference point to remind and redirect a student who uses the phrase “average person” later in the term.
Since students may find it even more interesting to look at sociological variables rather than only anatomical ones, instructors can facilitate brainstorming a list of modal traits for a human population such that each of those traits is something most American adults have and yet there is not a large fraction that has all of those common traits simultaneously: white, Christian, cisgendered, heterosexual, able-bodied, civilian, registered voter, licensed driver, are not homeless, speak English at home, live in a non-rural area, have a cell phone, are at least third-generation Americans, high school diploma, Rh-positive blood, not diabetic, not gluten sensitive, right-handed, and have traveled outside the state they were born. Asking students “Do you have ALL of these traits – yes or no?” is unlikely to embarrass anyone since each trait is modal and answering “no” to the question does not reveal which trait(s) is/are not possessed. Another activity would be to have students discuss these comments by Raper (Citation2017, p. 16):
“… if you were to average the sides of all right-angled triangles you would not get anything like a right-angled triangle. In the same way, the average customer may end up looking like no one at all, in which case targeting them would be a serious error….(As Todd Rose puts it, we need to ‘analyse then aggregate,’ not the other way around.)”
Classes could also discuss this example from Schield (Citation2021, p. 52): “Americans are white Christian females…. A charitable explanation is that the most common group of Americans based on race, religion and gender are white Christian females.” To make this more concrete, we developed this assessment item that could be used to test students’ intuition (and see how literally they internalize the “average person” concept):
Assume 2/3 of a given population is Christian, 2/3 is female, and 2/3 is white. What can you say about what fraction of the population consists of white Christian females?
A) could be as high as 1 B) could be as low as 0 C) must be 2/3 D) must be (2/3)3 = 8/27
Students can be prompted to verify the surprising answer of B by constructing a population of three people (i.e., a white Christian male, a non-white Christian female, and a non-Christian white female). For another surprising result, if the three traits which each have probability 2/3 are assigned to the 3-person population at random, have students verify (with a simulation or with more effort by hand) whether exactly 2 people having all 3 traits is more likely or less likely than 0 people. Basketball enthusiasts could be asked why a perfect “March Madness” bracket is virtually impossible even if one chooses for each matchup the higher-seeded team (i.e., which on average is more likely to win). Finally, students in classes covering data science concepts may also explore the meaning of the centroid of a clustering model consisting of the mean of each quantitative variable and the mode of each qualitative variable in a set of records (Campos Citation2006).
Outlier (Person)
First, address the standard learning objectives of how to identify outliers, their influence, and how they should be handled. An important, but subtle and not always covered, further point is whether the values of the variables may not individually be outliers and yet the joint distribution could very much yield an outlier. Vogt (Citation2007, p. 181) gives an example of a multivariate outlier that could be explored with students: “in a study of the weight of children aged 7 to 17, a child aged 16 would not be an outlier, nor would a child who weighed 70 pounds be an outlier, but a 16-year-old who weighed 70 pounds would be.” (Note the informal reference to a child, not a point, as an outlier.)
This idea of an outlier based on more than one dimension supports the GAISE College Report ASA Revision Committee (Citation2016) call for multivariable thinking and may facilitate critiquing concepts of “average person” and “outlier person” in the same discussion with questions like:
If someone is in the average range for 19 of 20 attributes, but an “outlier” in the 20th attribute, would you say they are overall an average person, an outlier person, or neither?
If everyone has at least one outlier trait, would that trivialize the “outlier person” concept?
And if someone were exactly at the mean in every conceivable quantitative measure and shared the mode for every conceivable qualitative measure, would you say such a combination is so unusual and improbable that it is in some sense an outlier?
Random (Person)
When introducing the term random, an instructor needs to acknowledge the slang everyday meaning students may have and distinguish it from the statistical meaning by using the “zebra vs. hat” mnemonic (Kaplan, Gabrosek, et al. Citation2014, p. 13) and associated activity. Otherwise, a student might use a phrase such as “we randomly assigned treatments” or “we randomly selected participants” but have in mind people choosing haphazardly without any probabilistic structure.
To distinguish a random process from a particular outcome of that process, students can be asked whether all individual numbers are equally likely to be drawn in a state or national lottery, and whether a set of numbers such as 1-2-3-4-5-6 is just as likely as a sequence of more “random-looking” numbers such as 8-11-17-25-40-46.
For another angle, if time and background permits, instructors could pose the classic question “From a given circle, choose a random chord. What’s the probability that the chord is longer than a radius?” which can reasonably yield varied answers (e.g., ). Interviewees in a case study (Wilensky Citation1995) came to realize (p. 272) “there was no unique set of real and truly random chords – different physical experiments would lead to different sets of ‘random’ chords.”
After discussion involving mathematical entities, a natural next focus is people. The first author made an explicit “point and pick” demonstration described in the next paragraph.
Pick all the students in the nearest row (so it would be obvious to students that this was a convenience sample) and then ask the class, “Okay, which of these students are ‘random people’?” Pause to give students a chance to realize the question makes no sense before moving on to focus to the process. Ask if there was any possible selection bias in the method. Students often suggest (and if they don’t, the instructor can) that maybe those who sit near the front of the room are students more eager about learning (there is some literature on this conjecture: Perkins and Wieman Citation2005). Then, pick a new sample from the room, choosing all students with long hair, but without initially revealing the criterion. Because those students are likely to be scattered in different locations, it may seem more “random” to students. Ask: “Are all these students random people?” Again, there is usually no response to this question before the instructor addresses the process. Students (with any needed prompting) identify the sampling criterion and its accompanying selection bias (by generally favoring females, for example). Take one last sample by openly using a random number generator (e.g., from random.org) to select students from the class roster, and by this point students should seem to start internalizing that the word random needs to modify the process, not the people.
When we assign our students a data collection project, we find that they will often assume that if they survey fellow students they do not know (often describing them as random people) that they are getting a sample representative of the student body, if not also of the general public. It is interesting to have students reflect on whether they are reaching a representative sample of the student body by their (usually nonrandom) method of soliciting participants and whether a college student body, in turn, is representative of the general public (see, e.g., Hanel and Vione Citation2016; Henrich, Heine, and Norenzayan Citation2010; Peterson Citation2001).
Finally, when an instructor hears a student say something like “we gave each survey to a random person,” it may be helpful to respond with the first author’s memorable couplet to encourage them to reflect on whether a random process was actually used and, if not, what unconscious biases might have influenced whom they chose to approach:
“Did you draw their name from a hat
Or were you drawn to them and that was that?”
Anonymous (Person)
First, help students distinguish anonymous and confidential by showing them examples of surveys and ask if they could be filled out in an anonymous or merely confidential manner. (One option might ask for a name, another might ask for a driver’s license number, another might ask for potentially identifying information about ethnicity, etc.) A side discussion could also be had about how classifications of anonymous and confidential interact with methods of data privacy (Bowen Citation2022). The phrase “anonymous person” suggests anonymity is an inherent feature of a person, not a process, which is unequivocably incorrect.