Abstract
In many collegiate level statistics courses, the focus of the learning outcomes is often on the analysis of data after it has been collected. Students are provided with clean data sets from previous studies to practice statistical analysis, but receive little to no application as to the amount of time and effort that goes in to collecting good data. To account for these deficits at the author’s institution, a design of experiments course was created that provided students with a more hands-on learning experience to the statistical process, especially as pertains to data collection. This paper focuses on five of the experiments that students designed and implemented during the course, and some suggestions to instructors that may wish to use these experiments in their own courses.
1. Introduction
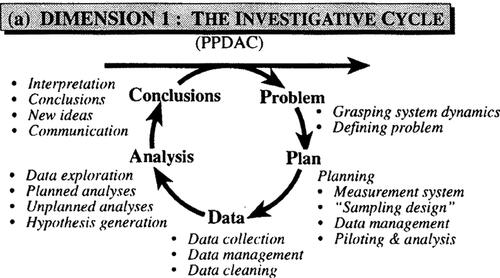
For students graduating with degrees in statistics, being able to just conduct a statistical analysis is not enough. It is also imperative that our students can work through the entire investigative cycle, from posing a problem, to collecting data, conducting the analysis and providing a solution to the problem (American Statistical Association, Citation2016; American Statistical Association Undergraduate Guidelines Workgroup, Citation2014). Lee et. al provide a comprehensive collection of researchers that have proposed frameworks for what this process might look like (2022). While each of these have their own nuances of this process, each includes an element of planning and implementing data collection. For example, one of these frameworks, created by Wild and Pfannkuch, proposed the investigative cycle (the PPDAC, ), which includes defining the problem, planning the data collection, collecting the data, conducting the analysis, and creating conclusions (1999).
Figure 1. Wild and Pfannkuch's Investigative Cycle (Citation1999, page 226)
However, in scanning the course descriptions for classes offered at the author’s home institution, and having informal conversations with colleagues, it was found that most courses within the department emphasize methods of analysis and only a few mentioned topics for appropriate data collection. As noted above though, learning statistics is not just about being able to analyze pre-collected and pre-cleaned data. A critical step in doing research and conducting a statistical analysis is designing an appropriate experiment that will provide unbiased, authentic data (American Statistical Association Undergraduate Guidelines Workgroup, 2014).
As such, a design of experiments course was developed to help students learn methods for both data collection and analysis. However, just learning about the methods without practical application is not enough. The GAISE College Report recommends that statistics teachers should foster active learning as this “allows students to discover, construct and understand important statistical ideas” (American Statistical Association, 2016, p. 18). As such, this course not only taught the students how to design the experiments, it provided them with opportunities to implement their designs and collect data, then perform an appropriate statistical analysis on that data (Blades, Schaalje, & Christensen, Citation2015). This process was done in an attempt to teach students how difficult, and potentially messy, data collection could be and ways to help ensure that data is clean after collection.
The aim of this paper is to describe some statistical experiments that were used in this course that fostered active learning and gave students the opportunity to focus more on the Plan and Data phases of the investigative cycle than may be available in many traditional collegiate level courses.
2. Methods
2.1 Course Information
In the spring of 2021, the Design of Experiments course was offered as an elective topics course at a private university in the Midwest. The learning outcomes for the course were as follows:
Understand principles of experimental design that can be used to help answer scientific questions.
Know when it is practical to utilize different methods of experimental design.
Understand how to analyze and interpret data that has been collected through a well-defined experiment.
Know limitations of different types of study design.
Possess an introductory understanding of technology used in statistical analysis.
The prerequisite for the course was our institution’s version of an introductory statistics course, which covers introductory statistics material (sampling distributions, confidence intervals and hypothesis testing), and regression topics (simple, multiple linear, logistic and multinomial regression including their assumptions for inference). This prerequisite course provided students with an opportunity to think about bias in data collection, but offered no specific examples for students to conduct data collection on their own. 53 students completed the Design of Experiments course. These students were either applied and computational mathematics and statistics majors or minors, or statistics majors.
The course was offered in a flipped classroom setting. While a flipped classroom design is not necessary to complete the experiments described in Section 3, doing so may provide instructors and students with more time in class to conduct these experiments. As such, a description of the course as a flipped classroom will be discussed here.
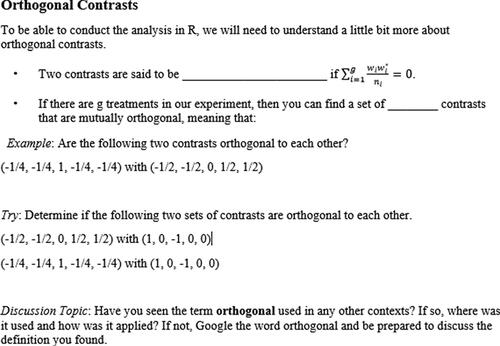
Students were provided with guided note outlines to be completed outside of class time, by watching ADA compliant, recorded content created by the instructor. This content followed the material outlined in the course textbook: A First Course in Design and Analysis of Experiments (Oehlert, Citation2010). Additionally, the note outlines provided discussion questions and practice problems pertaining to the material, but the solutions were not provided to students in the course content videos. To aid in critical thinking and discussion, students were expected to complete the discussion questions and practice problems on their own while completing the rest of the note outline. provides a condensed example of the note outlines from the section on contrasts. Note that spaces originally provided to students to write down their work have been removed for space reasons here. This example demonstrates notes where the student is expected to fill in the blank and write out a definition, as well as complete a guided example and then try one on their own. Finally, the student is asked to prepare some remarks for the class discussion about the term orthogonal, either as a definition, or how it has been used in other classes they have taken.
Figure 2. A condensed example of the guided note outlines used in the course.
To ensure students were completing the designated material outside of class time, they were required to complete a short comprehension quiz at the end of each module. The comprehension quizzes were generally between five and eight questions given as a Canvas quiz. Students were allowed two attempts for each comprehension quiz and the average of their two scores was recorded in the gradebook.
2.2 Module Design
The class met twice a week for 75 minutes. Depending on the content, a typical module would span two to three of these class periods. The modules included:
Introduction to Experimental Design – Methods and Ethical Concerns
Randomization in Designs including Matched Pairs Designs
Completely Randomized Designs
Contrasts
Factorial Designs
Nested Designs/Fixed and Random Effects
Complete Block Designs
Split Plot Designs/Repeated Measures Designs
Designs with Covariates
Propensity Score Analysis
In a typical module, the following would occur:
Students would complete the assigned note outlines and comprehension quiz outside of class. According to course instructor feedback, these would typically take between two and three hours to complete, depending on the student and the module.
In class, students would discuss the note outlines in self-selected small groups and try to answer questions that they were not able to complete outside of class. Students also provided their thoughts on the discussion questions and their attempts at the practice problems during this time. The instructor would circle the room, answering questions that groups had, and observe common discussion points groups were making about the notes. The amount of time spent during this phase of class was dependent on the level of participation by the students but the class would typically spend between 20 to 30 minutes in this phase. Once it seemed that the students were getting off task, the instructor switched to a whole-class discussion and the common discussion points noted during the group discussion time were addressed.
Techniques for exploratory analysis and statistical analysis for the module were discussed. Since a course covering regression topics was the prerequisite to the Design of Experiments course, some of the topics for analysis were review for students, especially at the beginning of the semester. As the course went on, a bit more time was spent demonstrating the process of analysis for the different design methods. This meant that the class might spend anywhere between 30 and 60 minutes in this phase. This demonstration usually included a practice problem with curated data, which gave the students an idea of how their data should be formatted when they went to collect their own data for an experiment of the same type. R code was also provided in a script so that students could follow along and write their own comments as the topics were discussed.
An introduction to the main problem for the module would be given and students would work in small groups to start planning their experimental design. The students would then come together as a whole class and come to a consensus about how data collection should proceed. The instructor had a flexible intended process in mind for each experiment and attempted to direct the students toward that process through leading questions in both the prompt and in the discussion. This would take approximately 30 to 40 minutes.
Once a process was established, students were sent out onto campus in groups to collect data and record it in the class dataset. The use of groups was intentional to prevent shy or anxious students from feeling like they had to initiate a conversation with a stranger and so that the students could start reflecting on the experimental design process while they were still collecting data. Students were asked to return to the classroom by a designated time. Once all students were back, a debriefing of the data collection process was discussed as a class. Here the students provided any comments or concerns about the data collection process that they observed, and ways that they might improve upon the experiment if they were to conduct it again in the future. Depending on the experiment, this phase could take anywhere between 30 to 75 minutes. Each experiment and discussion were always completed on the same day to ensure students remembered the problems or concerns that they had during data collection and could share them with the class.
Depending on how much time was left in the allotted time for the module, students worked on the analysis and write up for their experiments. This time was provided so that students could remind each other of important details in the data collection process and ask questions about how to conduct the analysis in R if they needed additional help. Most students did not finish the write-up in class. They were expected to complete it outside of class and submit it within a week.
For those wishing to use the assignments described in Section 3 with their students, but are not planning on using a flipped classroom design, it may be advantageous to give students the main problem at the end of a class period where the experimental design has just been discussed, and ask them to prepare their own design for the next class. You could then have the whole class discussion at the beginning of the next class period to solidify the experimental design that will be used and students can implement the design in the same class period.
2.3 Assignment Design Aspects
The main problem in each section was designed not only to give students the chance to work with an experimental design based on the current topic being discussed in class, but to demonstrate other aspects of experimental design that have a much broader impact across data collection. While not every experiment included all of the following, the list given below demonstrates some aspects of the assignment creation that were utilized in at least one experiment and were found to be helpful to promote students’ understanding of experimental design. More information about how these items were used and why they were helpful is discussed in more depth in Section 3.
As a whole, the assignments should have students:
Propose and discuss multiple experimental designs so as to understand potential benefits and limitations of the experiment.
Provide a list of potential explanatory variables, factors, and factor levels that they believe may affect the response variable.
Consider variables that may affect the response variable but are of no interest to the research question, and potentially how to hold those variables constant.
Think critically about the research question of interest and propose a response variable and how best to measure it.
Determine how randomization will be consistently performed in the experiment across all groups collecting data.
Consider the protocols and ethical concerns of using human subjects in research as well as challenges in finding volunteers to participate in a study, while still collecting data that is representative of the intended population.
Critique the use of resources allocated for an experiment for both cost and usefulness, and suggest alternate tools for measurement and data collection if necessary.
Consider group sizes (number of students within a group) and sample sizes (number of participants to include) of the experiment and whether the amount of data collected will be enough to provide a meaningful answer to the question that was asked.
Utilize technology, such as Google Sheets or Google Forms, to organize a class data set that is easily accessed and fairly clean.
Work in groups to promote discourse and prevent shy students from feeling as if they need to talk to strangers outside the classroom.
Practice technical and scientific writing.
3. Experimental Designs
When first creating the course, I looked for inspiration for experiments my students could conduct via a Google search. While there were several examples given, I didn’t find many that would meet the learning objectives I wished to cover, were interesting to my students, and that provided enough guidance that I could follow along with the intended experiment. For example, Gelman and Nolan (Citation2017) and Annis (Citation2005) both defined factorial experiments based on Box’s helicopter experiment (Citation1992). While these authors provided excellent examples, I didn’t feel like there would be enough discussion about the experimental design process for the given experiment. As another example, Muehlenstaedt and Lanzerath (Citation2019) detailed an excellent experiment to demonstrate split plot designs about a boomerang tin, but I felt that it was too resource intensive and wouldn’t be of interest to my students. Finally, Hunter (Citation1977) provided 32 examples of experiments that could be conducted by students, but didn’t provide any details on how the experiments should be conducted.
Due to the lack of previous examples that I felt I could use, I ended up creating most of my experiments for the course from scratch. While students completed 10 modules during the semester, this paper contains a discussion of only five of the experiments (main problems) that were given to students during that time. The main problems to be discussed here will come from the modules on Matched Pairs Design, Completely Randomized Designs, Factorial Design, Random Effects with Nested Designs and Split Plot Designs. For each of these design types, the reader will be presented with:
The prompts that students were given for the main problem of the module.
Highlights of the discussion to plan the experiment and the experimental design that students eventually decided on.
Comments from the instructor about the experiment.
When reading about the experimental design process, note that the term “student” is used for a student in the Design of Experiments course. A “participant” is an individual who was asked to participate in the data collection process. Unless otherwise noted, students were not participants in the experiment.
3.1 Matched Pairs Design
The first experiment for the course was modified from Randal Blackwood’s best practices presentation at the 2016 the AP Statistics reading (Blackwood, Citation2016). This experiment was used during the module on matched paired designs. Matched pairs designs are used when two measurements are made on each of the experimental units and a comparison of the two sets of measurements is desired. Since the data is matched on the experimental unit, the traditional independence assumption for analysis is violated. Yet this method of design is often used since it is good at reducing the variability between groups.
3.1.1 Prompt
Problem: Are dominant arms stronger than non-dominant arms?
Supplies: Pool Noodle; Tape Measurer
Plan
Why might the question above be of interest to someone?
To collect data for this, you will be provided with a pool noodle and tape measurers.
Propose a method for data collection that could be used to answer the question.
What will be your response variable?
What will be your explanatory variable?
How will we apply randomization to this scenario?
How will you keep track of the data you collect?
Data Collection
Analysis and Conclusions
Once we have collected data, the final step of this process is to write a short report about the methods and results that we have found. To do this please write a report that:
Introduces the problem and why it might be of interest to someone.
Discusses the data that was collected.
Describes how we applied randomization in our study.
Includes applicable results that we found.
Interprets results that were found and uses them to answer the question.
3.1.2 Students’ Experimental Design
Students came to the consensus that they should be the participants, throw the pool noodle once with each arm and measure how far it travelled on each throw. Because there were eight sets of supplies, the students split up into eight groups of either six or seven students. Each group marked a starting line from which to throw (typically a crack in the sidewalk) and the participant was not allowed to cross the line when they threw the pool noodle. One person spotted where the pool noodle landed and two students used the tape measure to determine how far the pool noodle had traveled.
Since this problem was posed in the section about matched pairs experiments, students recognized that each participant needed to throw the pool noodle twice, once with their dominant arm and once with their non-dominant arm. To apply randomization to the scenario, students flipped a coin or used a random number generator on a phone to determine with which arm they would throw the pool noodle first.
3.1.3 Instructor Comments
Since this was the first experiment that students designed for the course, their description of how to collect the data was originally very limited. Despite giving them several minutes in class to discuss in their groups, most groups’ plans were akin to “we will each throw the pool noodle with each of our arms and record where it lands.” There was no mention of what part of the pool noodle to measure after it had landed, or if students were allowed to get a running start to throw the pool noodle. I had anticipated this and was prepared to ask them leading questions to eventually get them to the design that was described above.
One of the questions that I asked the students during this time was where the data should be collected. It was easy to convince the students that the only place that would allow for enough space for the pool noodles to be thrown, would be outside. This was done strategically, knowing that wind would likely be a confounding variable in the study. The purpose of choosing this location was so that I could break the design that the students came up with so that they would think about such things in the future.
Another point of interest for this experiment was that there were multiple pool noodles that were utilized. Each pool noodle was given a unique label, but the students were not specifically told to mark down the label of the pool noodle that their group used. After the students had returned to the room and put their supplies back in a pile, I asked if any of them had noted the label on their pool noodle. This was intentional on my part to get them thinking about sources of variability that might affect the outcome of the results. I have also considered having students record the pool noodle label as a precursor to block designs.
For those wishing to conduct this experiment, it is important to plan ahead and make sure that you have enough supplies. The choice to have eight pool noodles and thus eight groups was completely dependent on how many pool noodles I could purchase in January. Smaller groups might mean a quicker implementation, however if groups are too small, then students will have to be constantly changing rolls (i.e. spotter, tape measure holder) within the group and this might cause extra measurement error in data collection.
As a final note for this experiment, prior to data collection, it may also be helpful to set up a Google Sheet and share it with all of the students in the course. During our planning phase, students stated that they would write the results on a sheet of paper and then share it with everyone else in the class when they were done with data collection. However when students went to analyze data, it took up a lot of class time to wait for the one student to create and share the spreadsheet with the rest of the class. While this may be a good lesson for students to learn, I felt it was not a good use of class time.
3.2 Completely Randomized Design
The second experiment to be discussed here is for a completely randomized design. A completely randomized design is when each of the experimental units has the same probability of being assigned to any of the treatment groups. Along with other helpful tips when designing experiments, Easterling (Citation2004) provides thoughtful background on appropriate randomization methods to uphold this definition.
3.2.1 Prompt
Problem : Do people remember better if they hear a list, see a list or both?
Plan
We would like to use a completely randomized design to study this problem. In small groups, propose a method for us to collect the data to answer the question. As a class, we will define the methods we wish to use to collect the data. Take notes on our discussion, you will need them later!
Identify the explanatory and response variables for this experiment.
Data Collection
Spend 30 min with a partner traveling around campus finding volunteers for our experiment (make sure they have not done the experiment with someone else yet). Use the method we discussed in class to conduct the experiment. Make sure to record your results in our class Google Sheet.
Analyze
Once everyone is back from collecting data, you will individually conduct the analysis. Make sure to do a preliminary analysis as well as the ANOVA procedures.
Conclusions
The final step of this process is to present your results. You will do this by writing a short paper which includes:
Introduction—introduce the problem: what were we trying to figure out and why might it be important?
Methods—how was the data collected and why did we collect it in that way? Be VERY specific about this as our course really is about how we design our experiments.
Results—what did you find from your preliminary analysis and ANOVA procedure?
Discussion/Conclusion—what conclusions can you make about the question that was asked and what recommendations can you make to those that may be interested in the question that was asked?
3.2.2 Students’ Experimental Design
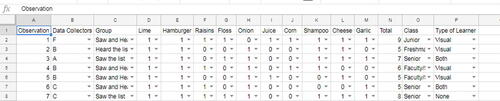
Similar to the design proposed by Lawrance (Citation1996), students decided that a list of 10 items from the grocery store that should be given to participants. These items were selected haphazardly and can be seen in below. The lists were printed by the instructor and were shown to the participants assigned to see the list, or see and hear the list. Students found that if they read at the right pace, it took about 20 seconds to read the list. This was the amount of time that participants were given to view the list, if that was part of their treatment.
Figure 3. An example of using Google Sheets to aid in data collection
With prompting, the students also came up with a script so that each group of students would give approximately the same directions to their participants. To randomly assign treatment to participants, the students decided that they would have their participants roll a die, or use an equivalent random number generator on their phone. If the die came up as one or two, the participant would see the list. For three or four, the participant would hear the list. For five or six participants would see and hear the list.
3.2.3 Instructor Comments
In addition to learning about completely randomized designs, one of the goals for this activity was to introduce students to technology that can be helpful in the data collection process, especially when multiple people are collecting data for the experiment, as well as to reinforce principles of Tidy Data (Wickham, Citation2014).
A Google Sheet was created and introduced to the data collection process and shared with the students for this experiment. Drop down lists were utilized so that students did not have to clean the data after they were done with collection. Students were encouraged to use this tool when they created their own spreadsheets in the future. Partial output from the data collection process, which demonstrates the layout of the Google Sheet, is given in . The instructor made the Sheet prior to data collection day and students asked for the addition of the variables “Class” and “Type of Learner” to account for potential confounding variables. It was helpful to ask for additional variables that the students wanted to collect to be able to show them how to set up a drop down menu in Google Sheets.
One issue that came about with the use of Google Sheets was that for the students using the Google Sheets app on their phone, the page kept reloading whenever anyone else input data. When they tried to go to the actual webpage through a browser, their phones would just reopen the Google Sheets app. It is recommended that each group take a laptop or tablet with them that can access the Google Sheets page and does not automatically open the Google Sheets app. Additionally, students found that others would overwrite the data they had already input. As such, students “claimed” lines on the Google sheet by giving them a background color prior to leaving the classroom.
Another solution that may be used in this context is a Google Form. Using this technology would remove the burdens of using Google Sheets described above, but it takes the ownership of the data away from the students and puts it into the hands of the instructor. Depending on the learning objectives of one’s course, this may be the more desirable method for data collection.
3.3 Factorial Design
The third experiment to be discussed here was intended to help students learn more about factorial designs. In this type of design, the possible combinations of the levels of two (or more) factor variables are used as the explanatory variable groups. One of these combinations is then assigned at random to a participant and the response variable is measured.
3.3.1 Prompt
Problem : What is the best way to take a selfie?
Plan
Explanatory variables
What are some factors that you think affect the quality of a selfie? What are potential levels of these factors?
Which of these factors can we control?
Select two factors that you have listed. How many total groups will you have with the factors you have selected?
Response variable
How can we measure the quality of a selfie?
Choose a response variable that we can use to measure this.
Design the experiment
How many participants do you think we need in the study?
How will you ensure that we have a balanced design?
How will participants take their selfies?
Is there anything else that you can think of that will affect the study?
You have been given access to a class Google Sheet. Decide what information needs to be collected from each participant and input these variables into the spreadsheet.
Based on what you have learned from past experiments; is there anything you need to consider for this experiment while collecting data?
Data Collection
Analysis and Conclusion
For this write up, pretend that you are submitting to the school newspaper. Your focus should still be on the design of the experiment. However, try to explain it in a way that someone who has not learned anything about factorial design might still understand what you did and why you did it.
3.3.2 Students’ Experimental Design
For the response variable, students had trouble with the wording of the problem and defining what “best” meant when it came to taking a selfie. Some of the ideas that students came up with to collect data for the response variable that they thought defined “best” included:
Take ten selfies and determine which one you would post to social media.
Take ten selfies and count how many you would post to social media.
Take one selfie and rate it on a scale from one to ten as how likely you are to post it on social media.
In the full-class discussion, students found fault in each of these methods, so they were not used. For the first two options, some students were worried that participants would not find a selfie that they liked in ten photos. They would most likely find one in 100 selfies but then the students were worried about the amount of time it would take to collect the data. Additionally, it was not clearly defined what would be measured for the first option. For the third option students argued that the first selfie almost never looks good and most people would rate it as either one or two and they wouldn’t get very much variability in the data.
It took a while, but students finally settled on the option where the participant would be allowed to take unfiltered selfies until they found one they would be willing to post on social media. The number of photos they took to reach that selfie was taken as the measurement of the response variable. Students were able to come up with a list of potential factor variables for the explanatory variable as well, but eventually settled on the angle of the camera (above, straight on, or below face level) and the lighting of the room (high or low lighting).
3.3.3 Instructor Comments
This was probably the most interesting problem to watch students plan during the semester. Students seemed very interested in the context of the problem, which along with the ambiguity of what to measure for the response sparked a lot of rich discussion about the data to be collected for the experiment. Aspects of using a filter, which app should be used to take the picture and if the selfie could be in a group or alone were all discussion points that students brought up. Even if students had settled on another metric to measure the response, I found the discussion that students had about the pros and cons of possible variables to be very thoughtful and worth the class time.
Discussion from the debriefing after data collection was also valuable. The students realized that some had thought that high level lighting meant that the participant needed to be outside in natural light, while others thought that it meant just having the lights on in a room. Students learned through this experiment that researchers may define levels of variables differently and in particular, subjective wording such as “high” and “low” should be better defined to avoid confusion in future studies. Additionally, the students felt that there needed to be more restrictions on the individuals that should participate in the experiment in the future. Several of the individuals that agreed to participate in the experiment were satisfied with a single selfie because they “just didn’t care” what was posted on social media. The students felt that only individuals that were more discerning of their selfies should be considered for the experiment in the future.
3.4 Random Effects and Nested Designs
This next activity was designed for the module including random effects and nested designs. An experiment utilizes random effects when the treatments are selected at random from all possible treatments. For example, we may believe that people’s perception of a drawn object may be altered, if different artists draw that object (artist effect). If we are not interested in which artists are chosen to draw the object, just that we have pictures from different artists in our sample, then the artist will be a random effect in our design.
A nested design, like factorial designs looks at combinations of factor levels and measures some response variable. The difference between nested designs and factorial designs is that in the nested design, the levels of the second (nested) factor variable differ across the levels of the first factor variable. Continuing with our artist example, each artist may find five individuals to guess what they have drawn. We may number these individuals one through five for each artist. However, guesser one for the first artist is not at all related to guesser one of the second artist, despite having the same label.
Additionally, with the factorial design, several participants are assigned to each combination of levels to utilize replication and to be able to see possible variation. With nested designs, multiple measurements should be taken from each of the combinations to achieve the same goal. Continuing with the example we have been using, we would want to take multiple measurements from the combinations of guesser nested within artist.
When designing this activity for students, I found it difficult to get them to the desired design with typical leading questions. Instead of the usual in-class process that students had followed during the semester’s activities, I decided it would be best to give the students the design for the experiment and just have them implement it. Since students didn’t have to design the experiment themselves, part of their write-up was to describe why this was a nested design and when random effects were utilized in the experiment.
3.4.1 Prompt
Problem : How does our perception affect our opinion and if we take information second hand, can we still trust that information?
Supplies: Notecards with commonly used words and phrases
Plan
Due to the intricacies of the data collection of this experiment, it has already been planned for you.
Data Collection
For this activity, you will need to get into 10 groups of five people.
Select one person at random to be the leader of your group. The leader will need to come to me to get a stack of note cards. Four of these cards will have a word or phrase on them. Four of the cards will be blank. Please give one blank note card to each other member of your team and do not let them see the words on your note cards.
On the back of each the notecards that contains a word or phrase, your leader needs to draw (to the best of their ability) that word or phrase. Please do not let any of your classmates (including members of your group) see your words.
Next, the leader will show the drawing to one of their teammates. The teammate should write their guess on the blank note card that was given to them.
Each teammate will now need to leave the classroom and find a participant who will draw the team member’s guess on the back of the note card they have been provided.
Finally, bring the note cards back to the room. As a class, you will be asked to guess what you think has been drawn on each of the cards. We will determine the proportion of people that can correctly identify the original word or phrase.
Analysis and Conclusions
Please answer the following questions
Why is this a nested design?
What are the layers of nesting within this design?
Are we using random effects or fixed effects for each layer of our design?
Conduct the analysis using software. Are any of the effects significant? Interpret the findings.
3.4.2 Experimental Design
To setup for this experiment, group leaders were given eight note cards. On four of the cards, they had been given a randomly selected word or phrase from a list of common words or phrases that were found on the internet. Additionally the cards were labeled A-1, A-2, A-3, A-4, B-1, B-2, etc. The letter was used as an artist identification and the number was used to identify the word within the group. Each label was put on two note cards, one with a word, and one that was blank. The group leaders were given no more than eight minutes to draw the four words or phrases on the back of the card that contained the original word or phrase. These are identified as “Draw Word …” in .
Figure 4. Diagram of the nested experimental design for the artist experiment
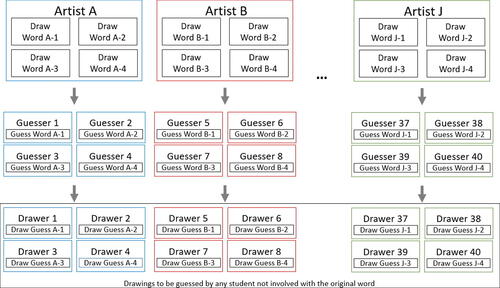
When the team leaders were finished drawing the words they were assigned, they then gave a picture (concealing the word or phrase) to one of their group mates. This group mate needed to guess what they thought the original word or phrase was and write their guess on the blank note card they were given. These are identified as “Guess Word …” in . The group members then needed to go out on campus to find a participant to draw the guess of the word or phrase on the reverse side of the second note card. These are identified as “Draw Guess …” in .
Once this process was complete, the students came back to the classroom and gave the new drawings (now named the products of the experiment) to the instructor. In sequence, the products were placed on the overhead projector and any student not involved with the original word, either as the artist or the guesser, made a mental guess as to what they thought was being depicted in the picture.
Before class a Google Form that allowed students to input the original artist (A through J), the card number (1 through 4) and whether they guessed the original word or phrase correctly (using 1 for correct and 0 for incorrect) had been created. As we cycled through the cards, the students were given just a few seconds to identify what they thought was depicted on the image on the screen. The original artist was then asked to reveal the original word. Students completed the Google Form for each picture and the form data was released to the class after all of the word and image pairs had been shown. The proportion of students who correctly guess the original word was used as the response variable for each product.
3.4.3 Instructor Reflections
This structure worked very well for a class of 50 students (three students were absent on the day of the experiment). If you are working with a smaller class size, you may have your students all be artists. They would then be responsible for finding guessers and re-drawers outside of the classroom.
To ensure that groups aren’t picking their best artist for the experiment and potentially confounding the random artist effect, the students were not told the nature of the experiment before they selected their group leader. Be prepared to handle a lot of laughter and students getting off track when in the guessing phase. Some of the redraws will be completely ridiculous.
3.5 Split Plot Design
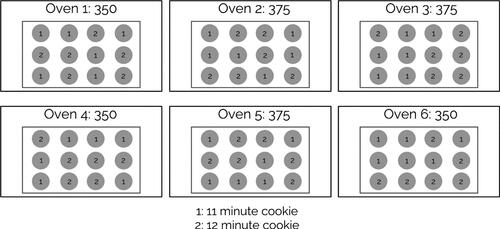
The final experiment to be discussed here was for the Split Plot Design module. A Split Plot design is used when you have a treatment that must be applied to all experimental units in a large setting, but a subset of the units can be given different treatment on a second variable. For example, in an oven, all cookies being baked on a pan will have to be cooked at the same temperature. However, some of the cookies can be randomly assigned to receive different times for cooking. This makes the oven the whole plot, the temperature the whole plot factor, and the time the split plot factor.
3.5.1 Prompt
Problem: Astrid loves to bake cookies. She has recently started a new company that sells the cookies that she bakes. People love her cookies and they are in high demand! She was looking for a way to speed up the process of making the cookies so that she can make more per hour. However, she doesn’t want to sacrifice the quality of her cookies in the process. She has enlisted your help to test customer satisfaction of cookies baked for different times at different temperatures. Suppose that we have six ovens available to us to conduct our experiment.
Our goal is to design a split-plot design to help Astrid answer the question: How long and at what temperature should I bake my cookies?
Supplies: Cookie baking supplies (including an oven); Cookie Dough
Plan
What is the whole plot factor? How do you know?
What is the split plot factor? How do you know?
What is our response variable? How will we measure it?
Give a detailed description of how we would conduct this experiment.
How would you design the spreadsheet for data collection?
Data Collection
Analysis and Conclusion
For your write up for this activity
Describe to Astrid how we designed the experiment. Remember that Astrid is a cookie baker, not a statistician. Be detailed in what you did, but keep the language simple.
What recommendation would you give Astrid based on the data that was collected? Why would you recommend this? Note: you may not find significant results with the data, but Astrid still wants an answer. Make a reasonable decision with the data you have available.
Give Astrid at least two diagrams or graphs to look at that may help her understand the design of the experiment and the results that you found.
3.5.2 Students’ Experimental Design
For this experiment, groups of students were randomly assigned a bag of pre made cookie dough that had a temperature on it: either 350 degrees or 375 degrees. The dough had been made before class in one batch so there wouldn’t be any difference in the dough between the groups and so that there would be enough time to finish the experiment in 75 minutes. The larger batch was partitioned into six smaller batches of equal weight so that students would have the same size cookies when they divided the dough into 12 cookies on their pan. One possible configuration of the experiment can be seen in .
Figure 5. Diagram of a potential Split Plot design for the cookie experiment
The students were then to find participants to eat the cookies and provide ratings for them on a scale from one to ten based on each of their taste, color and texture. The response variable was the sum of the overall ratings for the cookie (a value out of 30 points).
For this experiment, I allowed students to be participants in the study, in that they were allowed to eat one of the cookies that was made during the experiment and then rate it. A problem that we ran into though was that the students were sampling cookies from several of the other groups, causing some independence issues. This occurred partly because we ran out of time at the end of class and students did not have time to find enough participants to eat their cookies. Instead, they had their classmates eat and rate them.
3.5.3 Instructor Comments
This experiment clearly requires the use of a kitchen with multiple stoves. The class needed to be partitioned into very large groups to allow everyone to be part of a group, which meant that several students were not doing anything to help with the experiment (there were too many cooks in the kitchen!). This works much better if you can find enough ovens so that you have just a few students per group, or if you just have a smaller class size.
I recommend making a batch of cookies in one of the school ovens before you allow students to conduct the experiment so you can calibrate the oven temperatures and times in the experiment. I tried this at home and my oven seemed to be a lot more powerful than the ovens at school, making somewhat undercooked cookies to be served to participants. You should also look into the guidelines for preparing and serving food to students at your school.
Should an individual wishing to do this project find themselves without the resources of a school kitchen, the data from this experiment is provided as an extra resource to the readers. After students are given the chance to design the experiment in their groups, a narrative of the actual data collection process could be given to students along with the data so that they can analyze it and provide a solution for Astrid.
4. Concluding Remarks
4.1 Student Reflections
Students were given the chance to reflect on the course through course evaluations. Students’ comments indicated that they found the activities of the course to be informative and fun to implement. Some students found that elements of each of the experiments we did in the course helped them with designing and implementing their own experiments for the final project. For example, one student commented:
“I really liked that each of the experiments we did in class were unique and focused on different elements of designing an experiment. My favorite experiment was the one I did for my final project because I felt like everything learned throughout the course was utilized, and it showed me how many different aspects of designing and implementing an experiment there are.”
Not only were the activities informative, students found them to be fun and something they could take ownership of, especially the ones that involved food. In addition to the Split Plot Design (Astrid’s Cookies) students also got to experiment with bags of M&Ms in the module about contrasts. For example, one student commented:
“I felt like design of experiments really allowed me the chance to be creative with what we were learning in the classroom. We did so many fun activities with taking selfies, M&Ms, throwing a noodle, etc. I thoroughly applied my knowledge doing these hands on activities.”
4.2 Final Reflections
Based on students’ reactions in the classroom and course instructor feedback, it appeared that most students liked the design of the course and the way that the content that was presented. The work that students demonstrated on their final projects showed that they had not only learned the nuances of the designs presented that semester, but also developed some critical thinking skills about factors that may influence the outcome of their study. Additionally, while some students stuck with the familiar completely randomized design for their final project, the research questions most students asked necessitated and subsequently were answered with more advanced designs that we discussed during the semester. Because the students had conducted the experiments prior, they likely felt comfortable using those experimental designs for their independent final projects.
However, as a warning to those that may be considering using guided note outlines, with or without a flipped classroom design, some students didn’t seem to take the course as seriously as others. While students were required to complete the note outlines on their own by watching the video and then complete the canvas quiz to earn credit, some students indicated that they just filled in the blanks without thought, skipped over the discussion questions and then took the quiz. Students either need to be motived to complete the note outlines, or more incentivized, to make sure they are getting the most out of the work done away from the classroom.
Finally, a note about the material covered. Because this was the first iteration of the course, I wasn’t sure exactly how much material the students would feel comfortable covering during the semester. After having taught the course once, I realized that there was room for more material in some of the weeks. In the next iteration of the course, I plan on including lessons for power and sample size calculations and spending a bit more time on the assumptions for inference needed for each type of test.
Data Sharing
Data sharing is not applicable to this article as no new data were created or analyzed in this study.
References
- American Statistical Association. (2016). Guidelines for Assessment and Instruction in Statistics Education College Report. Retrieved from https://www.amstat.org/docs/default-source/amstat-documents/gaisecollege_full.pdf
- American Statistical Association Undergraduate Guidelines Workgroup. (2014). Curriculum Guidelines for Undergraduate Programs in Statistical Science. Retrieved from https://www.amstat.org/education/curriculum-guidelines-for-undergraduate-programs-in-statistical-science-
- Annis, D. H. (2005). Rethinking the Paper Helicopter: Combining Statistical and Engineering Knowledge. The American Statistician, 59(4), 320–326. DOI: 10.1198/000313005X70777.
- Blackwood, R. (2016). AP Reading Best Practices Night. Retrieved from StatsMonkey: http://apstatsmonkey.com/StatsMonkey/ReadBestPractice.html
- Blades, N., Schaalje, G., & Christensen, W. (2015). The Second Course in Statistics: Design and Analysis of Experiments? The American Statistician, 69(4), 326–333. DOI: 10.1080/00031305.2015.1086437.
- Box, G. (1992). Teaching Engineers Experimental Design With a Paper Helicopter. Quality Engineering, 4, 453–459. DOI: 10.1080/08982119208918925.
- Easterling, R. G. (2004). Teaching Experimental Design. The American Statistician, 58(3), 244–252. DOI: 10.1198/000313004X1477.
- Gelman, A., & Nolan, D. (2017). Teaching Statistics: A Bag of Tricks. Oxford University Press.
- Hunter, W. G. (1977). Some Ideas About Teaching Design of Experiments with 2 (to the 5th) Examples of Experiments Conducted by Students. The American Statistician, 31(1), 12–17. DOI: 10.1080/00031305.1977.10479185.
- Lawrance, A. J. (1996). A Design of Experiments Workshop as an Introduction to Statistics. The American Statistician, 50(2), 156–158. DOI: 10.1080/00031305.1996.10474364.
- Lee, H. S., Mojica, G. F., Thrasher, E. P., & Baumgartner, P. (2022). Investigating Data Like a Data Scientist: Key Practices and Processes. Statistics Education Research Journal, 21(2). DOI: 10.52041/serj.v21i2.41.
- Muehlenstaedt, T., & Lanzerath, M. (2019). Teaching Split Plot Experiments With a Boomerang Tin. arXiv. DOI: 10.48550/arXiv.1907.10684.
- Oehlert, G. W. (2010). A First Course in Design and Analysis of Experiments. Gary W. Oehlert.
- Wickham, H. (2014). Tidy Data. The Journal of Statistical Software, 59(10), 1–23. DOI: 10.18637/jss.v059.i10.
- Wild, C. J., & Pfannkuch, M. (1999). Statistical Thinking in Empirical Enquiry. International Statistical Review, 67(3), 223–248. DOI: 10.1111/j.1751-5823.1999.tb00442.x.