 ?Mathematical formulae have been encoded as MathML and are displayed in this HTML version using MathJax in order to improve their display. Uncheck the box to turn MathJax off. This feature requires Javascript. Click on a formula to zoom.
Abstract
Engaging and motivating students in undergraduate statistics courses can be enhanced by using topical peer-reviewed publications for analyses as part of course assignments. Given the popularity of on-campus therapy dog stress-reduction programs, this topic fosters buy-in from students whilst providing information regarding the importance of mental health and well-being as it impacts learning. This article describes how instructors can use a study on the benefits of human–dog interactions to teach students about study design, data collection and ethics, and hypothesis testing. The data and research questions are accessible to students without requiring detailed subject-area knowledge. Students can think carefully about how to collect and analyze data from a randomized controlled trial with two-sample hypothesis tests. Instructors can use these data for short in-class examples or longer assignments and assessments, and throughout this article, we suggest activities and discussion questions. Supplementary materials for this article are available online.
1 Introduction
The Guidelines for Assessment and Instruction in Statistics Education (GAISE) college report (Carver et al. Citation2016) lists six primary goals for statistical education in the college setting. Within, we describe a real dataset that can help instructors address several of these goals. Primarily, the use of real data satisfies the third recommendation from the GAISE report, to “integrate real data with a context and purpose.” Instructors can further use these data to build lessons that address other recommendations (e.g., teaching statistical thinking and the use of technology to explore concepts and analyze data) or assessments to improve and evaluate student learning. In this article, we describe how a study on the use of dogs to help college students handle stress can be used to teach students about study design, data collection, ethics, and hypothesis testing.
Across studies, being a university student is characterized by heightened stress and compromised mental well-being (American College Health Association and others Citation2018; Usher and Curran Citation2019; Barbayannis et al. Citation2022), which can compromise students’ learning and overall experience on campus (Seldin Citation1991; Lin and Huang Citation2014; Amanvermez et al. Citation2020; Wilson Citation2020; King et al. Citation2021; Binfet et al. Citation2022). This is especially the case for first-year students who must adjust to living away from parents, establish new social networks, and meet intensified course expectations (Reddy, Menon, and Thattil Citation2018; Pascoe, Hetrick, and Parker Citation2020). Students are known to experience Academic Stress which Barbayannis et al. (Citation2022, p. 1) describe as arising from: “… novel academic stressors, such as an extensive academic course load, substantial studying, time management, classroom competition, financial concerns, familial pressures, and adapting to a new environment.” The COVID-19 pandemic has exacerbated these challenges and has added additional stress from disruption to learning and everyday life, severe illness, and friends and family who may be at high risk from the virus. Students have reported increases in stress and anxiety due to the pandemic (Son et al. Citation2020; Wang et al. Citation2020).
One low-cost and low-barrier way in which college students may reduce their stress is through canine-assisted stress-reduction programs that provide opportunities for students to interact with therapy dogs (Barker et al. Citation2016; Pendry and Vandagriff Citation2019). Typically a drop-in format not requiring an appointment is offered and provides students access to multiple dog-handler teams so that students are able to interact with therapy dogs as a way to reduce their stress. In this article, we illustrate how a recent peer-reviewed publication on the effects of a canine-assisted intervention can be leveraged to engage students and teach key analytic concepts within the context of an undergraduate statistics class.
Binfet, Green, and Draper (Citation2022) conducted a randomized controlled trial to investigate whether interacting with dogs helped increase feelings of well-being and decrease feelings of ill-being. Psychology students from a mid-sized Western Canadian university were assigned to one of three treatment groups: (a) direct contact with a dog, (b) indirect no-touch contact, and (c) a control group that met a dog handler without the dog. Student well-being and ill-being were measured before and after the experiment with pre- and post-test surveys.
In this article, we describe how instructors can use the dog interaction data from this study in statistics courses. Collecting data for such a randomized controlled trial requires careful planning, but the experimental setting and resulting data are personally relevant and accessible to students without requiring specialized background knowledge. Furthermore, while a rich dataset was collected by Binfet, Green, and Draper (Citation2022), the main research question—does mental health improve after interacting with dogs?—can be answered with two-sample hypothesis tests, which are standard in first- and second-semester statistics courses, as well as discipline-specific research methods courses. This makes the dog interaction data an excellent resource for teaching students about study design and hypothesis testing. Multivariate thinking can be encouraged by comparing and combining measures of well-being and ill-being. Because Binfet, Green, and Draper (Citation2022) also collected demographic data on participants to check for any systematic differences between treatment groups that may influence the results, the data also provide opportunities to discuss important topics in data collection, ethics, and data identifiability, crucial subjects in the statistics curriculum (Kim and Hardin Citation2021; Baumer et al. Citation2022). Finally, much of the original research paper is accessible to introductory students and can be used to teach students how to engage with the primary literature.
We consider the exploration and analysis of the dog interaction data in the remainder of this article. Section 2 discusses an activity that instructors can use to help students learn to read research articles, which introduces several open-ended discussion questions on the data collection process. Section 3 describes the study and data in more detail and suggests teaching topics on data collection choices and identifiability. We explore the data itself in Section 4 and analysis of the research questions in Section 5. Finally, in Sections 6 and 7, we discuss how we have used these data in the classroom, and suggest other possible examples of future use.
1.1 Data and Code
The data from Binfet, Green, and Draper (Citation2022) are available at https://github.com/ciaran-evans/dog-data-analysis, along with an R script (R Core Team Citation2021) containing code for all the analyses described in this article. The raw data (before any cleaning or pre-processing) are stored in dog_data_raw.csv. The R script dog_data_cleaning.R processes the raw data and saves the cleaned data as dog_data_cleaned.csv. The script data_analysis.R works with the cleaned data (dog_data_cleaned.csv) to produce the results in this article.
As described in Section 3, the original data have been modified to protect student anonymity; all analysis in this manuscript is done with the modified data. The behavioral research ethics board that originally approved the study has also approved the release of the de-identified data. The code uses the tidyverse (Wickham et al. Citation2019) for data cleaning and visualization, and the emmeans package (Lenth Citation2022) for comparing marginal means. While R is the language we use in our classes, instructors could use other software similarly.
2 Engaging with the Original Research Paper
A benefit to working with the human-canine interaction data from Binfet, Green, and Draper (Citation2022) is that the original research paper is accessible to students without specialized knowledge. This provides students a valuable opportunity to see the skills taught in a first- or second-semester statistics course used to answer a real research question and to practice engaging with the primary literature. We recommend having students read and discuss the original article before they begin working with the data, allowing them to read first-hand about the study design, data collection, and analysis choices made by the researchers.
As introductory students often have little experience reading primary literature, providing specific instructions describing how to read and understand a research article is helpful. This can include some initial reading about how to engage with a research article (Raff Citation2016; Gonzalez-Marquez et al. Citation2022), or starting with a popular press article about this research (Fitzner Citation2021; Binfet et al. Citation2022) before pursuing the details. An initial reading of the research article can focus on identifying the main features of the study: the specific research question and hypotheses, information about the study participants, a summary of the variables recorded, and the key results. If desired, future readings can be used to focus on more specific details about data collection and analysis methodology.
To help students engage with the article, we have created an activity that walks students through the most important sections of the manuscript, avoiding additional details which may be initially overwhelming. This activity is available at https://github.com/ciaran-evans/dog-data-analysis and at https://ciaran-evans.github.io/files/dog_paper_activity.html, and we recommend providing the activity as a homework assignment or allowing students a full class period to complete it. The activity is adapted from the one described in Evans (Citation2022), in which students engaged with a study on mass and metabolic rate in marine bryozoans.
HELPFUL HINT: This activity should not be used as the first introduction to data collection topics. Before reading the article, it is helpful if students understand what it means to assign subjects to treatment groups and what a randomized controlled trial is.
TEACHING TIP: Several questions on the activity (such as questions 4, 8, and 11) allow for open-ended in-class discussion about data collection and ethics.
3 Study and Data
3.1 Recruitment
Participants in the human-canine contact study were recruited from students in undergraduate psychology courses at a mid-size Canadian University. In total, 284 students participated and were randomly assigned to one of three treatment groups: Handler-only contact (no dog was present; n = 94), Indirect contact (a dog was present, but students could not touch the dog; n = 95), and Direct contact (students could interact with the dog; n = 95).
3.2 Demographic Information and Identifiability
Study participants provided demographic information such as age, year in school, race, ethnicity, and whether they had any pets. in Binfet, Green, and Draper (Citation2022) summarizes the participant demographics, and this table can be used to discuss choices made in data collection. For gender, participants could select from four options: Male, Female, Non-Binary, and Other. We note that these selections are more consistent with language for sex than gender (Heidari et al. Citation2016; Dessie et al. Citation2021). For ethnicity, 14 options were available, and participants could select more than one. The options provided naturally lead to several questions about the data collection process, which get students thinking about the challenges in recording data:
Table 1 Paired sample t-test statistics comparing well-being and ill-being measures before and after treatment.
Why might researchers provide specific options for gender/ethnicity rather than having every participant write in a response?
Data were collected in Canada. How might the options for ethnicity change if the study were administered in the US? Elsewhere?
How might you change the experimental design or measurement to assess the research question? How might these changes in data collection choices affect our statistical analysis later on?
Students should realize that the data we collect impact the questions we can ask later on, and there is a tension between gathering detailed information and being able to use that information in statistical analyses. For example, five or fewer study participants selected 10 of the ethnicity choices, making it difficult to include every level of ethnicity in a model. But grouping these diverse ethnicities into one category does limit the meaning of ethnicity as a variable in the data.
While a variety of demographic variables were collected by Binfet, Green, and Draper (Citation2022), to make the study data available while protecting participant privacy, we have removed variables like ethnicity and gender. Since these demographic variables are not the primary target of analysis, their exclusion from the released data does not prevent us from reproducing the main results in Binfet, Green, and Draper (Citation2022).
TEACHING TIP: Students might ask, reasonably, why it is acceptable for summaries of demographic variables to be included in in Binfet, Green, and Draper (Citation2022) when we have removed some of these variables from the data to prevent participants from being identified. The answer is that participants are more easily identified when we can see combinations of demographic variables in the data (e.g., their age, and their hometown, and their gender).
TEACHING TIP: Students can understand intuitively that combinations of demographic variables make it easier to identify study participants. This intuition can be made formal through concepts like k-anonymity (Sweeney Citation2002). We also recommend the examples discussed in Baumer et al. (Citation2022) for further discussion on de-identifying (and failing to de-identify) real data.
POTENTIAL PITFALL: Since the human-canine contact study was a randomized controlled trial, students may need clarification about why the researchers collected demographic information in the first place. While random assignment should remove confounding variables, it is still common to collect demographic information to (a) describe the students who participated (students volunteered, so we don’t have a random sample), (b) check for any big differences between treatment groups which may have occurred by chance, and (c) check and demonstrate to which population(s) the analyses are generalizable. However, it is worth noting that testing for balance between treatment groups in a randomized controlled trial is controversial; Senn (Citation1994) gives a good argument that these tests are unsound.
3.3 Well-Being and Ill-Being Measures
To measure participants’ well-being and ill-being, each participant responded to a series of Likert scale questions targeting aspects of their social and emotional welfare. Well-being and ill-being were measured by several different scales, where each scale is a single number expressing one feature of well-being or ill-being. For example, a larger number on the Happiness scale indicates that the participant feels happier. These scales are calculated by averaging the responses for several Likert questions; for example, Loneliness scores were calculated by averaging responses to a set of 20 items, while Flourishing scores were calculated by averaging responses to a different set of 8 items.
There are nine measures used in Binfet, Green, and Draper (Citation2022), with five well-being measures (positive affect, happiness, flourishing, social connectedness, and engagement) and four ill-being measures (negative affect, stress, homesickness, and loneliness). We provide a short description of each measure here; detailed motivation for the different scales can be found in Binfet, Green, and Draper (Citation2022), and our data dictionary (Supplementary Materials) describes how each variable is calculated from the raw data.
Positive affect scale (Thompson Citation2007) (PANAS_PA): How participants rate their alignment with positive characteristics–higher scores indicate more positive feelings, emotions, judgment, and motivations. Calculated as the average of five Likert items, with any missing values omitted.
Negative affect scale (Thompson Citation2007) (PANAS_NA): How participants rate their alignment with negative characteristics–higher scores indicate more negative feelings, emotions, judgment, and motivations. Calculated as the average of five Likert items, with any missing values omitted.
Happiness scale (Lyubomirsky and Lepper Citation1999) (SHS): How participants feel about their happiness–higher scores indicate happier participants. Calculated as the average of three Likert items, with any missing values omitted.
Flourishing scale (Diener et al. Citation2010) (FS): How participants feel about their life–higher scores indicate greater psychological well-being. Calculated as the average of eight Likert items, with any missing values omitted.
Social connectedness scale (Lee, Draper, and Lee Citation2001) (SCS): How participants feel about their social surroundings and relationships–higher scores indicate a stronger sense of social connectedness. Calculated as the average of 20 Likert items, with any missing values omitted.
Stress scale: How participants perceive their stress levels–higher scores indicate more stress. This is measured by one Likert item.
Homesickness scale: A self-reported level of homesickness–higher scores indicate higher levels of homesickness. This is measured by one Likert item.
Engagement in the campus community: How participants perceive their integration into campus life–higher scores indicate better integration. This is measured by one Likert item.
Loneliness scale (Russell Citation1996): A 20-item scale designed to measure participant loneliness–higher scores indicate more loneliness. Calculated as the average of 20 Likert items, with any missing values omitted.
3.3.1 Discussing Measurements
POTENTIAL PITFALL: Students who have not seen Likert items may be unsure whether they should treat responses as categorical or quantitative variables.
It is common for researchers to use Likert items to code the responses as integers (e.g., 1–5) and then average items to produce a single score; this is the analysis method used by Binfet, Green, and Draper (Citation2022). However, this coding and averaging treats Likert responses as interval variables, for which the change from 1 to 2 (e.g., “strongly disagree” to “disagree”) is the same as the change from 2 to 3 (e.g., “disagree” to “neither agree nor disagree”).
There is some disagreement in the literature about whether this analysis scheme is reasonable, so there is not a single easy answer for confused students. The Likert items in this study can then be used to motivate discussion on measurements, and students can brainstorm what assumptions are being made when Likert responses are treated as interval variables. For more advanced students, Likert items could also be used to motivate nonparametric tests and ordinal regression models. Bishop and Herron (Citation2015) provide arguments illustrating both sides of the Likert scale argument and give general advice on when it may be appropriate to treat Likert data as interval versus ordinal.
3.4 Data
The raw human-canine interaction data (dog_data_raw.csv in the Supplementary Materials) consists of 284 rows (one for each study participant) and columns recording group assignment, demographic information, and pre/post Likert answers to the well-being and ill-being survey items. In the raw data, each item has its own column (e.g., there are 20 columns for pre-test Loneliness items and 20 columns for post-test Loneliness items). Before further exploratory data analysis or modeling, several data cleaning and transformation steps are required. These steps involve handling missing values, transforming and combining columns, and pivoting the data into a longer shape. Advanced statistics and data science students can be asked to do the cleaning independently. At the same time, instructors may provide introductory-level students with a pre-processed dataset (dog_data_cleaned.csv) at https://github.com/ciaran-evans/dog-data-analysis. However, it can still be valuable for lower-level students to see the raw data even if they don’t clean it themselves. Our data dictionary (Supplementary Materials) includes variable descriptions for raw and cleaned data, and we discuss data cleaning steps in more detail in Section 4.1.
TEACHING TIP: Different software could be used for data cleaning and processing. In our classes, we use R, and we find that the dplyr and tidyr packages (Wickham et al. Citation2021; Wickham Citation2021) provide valuable functions like mutate, across, and pivot_longer which we use for preparing this data. Our R code can be found at https://github.com/ciaran-evans/dog-data-analysis. We also note that the data are reasonably sized to explore using spreadsheet software (e.g., Microsoft Excel or Google Sheets).
TEACHING TIP: This data set is a good example for students that even when a study is carefully designed and the data are recorded in a logical and reasonable manner, substantial data cleaning may be required before statistics can be done.
3.5 Research Questions
Binfet, Green, and Draper (Citation2022) explored three related hypotheses:
All treatment groups would have significantly higher measures of well-being and lower measures of ill-being after treatment.
The treatment groups that interact with dogs would have significantly higher measures of well-being and lower measures of ill-being compared to the handler-only treatment.Footnote1
Direct contact with a therapy dog would yield greater benefits than indirect contact treatment.
The first hypothesis can be investigated using paired-sample tests to compare pre- and post-test scores within each treatment group. In contrast, the other two hypotheses are investigated by testing for differences in post-test scores between treatment groups after accounting for pre-test scores.
4 Exploratory Data Analysis
4.1 Data Preparation
The first data cleaning step is to handle missing values appropriately. Missing values are easy to explain in the survey data: the study participant didn’t answer the question (something most of us have done when responding to surveys!). If students have seen missing values before, they may be used to missing values simply being empty cells in a table (which get read into R as NAs). However, when data are recorded by hand, missing values may be coded in different ways. For example, in the canine contact survey, missing values are variously coded as” N/A”,” x”,” “,” n/a”,” Doesn’t apply”,” X”, and” 9999”. Each of these needs to be correctly converted into the same NA when the data is loaded. Finally, several Likert-scale responses to the well-being/ill-being items are outside the range of that item (e.g., an answer recorded as “6” on a scale from 1 to 5). These responses should also be converted to NA.
POTENTIAL PITFALL: Don’t expect students to be able to find all of these ways of coding missing values on their own. If students are cleaning the data themselves, we recommend providing a list of all the ways missing values are coded. Alternatively, one can suggest concrete steps that will lead students to find such values (e.g., plotting to catch negative values of nonnegative variables).
POTENTIAL PITFALL: Students may be used to removing rows with missing values (e.g., na.omit or drop_na in R). Removing rows with missing values is not appropriate here. Several demographic variables have many missing values, and missing values in the well-being/ill-being measures will be handled by excluding NAs when calculating summary statistics rather than removing the rows entirely.
After handling missing values, the well-being/ill-being item responses need to be combined into pre/post scores for Positive Affect, Negative Affect, Happiness, Social, Flourishing, Stress, Homesickness, Loneliness, and Engagement. Each of these scores is an average of a subset of survey items, where NAs are omitted when computing the average. For example, the Happiness score is an average of three related items targeting student happiness. Before averaging item responses, however, several items are recoded to reverse their scale; for example, on a scale from 1 to 5, a response of 1 is recoded as a 5, a response of 2 is recoded as a 4, etc. This reversal is required so that higher numbers have a consistent meaning within a score.
The data processing code is found in our dog_data_cleaning.R script, which converts the raw data (dog_data_raw.csv) to the cleaned data (dog_data_cleaned.csv).
HELPFUL HINT: In R, the across function in the dplyr package is helpful for simultaneously modifying multiple columns in the same way. This avoids writing the same code for each of dozens of columns.
TEACHING TIP: Several of the scales, such as the positive and negative affect scores, are comprised of multiple items trying to measure the same trait. Reliability measures like Cronbach’s alpha can be used to assess the internal consistency of these scales.
4.2 Exploring Well-Being and Ill-Being Measures
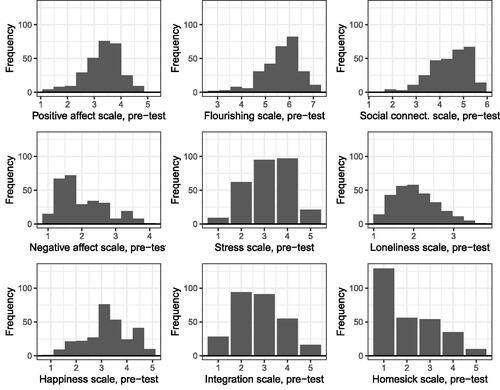
Students can begin by examining the distributions of well-being and ill-being measures in the processed data (dog_data_cleaned.csv) to describe the general population of students participating in the study and the typical values these variables take in the data. Example plots are shown in , which show the pre-test distributions of the well-being and ill-being measures. From , students tend to report reasonably high levels of flourishing and social connectedness and reasonably low levels of negative affect and loneliness. However, many students also report high stress levels, so we might hope that the canine contact intervention will help decrease students’ stress.
Fig. 1 Pre-test distributions of well-being and ill-being measures.
Are the well-being and ill-being measures capturing what we want them to? If so, we might expect positive correlations between two well-being measures or two ill-being measures and negative correlations between well-being and ill-being measures. For example, students with high social connectedness or flourishing would be generally expected to have lower loneliness. confirms that some measures, like social connectedness and loneliness, are indeed highly correlated.
Fig. 2 Relationships between several well-being and ill-being measures. A small amount of jitter has been added to the points to see the relationships more clearly.
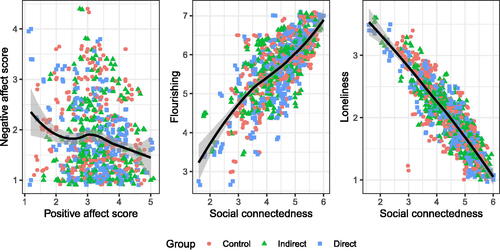
TEACHING TIP: In addition to examining pairwise relationships with scatterplots, students may also make correlation matrices to summarize the strength of these relationships. Some measures, like positive affect and loneliness, are the average of many Likert items, so Pearson correlation is a reasonable choice. But other measures, like stress and homesickness, can take only a few ordered values, and Kendall’s τ may be a better choice. This relates to the discussion in Section 3.3.1 about whether Likert responses should be treated as quantitative variables.
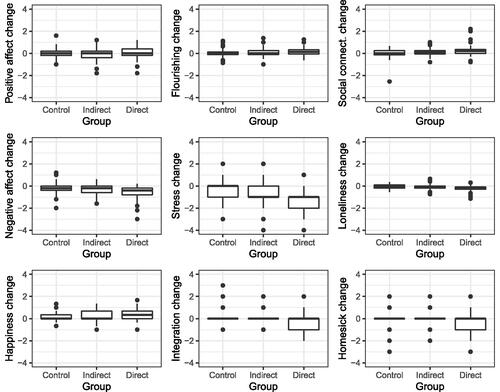
To investigate the impact of the three treatments and examine the three hypotheses from Section 3.5, we created to demonstrate the change in well-being and ill-being measures after treatment for each treatment group. The boxplots suggest that the first hypothesis could be correct, with potential increases in flourishing and social connectedness for each group and potential decreases in negative affect, stress, and loneliness for each group. Furthermore, the Direct group appears to have the greatest decreases in negative affect, stress, and loneliness, followed by the Indirect group. This supports the second and third hypotheses from Section 3.5.
Fig. 3 Differences between post-test and pre-test scores for several well-being and ill-being measures.
5 Hypothesis Tests
5.1 Testing Hypothesis 1
The researchers’ first hypothesis is that each treatment group will exhibit an increase in well-being measures and a decrease in ill-being measures. To test this hypothesis, we can use a paired-sample t-test which compares a measure of well-being/ill-being before and after the treatment. Many measures are used in the original paper, such as stress, loneliness, and happiness. Ultimately, we will conduct the hypothesis test for each measure, but it is easier for students to focus on one to start. We recommend looking at stress, which is easy for students to understand and is measured by a single question in the pre/post surveys.
Let denote the true mean change in stress after treatment for participants in the handler-only treatment group. We test the hypotheses
(1)
(1)
Likewise define and
, and test similar hypotheses. For the handler-only group, the test statistic is
, and the p-value is
. For the indirect-contact group,
and
, and for the direct-contact group
and
.
POTENTIAL PITFALL: Students often incorrectly interpret p-values as the strength of a relationship, rather than the strength of evidence. Students examining the p-values for these tests may notice that the direct-contact group has the smallest p-value and incorrectly conclude that direct contact results in the greatest decrease in stress. While it is true that the mean decrease in stress is greatest for the direct contact group, this does not follow immediately from the order of the p-values (which incorporate variability as well).
POTENTIAL PITFALL: Even if students understand why handler-only contact is the control group (rather than no contact), they may be confused that we also hypothesize a benefit to interacting with handlers. Point out that interacting with handlers involves chatting about topics other than work and school with a group of their peers, which could still reduce stress. The other two hypotheses aim to test whether interacting with dogs reduces stress more than just interacting with handlers.
TEACHING TIP: Reading the American Statistical Association’s statement on p-values (Wasserstein and Lazar Citation2016) can help demonstrate the importance of context when significance testing. We also find conversations about different levels of significance (e.g., Benjamin et al. Citation2018) and significance versus importance (e.g., Witmer Citation2019) to be helpful when introducing these types of analyses.
Having done paired-sample tests for one variable (stress), we can conduct the same tests for the other variables. The results are shown in . We can see a significant increase in several well-being measures and a significant decrease in several ill-being measures, particularly for the direct-contact treatment.
TEACHING TIP: To discuss reproducibility, students can compare their results with Table 3 in Binfet, Green, and Draper (Citation2022). Students should notice that while most p-values agree, the test statistics shown in Binfet, Green, and Draper (Citation2022) are all positive–the absolute values are reported. For a few measures (e.g., indirect-contact PANAS_PA), the test statistics and p-values are slightly different than the ones reported by Binfet, Green, and Draper (Citation2022). This occurs because we have removed a few erroneous observations outside the allowed range of the data, which were not removed in the original paper.
HELPFUL HINT: Students may need guidance to realize they need to test the hypotheses (1) within each group. If all groups are combined, a significant change could result from a change in one or two groups, even if the other groups show no difference before and after treatment. For example, the handler-only group shows no significant difference in Flourishing before and after treatment, while the direct-contact group shows a significant increase. When the groups are combined, the test still shows a significant increase in Flourishing.
5.1.1 Multiple Testing Issues
By performing multiple hypothesis tests—one for each variable—we are checking whether treatment results in a significant change in at least one of the well-being/ill-being measures. With nine different variables, this could cause multiple testing issues. Suppose all hypotheses are truly null and independent, and we reject at the 0.05 level. In that case, the probability of rejecting at least one of the hypotheses is now (much higher than 0.05!).
The probability of incorrectly rejecting at least one hypothesis (i.e., making at least one Type I error) is called the family-wise error rate (FWER). It can be controlled by changing the threshold for rejecting H0 (or, equivalently, by correcting the resulting p-value). One option is a Bonferroni correction; with nine tests, to control the FWER at 0.05, we reject when , or equivalently let
and reject when padj < 0.05. An advantage of the Bonferroni correction is that no assumptions are made about the independence of the different tests, which is important here because the measures of well-being/ill-being are correlated.
TEACHING TIP: With nine variables, a Bonferroni correction is manageable. Ask students what would happen if we increase the number of variables–how strong does our evidence need to be to reject H0? If we control the FWER at 0.05, how many variables would we need to test before we fail to reject any of the hypotheses in ? This can present an opportunity to consider other correction methods.
5.2 Testing Hypothesis 2
The researchers’ second hypothesis is that the indirect- and direct-contact groups will have larger increases in well-being measures and decreases in ill-being measures.
To compare post-test scores across treatment groups while accounting for subjects’ pre-test scores, we can use an analysis of variance (ANOVA) test based on the following regression model:
(2)
(2) where
and
are indicator variables for the direct and indirect treatment groups, respectively. This enables us to compare the treatment groups based on estimated marginal means of the after-treatment well-being/ill-being measures controlling for before-treatment baselines.
Post hoc testing can be used to contrast the estimated marginal means of the indirect- and direct-contact groups and the control group.
Continuing with the stress outcome, we aim to complete the following test to show that the treatment groups are better than the control group.
(3)
(3)
A significant ANOVA test provides evidence of a difference, but post hoc testing is required to determine where the difference(s) are. To assess the second hypothesis, we aim to evaluate the following post hoc test.
Since the regression model involves no interactions, this is equivalent to comparing the marginal means for each group:
(4)
(4)
Likewise, we would complete a similar hypothesis test for .
For the indirect-contact contrast, the test statistic is , and the Bonferroni-adjusted p-value is
. For the direct-contact contrast, the test statistic is
, and the Bonferroni-adjusted p-value is
. Similar tests can be performed with the other well-being and ill-being measures, and the results are shown in .
Table 2 ANOVA contrast results comparing changes in well-being and ill-being measures across treatment groups.
TEACHING TIP: The second research question can also be evaluated by testing
(5)
(5) and
(6)
(6)
This approach can be helpful in earlier statistics courses.
POTENTIAL PITFALL: Students may be inclined to continue with a repeated-measures or paired-samples analysis as in the analyses for Hypothesis 1. It is important that students realize that this hypothesis evaluates differences between the treatment groups, not within.
POTENTIAL PITFALL: Students may find it confusing that the hypotheses are one-sided, whereas the tests used are two-sided. In much published research, two-sided tests are used, and the direction of the result is interpreted (e.g., whether the t statistic is positive or negative).
POTENTIAL PITFALL: If students read the supplementary materials for the original manuscript, they will find that the researchers performed a different analysis.
This approach evaluates the mean difference between the average of the Direct- and Indirect-contact groups means and the control group mean, which represents the answer to a slightly different question.
TEACHING TIP: We recommend discussing the differences between the analyses we describe within and those in the original manuscript. The original hypothesis aims to evaluate whether the interventions where a dog is present are more effective. This approach reduces the number of hypothesis tests that are required by only conducting the planned contrasts described above. Still, the approach we present accounts for certain edge cases the original approach does not. For example, consider the case where Direct-contact has a positive effect, Indirect-contact has a negative effect, and the Handler group had no effect. It is possible the positive and negative effects “cancel out,” leading to the conclusion that the treatments are not effective.
5.2.1 Multiple Testing Issues
Testing the researchers’ second hypothesis for a given well-being or ill-being measure requires two hypothesis tests, so we must consider multiple testing issues. Above, we used a Bonferroni correction (Bonferroni Citation1936) to adjust for various comparisons resulting from each set of post hoc inferences. This controls the FWER within each well-being/ill-being measure. However, the research question is being investigated with nine different well-being/ill-being measures, so we may wish to control the FWER across these measures too.
TEACHING TIP: We could imagine several different approaches to controlling the FWER across all hypothesis tests (both within and between well-being/ill-being measures). One approach would be to apply an adjustment (e.g., a Bonferroni correction) to the p-values shown in . Another would be to treat all pairwise comparisons separately and simultaneously apply a Bonferroni correction to the 9 × 2 = 18 pairwise comparisons involved in the researchers’ second hypothesis. More advanced students could be asked to design a simulation study to verify whether these different approaches do, in fact, control the overall FWER and to compare their power.
TEACHING TIP: One may notice that controlling FWER across measures with a Bonferroni adjustment could result in losing power due to the conservative approach. This can motivate discussing the False Discovery Rate (FDR) and approaches for controlling FDR (e.g., Benjamini and Hochberg Citation1995).
TEACHING TIP: In the next section, we will see that the necessary test for the third research question is the remaining pairwise difference between the direct- and indirect-contact groups. This provides the opportunity to introduce, explain and discuss Tukey’s Honestly Significant Difference (HSD) as well as other adjustments (e.g., Scheffé Citation1953; Šidák Citation1967).
5.3 Testing Hypothesis 3
After investigating the researchers’ second hypothesis, students may wonder about the third possible pairwise comparison between the direct- and indirect-contact groups. This comparison is the focus of the researchers’ third hypothesis: that the direct-contact group will have larger increases in well-being measures and decreases in ill-being measures than the indirect-contact group. The ANOVA analysis and post hoc testing approach from Hypothesis 2 can be used to compare the differences in well-being/ill-being measures before and after the treatment across these treatment groups.
Continuing with the stress outcome, we aim to complete the following test to show that direct contact is better than indirect.
(7)
(7)
Recall that post hoc testing is required to determine where the difference(s) are, as done in the analyses for the second hypothesis. To assess the third hypothesis, we aim to evaluate the following post hoc test.
(8)
(8)
For this contrast, the test statistic is and the p-value is
.
TEACHING TIP: The third research question can also be evaluated by testing
(9)
(9)
However, we note that this approach may be more complicated to explain. For example, the topic of multiple comparisons becomes more complicated because the idea of ‘all pairwise comparisons’ is no longer applicable.
Clearly, the tests performed for the researchers’ second and third hypotheses are very similar. It may make the most sense to test both research questions together by simultaneously testing all three pairwise comparisons with Tukey’s HSD test. shows the p-values for each pairwise comparison using Tukey’s method.
POTENTIAL PITFALL: In these analyses, the difference in means for SHS between the Direct- and Indirect-contact groups is statistically significant (t = 2.34, p = 0.0201) when analyzing Hypothesis 3 separately (i.e., with no multiple comparisons adjustment). When computing all pairwise comparisons for answering Hypothesis 2 and 3 simultaneously, this difference no longer reaches traditional levels of statistical significance (t = 2.34, p = 0.0522).
6 Uses in the Classroom
These data help encourage a broad range of discussions about important statistical concepts like experimental design, sampling errors, non-sampling errors, measurement, variable types, the debate about statistical significance, and multiple testing issues. It helps that the experimental design and concept being tested are highly relatable to college students, making these conversations more approachable.
In introductory courses, we find that it is often challenging to find meaningful one-sample problems. Hypothesis 1 provides a meaningful, real-world example of a one-sample test, if we portray the differences as one sample. Further, the question can be asked for multiple responses and treatment types, which means there are plenty of similar exercises to assign students. We find that students who have difficulty seeing it the first time, often find success when practicing on another outcome themselves or with peers. Conveniently, this leaves additional opportunities for assessment on homework assignments, quizzes, or exams; for example, can they generalize the problem-solving approach to (a) different variables and (b) different treatments?
While Hypotheses 2 and 3 are often beyond the reach of an introductory course, we have found some success by simplifying the analyses and portraying them as two-sample problems by not accounting for pre-test scores. In Spring 2023, we taught a redesigned section of an introductory statistics course that focused on understanding and interpreting rather than mechanics that depend on previous math experience (i.e., algebra). We found that students could approach the full analysis using R Shiny ApplicationsFootnote2 (The Data Science Collaboratory at Colgate University Citation2023), which shouldered the mathematical burden of the more complex analyses. With this approach, these data can be used to help students build their statistical judgment as they learn to conduct one-sample tests, come to understand the need for two- or k-sample tests, and progress to “controlling” for other variables through regression analyses.
POTENTIAL PITFALL: The ANOVA and linear regression applications only conduct all pairwise comparisons, so students cannot fit a subset of comparisons or custom linear contrasts. Instruction has to be modified to fit the technology being used and the level of the material discussed.
Intermediate or advanced courses enjoy the same benefit of real-world data that motivates learning goals in an order that generally maps onto their learning. The approach described for introductory courses applies here and enables instructors to discuss the statistical and coding aspects of each hypothesis. We have used these data to demonstrate topics in class and assign exercises to students to ensure they can generalize statistical procedures and coding techniques to new variables, treatments, and contrasts. As discussed in Section 5.2, Binfet, Green, and Draper (Citation2022) use a different approach to coding and testing contrasts, which makes this study a good example of how contrasts can be specified in different ways. Students generally find the fact that there are multiple correct ways to conduct an analysis confusing, but it provides motivation for rich conversation about the subjectivity aspects of statistics and the “researcher’s degree of freedom.”
We have also used these data as the premise for a midterm exam coupled with peer review and revision. During a timed midterm, provided as supplementary material, we ask students to complete an initial analysis where we ask them to demonstrate their learning about one-sample statistical inference and R coding (e.g., tidyverse and ggplot2). After the midterm, students engage in peer review to demonstrate they can approach the data analyses themselves and evaluate others’ analyses completed by their peers. The peer review process takes a couple of weeks, so when they refine their analyses and write their final report, students expand their analysis from the midterm by considering two-sample tests. We later ask students to conduct the regression-model approach on a homework assignment.
Using these data throughout their learning lets students see and track their progress more clearly. Their learning is demonstrated by their ability to answer new and more complex questions about the data, and having them build upon their initial analysis enables students to experience this firsthand. We note that in a more traditional course, this can be made to be (a) an exam 1 and exam 2, (b) a midterm and final exam by incorporating the use of regression, or (c) through a series of homework assignments.
TEACHING TIP: Binfet, Green, and Draper (Citation2022) provided well-documented supplemental material for their work, including code for conducting their analyses. Instructors should be aware that these materials are available and ensure that students know that the approaches they learn in class may differ from those used by the researchers.
We have found students to be eager to engage with the experimental data, as it is highly relatable to their experience. The overlap also enables them to think through the experimental details compared to a more complicated or less relatable example.
In our experience, these experimental data are useful in a variety of courses, including introductory statistics and data analysis courses. The natural scaffolding to the more complex hypotheses in this research provides a gentle on ramp for students learning the types of questions they can answer with statistics. As a result, we have found that students are able to organize the material more effectively, and they retain the example for longer, often referencing it during office hours using this example to outline their questions.
7 Conclusion
Engaging students in course content and providing meaningful learning experiences for students is a challenge faced by all college instructors, and instructors of math and statistics can face an additional challenge given the prevalence of math anxiety in undergraduate students (Chang and Beilock Citation2016; Delage et al. Citation2022). Our selection of a peer-reviewed publication illustrating a study assessing the effects of therapy dogs on undergraduate student well-being was intentional, as we posited that this content would appeal to students while also informing them of the importance of stress reduction as a factor impacting mental health. In this regard, the data collected, as well as the content itself, provides a rich opportunity for students in a range of statistics courses to explore post-test well-being and ill-being scores between treatment groups, while using a regression model to account for pre-test scores. Instructors can add more advanced concepts to these hypothesis tests as desired, such as adjustments for multiple comparisons and discussions of estimated marginal means.
Because dogs are commonly found on college campuses to help students manage stress, the data here are widely accessible to students from nonstatistical backgrounds and can also be used for examples in discipline-specific research courses (e.g., in psychology). As in Binfet et al. (Citation2022), these data could also be used for examples of reliability analysis in survey questions. College statistics instructors can facilitate student engagement and support learning, especially for students experiencing math anxiety, by incorporating curated study examples into their assigned coursework that research timely topics with applied significance. Other topics that merit exploration by instructors might include nature intervention studies (e.g., Shanahan et al. Citation2019) or the importance of peer socialization (e.g., Turetsky et al. Citation2020).
Supplementary Materials
The supplementary materials include both raw and cleaned versions of the anonymized dog interaction data, a full data dictionary, R scripts for data processing and the analysis described in this manuscript, and the activity on reading a research paper.
supplementary_material.zip
Download Zip (643.6 KB)midterm.pdf
Download PDF (158 KB)data_dictionary.pdf
Download PDF (161.7 KB)class_activity.pdf
Download PDF (167.4 KB)Data Availability Statement
The data discussed in this article are available at https://github.com/ciaran-evans/dog-data-analysis, along with code for all the analyses described in the article.
Disclosure Statement
No potential conflict of interest was reported by the author(s).
Notes
1 We note that the authors answer a slightly different question in the original manuscript. They evaluate whether the treatment groups that interact with dogs would, on average, have significantly higher measures of well-being and lower measures of ill-being compared to the handler-only.
References
- Amanvermez, Y., Rahmadiana, M., Karyotaki, E., de Wit, L., Ebert, D. D., Kessler, R. C., and Cuijpers, P. (2020), “Stress Management Interventions for College Students: A Systematic Review and Meta-Analysis,” Clinical Psychology: Science and Practice. DOI: 10.1111/cpsp.12342.
- American College Health Association and others. (2018), American College Health Association National College Health Assessment: Reference Group Executive Summary Fall 2011, Silver Spring, MD: American College Health Association.
- Barbayannis, G., Bandari, M., Zheng, X., Baquerizo, H., Pecor, K., and Ming, X. (2022), “Academic Stress and Mental Well-Being in College Students: Correlations, Affected Groups, and COVID-19,” Frontiers in Psychology, 13, 886344. DOI: 10.3389/fpsyg.2022.886344.
- Barker, S. B., Barker, R. T., McCain, N. L., and Schubert, C. M. (2016), “A Randomized Cross-Over Exploratory Study of the Effect of Visiting Therapy Dogs on College Student Stress Before Final Exams,” Anthrozoös, 29, 35–46. DOI: 10.1080/08927936.2015.1069988.
- Baumer, B. S., Garcia, R. L., Kim, A. Y., Kinnaird, K. M., and Ott, M. Q. (2022), “Integrating Data Science Ethics into an Undergraduate Major: A Case Study,” Journal of Statistics and Data Science Education, 30, 15–28. DOI: 10.1080/26939169.2022.2038041.
- Benjamin, D. J., Berger, J. O., Johannesson, M., Nosek, B. A., Wagenmakers, E.-J., Berk, R., Bollen, K. A., Brembs, B., Brown, L., Camerer, C., et al. (2018), “Redefine Statistical Significance,” Nature Human Behaviour, 2, 6–10. DOI: 10.1038/s41562-017-0189-z.
- Benjamini, Y., and Hochberg, Y. (1995), “Controlling the False Discovery Rate: A Practical and Powerful Approach to Multiple Testing,” Journal of the Royal Statistical Society, Series B, 57, 289–300. DOI: 10.1111/j.2517-6161.1995.tb02031.x.
- Binfet, J.-T., Green, F. L., and Draper, Z. A. (2022), “The Importance of Client–Canine Contact in Canine-Assisted Interventions: A Randomized Controlled Trial,” Anthrozoös, 35, 1–22. DOI: 10.1080/08927936.2021.1944558.
- Binfet, J.-T., Tardif-Williams, C., Draper, Z. A., Green, F. L., Singal, A., Rousseau, C. X., and Roma, R. (2022), “Virtual Canine Comfort: A Randomized Controlled Trial of the Effects of a Canine-Assisted Intervention Supporting Undergraduate Wellbeing,” Anthrozoös, 35, 809–832. DOI: 10.1080/08927936.2022.2062866.
- Bishop, P. A., and Herron, R. L. (2015), “Use and Misuse of the Likert Item Responses and Other Ordinal Measures,” International Journal of Exercise Science, 8, 297–302.
- Bonferroni, C. (1936), “Teoria statistica delle classi e calcolo delle probabilita,” Pubblicazioni del R Istituto Superiore di Scienze Economiche e Commericiali di Firenze, 8, 3–62.
- Carver, R., Everson, M., Gabrosek, J., Horton, N., Lock, R., Mocko, M., Rossman, A., Roswell, G. H., Velleman, P., Witmer, J., et al. (2016), “Guidelines for Assessment and Instruction in Statistics Education (Gaise) College Report 2016.”
- Chang, H., and Beilock, S. L. (2016), “The Math Anxiety-Math Performance Link and its Relation to Individual and Environmental Factors: A Review of Current Behavioral and Psychophysiological Research,” Current Opinion in Behavioral Sciences, 10, 33–38. DOI: 10.1016/j.cobeha.2016.04.011.
- Delage, V., Trudel, G., Retanal, F., and Maloney, E. A. (2022), “Spatial Anxiety and Spatial Ability: Mediators of Gender Differences in Math Anxiety,” Journal of Experimental Psychology: General, 151, 921–933. DOI: 10.1037/xge0000884.
- Dessie, A., Lewiss, R. E., et al. (2021), “Standardizing Terminology in Academic Medical Journals: Understanding Sex and Gender,” European Journal of Emergency Medicine, 28, 331–332. DOI: 10.1097/MEJ.0000000000000869.
- Diener, E., Wirtz, D., Tov, W., Kim-Prieto, C., Choi, D.-w., Oishi, S., and Biswas-Diener, R. (2010), “New Well-Being Measures: Short Scales to Assess Flourishing and Positive and Negative Feelings,” Social Indicators Research, 97, 143–156. DOI: 10.1007/s11205-009-9493-y.
- Evans, C. (2022), “Regression, Transformations, and Mixed-Effects with Marine Bryozoans,” Journal of Statistics and Data Science Education, (just-accepted), 1–17. DOI: 10.1080/26939169.2022.2074923.
- Fitzner, Z. (2021), “Cuddling with Dogs Can Improve Your Well-Being,” Earth.com.
- Gonzalez-Marquez, M., Foltz, A., Bye, J., and Fulsher, A. (2022), “Science Reading: Cognitive Narrative Helps us Understand Science Better, Upstream.
- Heidari, S., Babor, T. F., De Castro, P., Tort, S., and Curno, M. (2016), “Sex and Gender Equity in Research: Rationale for the SAGER Guidelines and Recommended Use,” Research Integrity and Peer Review, 1, 1–9. DOI: 10.1186/s41073-016-0007-6.
- Kim, A. Y., and Hardin, J. (2021), ““Playing the Whole Game”: A Data Collection and Analysis Exercise with Google Calendar,” Journal of Statistics and Data Science Education, 29, S51–S60. DOI: 10.1080/10691898.2020.1799728.
- King, N., Pickett, W., McNevin, S. H., Bowie, C. R., Rivera, D., Keown-Stoneman, C., Harkness, K., Cunningham, S., Milanovic, M., Saunders, K. E., et al. (2021), “Mental Health Need of Students at Entry to University: Baseline Findings from the U-Flourish Student Well-Being and Academic Success Study,” Early Intervention in Psychiatry, 15, 286–295. DOI: 10.1111/eip.12939.
- Lee, R. M., Draper, M., and Lee, S. (2001), “Social Connectedness, Dysfunctional Interpersonal Behaviors, and Psychological Distress: Testing a Mediator Model,” Journal of Counseling Psychology, 48, 310–318. DOI: 10.1037/0022-0167.48.3.310.
- Lenth, R. V. (2022), emmeans: Estimated Marginal Means, aka Least-Squares Means, R package version 1.8.0.
- Lin, S.-H., and Huang, Y.-C. (2014), “Life Stress and Academic Burnout,” Active Learning in Higher Education, 15, 77–90. DOI: 10.1177/1469787413514651.
- Lyubomirsky, S., and Lepper, H. S. (1999), “A Measure of Subjective Happiness: Preliminary Reliability and Construct Validation,” Social Indicators Research, 46, 137–155.
- Pascoe, M. C., Hetrick, S. E., and Parker, A. G. (2020), “The Impact of Stress on Students in Secondary School and Higher Education,” International Journal of Adolescence and Youth, 25, 104–112. DOI: 10.1080/02673843.2019.1596823.
- Pendry, P., and Vandagriff, J. L. (2019), “Animal Visitation Program (AVP) Reduces Cortisol Levels of University Students: A Randomized Controlled Trial,” Aera Open, 5, 2332858419852592. DOI: 10.1177/2332858419852592.
- R Core Team. (2021), R: A Language and Environment for Statistical Computing, Vienna, Austria: R Foundation for Statistical Computing.
- Raff, J. (2016), “How to Read and Understand a Scientific Paper: A Guide for Non-Scientists,” Impact of Social Sciences Blog.
- Reddy, K. J., Menon, K. R., and Thattil, A. (2018), “Academic Stress and its Sources Among University Students,” Biomedical and Pharmacology Journal, 11, 531–537. DOI: 10.13005/bpj/1404.
- Russell, D. W. (1996), “UCLA Loneliness Scale (Version 3): Reliability, Validity, and Factor Structure,” Journal of Personality Assessment, 66, 20–40. DOI: 10.1207/s15327752jpa6601_2.
- Scheffé, H. (1953), “A Method for Judging All Contrasts in the Analysis of Variance,” Biometrika, 40, 87–110.
- Seldin, P. (1991), “Reducing Stress on Campus,” Planning for Higher Education, 19, 14–20.
- Senn, S. (1994), “Testing for Baseline Balance in Clinical Trials,” Statistics in Medicine, 13, 1715–1726. DOI: 10.1002/sim.4780131703.
- Shanahan, D. F., Astell-Burt, T., Barber, E. A., Brymer, E., Cox, D. T., Dean, J., Depledge, M., Fuller, R. A., Hartig, T., Irvine, K. N., et al. (2019), “Nature–Based Interventions for Improving Health and Wellbeing: The Purpose, the People and the Outcomes,” Sports, 7, 141. DOI: 10.3390/sports7060141.
- Šidák, Z. (1967), “Rectangular Confidence Regions for the Means of Multivariate Normal Distributions,” Journal of the American Statistical Association, 62, 626–633. DOI: 10.1080/01621459.1967.10482935.
- Son, C., Hegde, S., Smith, A., Wang, X., and Sasangohar, F. (2020), “Effects of COVID-19 on College Students’ Mental Health in the United States: Interview Survey Study,” Journal of Medical Internet Research, 22, e21279. DOI: 10.2196/21279.
- Sweeney, L. (2002), “k-anonymity: A model for Protecting Privacy,” International Journal of Uncertainty, Fuzziness and Knowledge-Based Systems, 10, 557–570. DOI: 10.1142/S0218488502001648.
- The Data Science Collaboratory at Colgate University. (2023), “Collaboratory Resources,” [online application]. Accessed: 2023-05-13.
- Thompson, E. R. (2007), “Development and Validation of an Internationally Reliable Short-Form of the Positive and Negative Affect Schedule (PANAS),” Journal of Cross-Cultural Psychology, 38, 227–242. DOI: 10.1177/0022022106297301.
- Turetsky, K. M., Purdie-Greenaway, V., Cook, J. E., Curley, J. P., and Cohen, G. L. (2020), “A Psychological Intervention Strengthens Students’ Peer Social Networks and Promotes Persistence in STEM,” Science Advances, 6, eaba9221. DOI: 10.1126/sciadv.aba9221.
- Usher, W., and Curran, C. (2019), “Predicting Australia’s University Students’ Mental Health Status, Health Promotion International, 34, 312–322. DOI: 10.1093/heapro/dax091.
- Wang, X., Hegde, S., Son, C., Keller, B., Smith, A., Sasangohar, F., et al. (2020), “Investigating Mental Health of US College Students during the COVID-19 Pandemic: Cross-Sectional Survey Study,” Journal of Medical Internet Research, 22, e22817. DOI: 10.2196/22817.
- Wasserstein, R. L., and Lazar, N. A. (2016), “The ASA statement on p-values: Context, Process, and Purpose,” The American Statistician, 70, 129–133. DOI: 10.1080/00031305.2016.1154108.
- Wickham, H. (2021), tidyr: Tidy Messy Data. R package version 1.1.4.
- Wickham, H., Averick, M., Bryan, J., Chang, W., McGowan, L. D., François, R., Grolemund, G., Hayes, A., Henry, L., Hester, J., Kuhn, M., Pedersen, T. L., Miller, E., Bache, S. M., Müller, K., Ooms, J., Robinson, D., Seidel, D. P., Spinu, V., Takahashi, K., Vaughan, D., Wilke, C., Woo, K., and Yutani, H. (2019), “Welcome to the Tidyverse,” Journal of Open Source Software, 4, 1686. DOI: 10.21105/joss.01686.
- Wickham, H., François, R., Henry, L., and Müller, K. (2021), dplyr: A Grammar of Data Manipulation, R package version 1.0.7.
- Wilson, E. (2020), “Where Next for Youth Mental Health? Reflections on Current Research and Considerations for the Future,” Journal of Mental Health, 29, 371–375. DOI: 10.1080/09638237.2020.1766001.
- Witmer, J. (2019), “Editorial,” Journal of Statistics Education, 27, 136–137. DOI: 10.1080/10691898.2019.1702415.