Abstract
Instructors are increasingly using interactive student response systems (SRS) to foster active learning and deepen student understanding in statistics education. Yet most studies focus on either the benefits of SRS or on how students can receive and use feedback, rather than on how instructors can use formative assessment data to inform instructional revisions for the purpose of enacting inclusive pedagogy to reach more learners. This article draws from a case study of an introductory statistics course at a community college to detail a framework for how an instructor can engage in what I call a reciprocal formative assessment and feedback cycle using SRS. This cycle is designed to address the goal of increasing equity—as defined by learning growth for all students—through a structured approach of reflecting on student misconceptions to determine who to reteach, what to reteach, when to reteach, and how to reteach course content.
1 Introduction
Despite the common jump in equity conversations to focus on historically marginalized groups, the question of how to enact equitable statistics instruction must begin with broader considerations of how to define equity in education in the first place (Gutiérrez Citation2007; Tang et al.Citation2017). In the context of teaching and learning statistics for instance, equity could be viewed by an instructor as a goal of guiding every student toward understanding a set of expected course learning outcomes. However, Levinson et al. argue that educational equity can be framed not only as “…equal outcomes for every learner, [but also] equal educational experiences for each child, or equal levels of growth or development for each learner” (2022, p. 2). Being that students arrive in classrooms with significant variation in their prior knowledge and comfort with statistics and/or mathematics, it thus seems that any definition of and discussion about equitable instruction should be centered around the latter conception of fostering growth for each student, with a focus on individualized and unique learning processes rather than universalized and standardized learning outcomes. In fact, the teaching of statistical thinking, as stated in the 2016 GAISE College Report, should similarly rest on guiding students through a process of “discover[ing], construct[ing], and understand[ing] important statistical ideas” (American Statistical Association,Citation2016 p. 18).
That said, facilitating the process of developing students’ understanding of statistical ideas is easier said than done given the prevalence of students not understanding the content and material, particularly upon an instructor’s first attempt at instruction. This challenge is supported by ample evidence showing that learning is indeed a trajectory of continuous rather than discrete experiences, and eliciting and correcting misunderstandings through feedback is an integral part of this process (Bransford, Brown, and Cocking Citation2000). I thus argue that these two pedagogical principles must be cornerstones for instructors who are enacting equitable statistics education: (a) recognizing learning as an iterative process, and (b) modifying instruction based on feedback about student learning.
An inclusive pedagogical framework that views learning as a process and explicitly calls for redesigning instructional goals, materials, and assessments is Universal Design for Learning (UDL) (Rose Citation2000; Mcguire, Scott, and Shaw Citation2006; Meyer, Rose, and Gordon Citation2014; Capp Citation2017; Basham, Blackorby, and Marino Citation2020). Not only applicable for students with disabilities (Basham and Gardner Citation2010), UDL provides a set of guidelines for educators to carry out equitable instruction by providing students with multiple means of: engagement (the “why” of learning), representation (the “what” of learning), and expression (the “how” of learning) (CAST Citation2018). UDL also encourages “assessment by design” through the frequent use of formative assessments (CAST Citation2020), along with the use of student-centered active learning methods to provide students with multiple means of engagement and expression (Brusini, Greene, and Schnupp Citation2019; Sasson, Yehuda, and Miedijensky Citation2022).
To this end, there is also a plethora of research substantiating that active learning strategies is more conducive of student learning than conventional, lecture-based methods of instruction (Freeman et al.Citation2014; Davidson and Katopodis Citation2022). Active learning in statistics, which broadly speaking is the involvement of “students in doing things and thinking about the things they are doing” (Bonwell and Eison Citation1991; American Statistical Association,Citation2016 p. 18), encompasses a wide range of strategies and methods including having students learn by doing, collaborate with peers, complete experiments or simulations, and gather class data (Burckhardt, Nugent, and Genovese Citation2021; Schneiter, Hadfield, and Clements Citation2022; Dogucu, Johnson, and Ott Citation2023). With the advent of technology, one increasingly popular way to implement active learning is through programming formative assessment tasks in student response systems (SRS), which are clickers, smartphones, tablets, or computers used to poll students, provide students with feedback, and generate class discussions (Muir et al.Citation2020; Gustafsson and Ryve Citation2022). SRS, which can be used to correct common misunderstandings through a “Just-in-Time Teaching” (JiTT) approach (Novak et al.Citation1999), has been found to be a particularly effective active learning method for teaching statistics in that it increases student engagement during the learning process (Kay and Lesage Citation2009; Mcgee, Stokes, and Nadolsky Citation2016; Muir et al.Citation2020). For example, an instructor could use SRS to engage students by crowdsourcing common responses during a lesson before demonstrating the solution (Brisbin and Maranhao do Nascimento Citation2019). SRS are also beneficial in helping “the teacher to implement JiTT by fine-tuning the tutorial activities to better meet the students’ needs” (Muir et al.Citation2020, p. 29). That said, they come with challenges for the instructor, such as the difficulty of designing productive tasks of different types to program into the SRS (Gustafsson and Ryve Citation2022). If SRS are used regularly in every class meeting, I argue that such systems can also present the obstacle of amassing too much student data for an instructor to easily analyze and meaningfully act on.
This article attempts to address this challenge by building on Muir et al. (Citation2020) study through detailing how an instructor can systematically “fine-tune” their teaching to promote active learning in direct response to each individual students’ needs. Specifically, I detail a structured framework, which I call a reciprocal formative assessment and feedback cycle, for how instructors can systematically reflect on and use formative assessment data from the SRS to equitably modify their instruction in line with general UDL principles. Typically, equity goals are focused on improving the outcomes of underrepresented, underserved, or marginalized student groups in particular. However, this case study as detailed in Section 3.1 is comprised entirely of community college students of color who, by the university admission policies at the time, were categorized by the college as lacking mathematical proficiency status.1 It is therefore important to note that I define and use equity throughout this article in terms of promoting total participation and learning growth for all students, not just a select group.
2 Literature Review
2.1 Formative Feedback
Literature on what Shute (Citation2008) calls formative feedback—defined as “information communicated to the learner that is intended to modify his or her thinking or behavior to improve learning” (p. 154)—has largely focused on identifying what types and characteristics constitute effective feedback to students. Feedback can come in the form of verifying the accuracy of a student’s response, a hint, or a worked example (ibid). The timing of feedback also matters; feedback can be given immediately, or after a delay. In general, research supports that formative feedback should be nonevaluative, timely, supportive of the student, and specific (Heritage Citation2011). Task-specific feedback on a student’s cognitive process tends to be more impactful than general summary feedback or traditional academic feedback in the form of grades or marks on summative assessments (Black and Wiliam Citation1998; Hattie and Timperley Citation2007; Cauley and Mcmillan Citation2010; Zimmerman et al.Citation2011). Particularly in mathematics and statistics education, providing students with structured and focused formative feedback has been found to contribute to better student learning outcomes, satisfaction, attitudes, and self-efficacy (Yopp and Rehberger Citation2009; George and Leon Citation2023). Scholars have also examined how students’ reflection on the feedback they receive improves metacognitive self-regulation skills (Hudesman et al.Citation2013; Landers and Reinholz Citation2015). Furthermore, the potential positive effects of feedback in mathematics learning are particularly salient when paired with self-regulated learning and growth mindset development activities (Hudesman et al.Citation2014; Montalbano Citation2021).
Most of these studies, however, focus on how students can use feedback to shape and reshape their behavior, thinking, and learning process. Especially considering Black and Wiliam’s seminal definition of formative assessment as “evidence about student achievement [that] is elicited, interpreted, and used by teachers, learners, or their peers, to make decisions about the next steps in instruction” (1998, p. 9), there is relatively less knowledge on how instructors can use the feedback process to make those decisions about next steps in instruction. This paucity of research is particularly surprising since instructional adjustments based on formative assessments have been found to be associated with learning gains (Black and Wiliam Citation1998; Burkhardt and Schoenfeld Citation2019). This is one gap in the larger scholarship on formative assessment and feedback that this article attempts to fill.
2.2 Student Response Systems (SRS)
As consensus grows on the effectiveness of formative assessment in teaching mathematics and statistics, research has also turned toward examining new ways of delivering feedback to students through technology (Suurtam Citation2012). Beyond only clickers, educators are increasingly using interactive SRS to provide students with instant feedback, to generate discussion, and to gauge student comprehension (Mcloone and Brennan Citation2015; Gay and Burbridge Citation2016; Muir et al.Citation2020). More advanced platforms allow for students to collaborate with one another, as well as submit revised work—thereby allowing students to receive iterative feedback (Danielson and Meyer Citation2016). Such response systems have been found not only to have a positive effect on student grades and academic learning outcomes (Caldwell Citation2007; Kay and Lesage Citation2009; Chien, Chang, and Chang Citation2016; Hunsu, Adesope, and Bayly Citation2016), but also to create more inclusive classrooms by increasing student participation, student engagement, and class discussions (Caldwell Citation2007; Kay and Lesage Citation2009; Chien, Chang, and Chang Citation2016; Egelandsdal, Ludvigsen, and Ness Citation2019).
Research studies have now turned away from the effects of the technological tools themselves toward more nuanced questions such as what factors mediate these effects. For example, knowledge domain, class size, pedagogy, students’ learning strategies, and prior knowledge have all been found to be significant mediators of SRS effectiveness (Hunsu, Adesope, and Bayly Citation2016; Shapiro et al.Citation2017). Scholars have also studied the underlying attributes of the technology, such as the role that student anonymity in SRS plays in increasing student participation and cognitive engagement (Barr Citation2017). Important to the field of mathematics education is also the quality of the tasks that are embedded into SRS (Caldwell Citation2007; Cline and Huckaby Citation2020; Cline, Zullo, and Huckaby Citation2020; Gustafsson and Ryve Citation2022).
In summary, these studies highlight that formative feedback via SRS can be a key lever in improving teaching and student learning. However, most studies focus on class environment factors and how students can use this feedback, rather than how instructors can use student response feedback obtained from SRS to inform their teaching and reteaching—particularly in attaining the goal of total participation and understanding from all students. Many studies do indeed call for teachers to adjust their instruction, but they simply allude to it without detailing how an instructor should approach that task (Cauley and Mcmillan Citation2010; Hudesman et al.Citation2013; Danielson and Meyer Citation2016; Gay and Burbridge Citation2016). Literature on how feedback reciprocally flows between an instructor and their students—particularly concerning the stage of using formative assessment data to guide instructional revisions—is scarce. The rest of this article attempts to begin filling this gap by providing a proposed approach to how an instructor can use formative assessments delivered through an online SRS to: assess student learning, modify instruction, and iteratively reach more learners.
3 Proposed Approach and Design of Intervention
3.1 SRS Adoption
In addition to clickers which have been in use in classrooms since the early 2000s, many online SRS now exist, some of which can readily be accessed via smartphones. This study used a web-based, mobile and computer friendly, free e-learning tool2 which previous researchers have used with success in various classroom settings (Gay and Burbridge Citation2016; Muir et al.Citation2020; Gustafsson and Ryve Citation2022). After creating an account, instructors can use the app to create their own formative assessment activities such as “exit tickets,” “quizzes,” or a quick multiple choice, true/false, or short answer question. Instructors can also choose to program correct solutions and explanations for each question. Students do not need to download an app, and they can join an activity on an internet browser using a device of their choice such as a computer, a smartphone, or tablet. Students can access the SRS by visiting the platform’s URL or scanning a QR code, logging into the instructor’s class with a code/room number, and typing in their name which can become anonymized on the dashboard projected to the class. There is also an option for an instructor to upload a class roster in which case students can enter their Student ID to join the room.
Once the instructor launches an activity, students complete the activity on their browser, with feedback after each question on whether their submitted answer was correct or incorrect, along with an explanation of the solution if the instructor has programmed that into the assessment. As students complete the activity, instructors can opt to project the results on a screen, with options to show or hide student names, their answers, and whether they correctly answered each question. Finally, instructors can generate reports on student performance that can be viewed either on the website or downloaded as an Excel spreadsheet. Reports show the full answers that students submitted, as well as an aggregate analysis of the number of questions that students answered correctly and the percentage that that represents.
3.2 A Reciprocal Formative Assessment and feedback cycle Using SRS
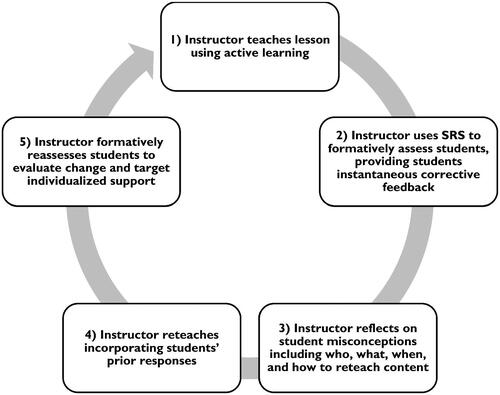
To systematically use the SRS to collect formative assessment data, and to then reflect on that student data to guide instructional revisions, I implemented a reciprocal formative assessment and feedback cycle (see ) comprised of five stages: (a) first teaching a lesson that incorporates active learning strategies like Think-Pair-Shares and group discussions; (b) using the SRS to provide students with immediate, corrective feedback while collecting formative assessment data on students’ understanding of the content; (c) reflecting on student responses with a focus on who, what, when, and how to reteach the content; (d) using students’ prior responses to reteach the content; and (d) formatively reassessing students to evaluate change and provide further individualized support. I detail each of these stages in the next section.
Fig. 1 Reciprocal formative assessment and feedback cycle using SRS.
4 Case Study of a Reciprocal Formative Assessment and Feedback Cycle USING SRS
4.1 Context and Study Details
This case study draws from a year-long, credit-bearing introductory statistics course at a small urban community college located in the Northeastern United States with an enrollment of near 1000 students. Like most community colleges in the United States, enrollment at this college is open to all high school graduates or its equivalent, and the course was comprised of 25 students who entered community college immediately after graduating high school. Sixty percent (15/25) of the students identified as female; in addition, 48% (12/25) identified as Hispanic/Latinx, 44% (11/25) as Black/African American, and 8% (2/25) as South Asian. Rather than recognizing the funds of knowledge, assets, and mathematical abilities they bring, all students in the course were also deemed at the time to be developmental (i.e., not proficient in college-level mathematics). As such, they represented a group of students who have historically and institutionally been marginalized through a deficit lens of using state exams and/or SAT mathematics scores to declare them mathematically “unproficient.” It may not come as a surprise then that eighteen out of the twenty students who completed an introductory survey in the course also optionally self-reported having had negative experiences and some degree of anxiety in mathematics. This is in line with Maciejewski, Bergthold, and Bragelman’s (2022) findings of developmental mathematics students having less favorable attitudes and higher anxiety levels toward mathematics. Only five out of the twenty students agreed or strongly agreed to “liking math as a subject.”
This case study draws from the first semester of a two-semester sequenced introductory statistics course at a small urban community college located in the Northeastern United States with an enrollment of near 1,000 students. Item-level data from formative assessments (i.e., exit tickets and warm up quizzes programmed into the SRS) were collected during each class period. The study design included analyzing student growth within the four major units of the course, however, this case study focuses on the second unit of the course. The focus on the second unit of the course was due to still establishing class norms and routines in the first unit, and a focus in the third and fourth unit on project-based learning where students worked in class on case studies like applying the Empirical Rule to explore racial stereotypes around SAT-test taking.
Correctness rates were calculated for each daily assessment, including calculating combinations of percentage correct out of the total number of items in the assessment (e.g., one out of three questions correct, two out of three questions correct, vs. three out of three questions correct). While students were not required or prompted to provide feedback on this approach in their course evaluations at the end of the semester, all evaluations were reviewed for further qualitative comments about students’ experience of the pedagogical practice and SRS platform. Finally, as part of the data gathering process, I adapted the idea of analytical memos (Glaser and Strauss Citation1967; Maxwell Citation1996) to draft brief reflective memos after each lesson to capture my own reflections of student assessment data, details about when implementing the reciprocal formative assessment and feedback cycle went well or was challenging, and other personal observations or commentaries about the cycle. These informal memos were used as another source of data during the data analysis stage. The study was in compliance with the Institutional Review Board (IRB #2019-0641).
4.2 Implementing the Reciprocal Formative Assessment and Feedback Cycle
In this section, I detail—with examples from the case study course—a reciprocal formative assessment and feedback cycle (see ) that allows instructors to gain insight into each individual student’s understanding and make changes in their instruction based on students’ misunderstandings.
4.2.1 Instructor Teaches Lesson Using Active Learning Strategies
The cycle begins with a statistics lesson grounded in active learning methods. In the case study course, not every lesson followed the same structure. Each class, however, always began with a no-stakes warmup “quiz” comprised of question(s) designed to assess students’ comprehension and retention of the previous lesson’s content, and/or to activate students’ prior knowledge connected to the foundational skills needed for that day’s lesson if it was a new unit or topic. After reviewing the warmup task and solutions, students engaged in a brief, teacher-led lesson during which they were introduced to new concepts, terminology, and examples. Lessons were typically interspersed with short “Think-Pair-Shares” where students discussed simple questions or tasks with a partner to ensure every student—particularly those who typically do not raise their hands in a whole class discussion—engaged in active learning before reviewing the question or task as a class. Depending on the learning goals of the lesson, students then shifted to either: (a) work on a series of pen-and-paper tasks in pairs or small groups, or (b) engage in activities like using software to analyze a dataset, playing a dice game to learn about empirical versus theoretical probability, tossing a globe to estimate a confidence interval, or investigating the color of M&Ms to understand sampling distributions. Typically, students would reconvene toward the end to discuss key ideas or problems that posed to be a challenge to many students, with students leading the discussion of their solutions when possible.
4.2.2 Instructor Uses SRS to Formatively Assess Students
Based on my earlier definition of equity as growth in learning for every student, it is critical to administer a formative assessment comprised of one or multiple problems in every class meeting to gauge student understanding and growth. Each class thus also ended with students completing an “exit ticket” in the last 5 min of the period using the SRS. An exit ticket typically consisted of no more than 4 or 5 multiple choice and/or open-ended short answer tasks aligned to the learning objectives of the day. All students used their own device to log into the app to individually complete the exit ticket. After submitting each response, students received immediate feedback on whether they got the correct answer, along with a sample worked solution that I programmed into the SRS.
4.2.3 Instructor Uses Structured Approach to Reflect on Student Misconceptions
Frequently, an instructor might find themselves in the situation of finding it difficult to, for various reasons, reflect on the formative assessment data collected in SRS. However, a quick reflection using a simple protocol or structured approach like the following can unearth small instructional changes that can help make the content in the following lesson accessible to more learners:
What to reteach: If all or nearly all students in a class correctly answer the task(s) in an exit ticket, there is clearly no need to reteach a concept or lesson. However, many incorrect responses signal a clear need to spend some time in the next class reteaching the concept(s).
Whom to target in the reteach: In many college STEM classes, instructors do not find out who understood the material until a summative assessment such as a unit exam or midterm, with a recourse being to curve the exam if many scores come back low. In contrast, analysis of student correctness rates on formative assessments may help an instructor identify a need to reteach the content either to the entire class or part of the class. For instance, in cases where only a few students do not understand the material, an instructor could suggest that the student(s) attends office hours outside of the class, or an instructor could work with those students in small groups during a workshop period during the class.
When/How long to reteach: Depending on the prevalence of student mistakes and misconceptions, an instructor could decide if students’ feedback warrants a brief review and reinforcement of the topic, or a greater adjustment to the course calendar (e.g., spending an additional day or half a day on the topic).
How to reteach: Finally, individual student responses can be a tremendous resource in revealing common misconceptions that can be used to design tasks for reteaching the material. Specifically, formative assessment data from an SRS can be helpful in developing incorrect solutions or distractor choices to incorporate into tasks designed to generate student discussions about mistakes (Lim Citation2011; Gustafsson and Ryve Citation2022). For example, using Gustafsson and Ryve’s (Citation2022) typology of task design, a common misconception could easily be turned into a multiple-choice selection on a “who is right” task or an “evaluating statements” task.
4.2.4 Instructor Reteaches Incorporating students’ Prior Responses
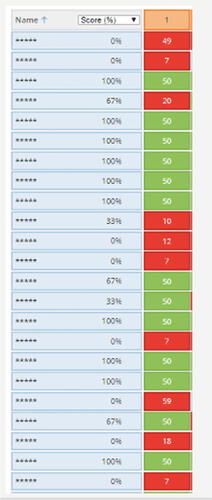
Once a review or reteach of the content is deemed necessary, the instructor can launch the next class with a warmup quiz that incorporates students’ prior responses. Once students complete the warmup task, projecting the anonymized dashboard of aggregate class results (see ) can further act as a class motivator, including for students who demonstrate understanding of the material. For instance, sharing that about half of students had incomplete understanding of a task can serve as a justification of why it is necessary for those who correctly answered the warmup to still engage in reviewing the material. Those who incorrectly completed a task may often feel a greater sense of community in these instances too, knowing that many of their peers also struggled with the material.
Fig. 2 Sample dashboard of anonymized student responses and correctness from SRS.
After the warmup quiz, students can be called on to lead a reteach or review of the content. Since an SRS allows the instructor to quickly identify which students comprehend the material, an instructor could strategically call on those students to present their solution and facilitate a discussion on why other common responses might not be correct (without naming or shaming any students). After the reteach, which typically did not necessitate a whole class period and would instead take about 20 min, the instructor can segue into presenting new material to the class.
4.2.5 Instructor Formatively Reassesses Students to Evaluate Change
At the end of the period, a different but similar task can be presented to students via another exit ticket to obtain formative assessment data on learning growth; the exit ticket can also include problems on new content that students learned during the period beyond the reteach. Given the vast amount of content that an instructor typically must cover in any undergraduate statistics course in the span of one semester (or even year), it is usually not possible to consider reteaching the same topic again after a cycle. However, student data from the SRS reassessment can still be used to design tasks for homework or summative assessments like exams. More importantly, formative reassessment data can be used again to further identify which students to target for individualized support through referrals to supplemental instruction or tutoring services.
5 Results
5.1 Illustrative Results from One Cycle of Teaching and Reteaching
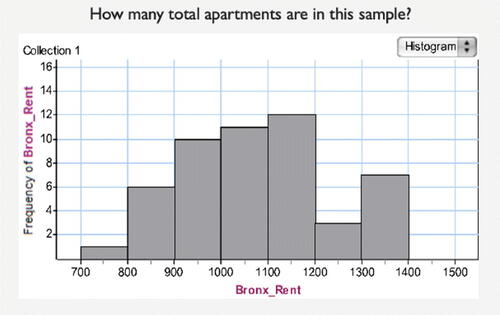
Formative assessment data from the first day of a new unit on “Picturing variation with graphs” (see ) showed only 10 out of the 20 (50%) students present correctly answering an exit ticket question asking them to interpret a histogram to determine “How many total apartments are in this sample” (Q1, see ). Twenty percent of students correctly answered the second question about “How many apartments have rents of $1000 or less?” (Q2), and no students correctly answered the question of “What percent of all the apartments in the sample have rents of $1000 or less?” (Q3). Altogether, only two students correctly answered two out of the three questions on the exit ticket, and nobody correctly answered all three. The low correctness rate on the exit ticket tasks clearly signaled a need to reteach the entire topic to the whole class. The prevalence of mistakes also justified pushing back the pacing calendar to spend an extra half of a lesson, rather than just 10 or 15 min, on reteaching the topic. Student responses on the exit ticket revealed that a common misconception on Q1 was for students to simply count the number of bars in the histogram. For Q2, many students also included an additional histogram bar to the right of the value in their calculation of the sum.
Fig. 3 Unit of study.
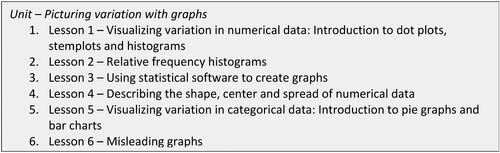
Fig. 4 Sample task of interpreting a histogram.
To start the reteach in the following lesson that was also supposed to cover new content on relative frequency histograms, one student’s prior incorrect response from Q1 was anonymized as an open-ended short answer question asking students to evaluate why that answer was incorrect. As student submitted their warmup responses, I quickly scanned student responses from my teacher’s dashboard to strategically call on two students to share answers that lent themselves to a scaffolded class discussion. The first student shared an answer that centered on what the correct total number of observations should be, whereas the second student came to the board (upon my request) to show what they thought was the source of the misconception (i.e., counting the number of bars in the histogram rather than totaling the frequencies of each bar). The student then went on to show how they added the frequencies represented by each bar, after which I demonstrated a strategy of explicitly writing the frequency on top of each bar before finding the sum. I then built on this example to introduce a relative frequency histogram, including how it compares and contrasts with a frequency histogram. The class then worked in pairs to complete a different task about interpreting and drawing conclusions from frequency and relative frequency histograms showing the comparative gas mileage of domestic versus foreign-made cars, before sharing their findings and engaging in a class discussion about the impact of fuel efficiency standards on climate change. At the end of the class, students received another exit ticket that included a task assessing student growth based on questions similar to the exit ticket from the day before but with different values, and this time with an additional question asking them to interpret the tallest bar. 65% of students correctly answered Q1 after the reteach, 74% correctly answered Q2, and 65% correctly answered Q3 (see ). Altogether, 78% of students got two out of three questions correct after the reteach, and 30% of students got all three correct. In other words, there was an increase of 68-percentage points in the number of students who correctly answered two out of the first three questions, and a 30-percentage point increase in the number of students who correctly answered all three questions.
Table 1 Percent of students who correctly answered each task (with counts in parentheses).
5.2 Additional Qualitative Comments from Students and Staff
Students open-ended comments in end-of-semester course evaluations provided further evidence that the reciprocal formative assessment and feedback cycle helped them to better learn the material. Out of the 12 students who provided open-ended comments to the question of “what parts of the course… made the most positive impact on you,” three students referenced the approach and the SRS “quizzes.” For instance, one student put it simply in saying “the little quizzes that we have helps.” Another student went further to say: “Taking the quizzes actually made a positive impact on me because it helped me prepare for my exams.”
Anecdotal feedback captured in reflective memos also supported implementation of the cycle. For instance, “it’s helpful to know right away if I got it right or wrong,” one student informally shared in class. Another student found it particularly valuable to have explanations programmed into the SRS that showed them an example of how to arrive at the solution, which confirmed for me as the instructor that this was a necessary investment of time on my part. Apart from students, staff from the academic success and tutoring center offered informal feedback appreciating both the direct student referrals, as well as information on the specific misconceptions that students were having on tasks that helped them to better tailor their academic support to the course. Finally, the feedback also had the additional benefit of providing me with specific data to message individual students after class with a “kudos” or a “concern” about their comprehension of the material using the college’s online student success platform.
6 Discussion
It is not uncommon for instructors to finish a lesson with little knowledge of how well students grasped the material. The use of an SRS, on the other hand, allows an instructor to better know if and what their students are learning, and to be able to assess their learning instantaneously, continuously, and non-evaluatively. This article aimed to detail a framework of how an instructor can use an SRS to implement active learning and equitably help all students succeed in a college-level statistics courses. To this end, this case study demonstrates how a cycle of using student feedback data to revise instruction allows an instructor to apply UDL principles of designing lessons that address specific student needs and build on individual student understanding, rather than homogeneously teaching to a standard lesson plan, course syllabus, grading policy, or “the middle of the class.” Furthermore, a reciprocal formative assessment and feedback cycle makes teaching a dynamic, fluid, two-way endeavor where an instructor co-constructs content knowledge in collaboration with students through gathering, analyzing, and using student work in their teaching. In these ways, the practice can create a more equitable and inclusive mathematics or statistics classroom.
That said, adopting a student response system comes with challenges, including the time and effort required to: learn and use the technology, modify the course and instruction on a continuous basis, create quality tasks, program immediate feedback, and provide targeted and at times individualized feedback to students (Kay and Lesage Citation2009; Nielsen, Hansen, and Stav Citation2013). Launching class sessions with a warmup quiz in a SRS may also be difficult or inappropriate for complex tasks or questions with open-ended responses, such as hypothesis testing problems with multiple parts to the solution or questions asking students to write their own interpretations of data and graphs.
It is important to note that using SRS in and of itself does not increase student learning; changes in student learning hinges on what the teacher does with the formative assessment data from SRS. Returning to the UDL principles on which this study draws, assessment by design consists of identifying ways to involve students in reflecting on their learning process, as well as instructors reflecting on assessments to better support the variability in student backgrounds and needs (CAST Citation2020). To this end, committing to a structured approach of reflecting on formative assessment data from SRS allows an instructor to modify their instruction toward addressing their students’ specific needs and misconceptions. Although not a part of this study, an instructor could reflect on the UDL guidelines, specifically in how to use SRS and formative assessment to foster broader equity in learning growth through further increasing students’ means of engagement, representation, and expression (CAST Citation2018). However, a structured approach – as illustrated in this case study – could be as simple as a teacher thinking through if there is a need to reteach, and if so who to reteach, what to reteach, when to reteach, and how to reteach. Whatever the approach, a structured reflection could be particularly valuable to educators who are increasingly barraged with data but have no systematic or methodical way to use that data to meaningfully inform or revise their instruction during the course of a semester.
6.1 Limitations and Future Research
A major limitation of the study and results is that it is based on a single case study of one cohort of students. Results are therefore not generalizable, nor are they meant to evaluate the effectiveness of implementing a reciprocal formative assessment and feedback cycle. The growth in student learning demonstrated in this observational case study does not establish a causal link between this approach of reteaching content and improved scores or course grades. Additional research, such as through comparisons with a control group, would need to be conducted to claim causality. Qualitative student data from course evaluations also focused on the SRS itself, without supporting evidence specifically on the role that instructional revisions and reteaching played in their learning. Furthermore, this proposed approach of reteaching presumes a high degree of flexibility in the course schedule that may not be possible in all contexts and institutions. The ability to closely collaborate with the academic success center in using formative assessment data to provide targeted individualized support to students was also possible because of the small size of the college, which may not be the case at large colleges and universities.
This case study is therefore not intended to make any claims about effects associated with this approach. A potential future research direction, however, could be to conduct a mixed methods study to further investigate the effectiveness of using SRS to enact a reciprocal formative assessment and feedback system in teaching statistics. Specifically, collecting item-level data from summative unit assessments aligned to formative assessment tasks can allow for the construction of a panel dataset with student scores measured on repeated occasions over time within a curricular unit. Descriptive analysis and multilevel modeling can further reveal trends in student growth within the course of a unit. Statistical analyses can then be triangulated with surveys and qualitative interviews or focus groups with students about their experience of the SRS and the role that it, along with an instructor’s modified instruction, plays in their learning process. Alternatively, design-based research has increased in popularity as a means of using mixed methods to test multiple iterations of an intervention (Anderson and Shattuck Citation2012)—ideally to address a scientifically and practically significant “problem” (McKenney and Reeves Citation2013). Accordingly, the intervention could be investigated through a design-based research project that empirically investigates and further develops the use of SRS to implement a reciprocal formative assessment and feedback cycle aimed at addressing the challenge many educators face of fostering learning growth for all students.
Acknowledgments
I am grateful to the editor, associate editor, and anonymous reviewers for their thoughtful feedback and suggestions which helped to strengthen this article. I also thank Pasang Sherpa for her assistance on this project.
Disclosure Statement
There is no potential conflict of interest.
Data Availability Statement
Data available at https://doi.org/10.5281/zenodo.7957370
Additional information
Funding
References
- American Statistical Association. (2016), “Guidelines for Assessment and Instruction in Statistics Education College Report,” available at https://www.amstat.org/docs/default-source/amstat-documents/gaisecollege/_full.pdf
- Anderson, T., and Shattuck, J. (2012), “Design-Based Research: A Decade of Progress in Education Research?” Educational Researcher, 41, 16–25. DOI: 10.3102/0013189X114288.
- Barr, M. L. (2017), “Encouraging college student active engagement in learning: Student response methods and anonymity,” Journal of Computer Assisted Learning, 33, 621–632. DOI: 10.1111/jcal.12205.
- Basham, J. D., Blackorby, J., and Marino, M. T. (2020), “Opportunity in Crisis: The Role of Universal Design for Learning in Educational Redesign,” Learning Disabilities: A Contemporary Journal, 18, 71–91.
- Basham, J. D., and Gardner, J. E. (2010), “Measuring Universal Design for Learning,” Special Education Technology Practice, 12, 15–19.
- Black, P., and Wiliam, D. (1998), “Assessment and Classroom Learning,” Assessment in Education: Principles, Policy and Practice, 5, 7–74. DOI: 10.1080/0969595980050102.
- Bonwell, C. C., and Eison, J. A. (1991), Active Learning: Creating Excitement in the Classroom. 1991 ASHE-ERIC Higher Education Reports, Washington DC: ERIC Clearinghouse on Higher Education, George Washington University. Available at https://Files.Eric.Ed.Gov/Fulltext/ED336049.Pdf
- Bransford, J. D., Brown, A. L., and Cocking, R. R., eds. (2000), How People Learn: Brain, Mind, Experience, and School, Washington, DC: National Research Council, The National Academies Press.
- Brisbin, A., and Maranhao do Nascimento, E. (2019), “Reading versus Doing: Methods of Teaching Problem-Solving in Introductory Statistics,” Journal of Statistics Education, 27, 154–170. DOI: 10.1080/10691898.2019.1637801.
- Brusini, A., Greene, C., and Schnupp, D. (2019), Best Practice: Universal Design for Learning. Center for Teaching Excellence and Innovation, Johns Hopkins University. Available at https://ctei.jhu.edu/files/ii-bp-20/textunderscoreuniversal-design-for-learning.pdf
- Burckhardt, P., Nugent, R., and Genovese, C. R. (2021), “Teaching Statistical Concepts and Modern Data Analysis with a Computing-Integrated Learning Environment,” Journal of Statistics and Data Science Education, 29, S61–S73. DOI: 10.1080/10691898.2020.1854637.
- Burkhardt, H., and Schoenfeld, A. H. (2019), “Formative Assessment in Mathematics,” in Handbook of Formative Assessment in the Disciplines, eds. R. Bennett, H. Andrade, and G. Cizek, pp. 35–67, London: Routledge.
- Caldwell, J. E. (2007), “Clickers in the Large Classroom: Current Research and Best-Practice Tips,” CBE Life Sciences Education, 6, 9–20. DOI: 10.1187/Cbe.06-12-0205.
- Capp, M. J. (2017), “The Effectiveness of Universal Design for Learning: A Meta-Analysis of Literature between 2013 and 2016,” International Journal of Inclusive Education, 21, 791–807. DOI: 10.1080/13603116.2017.1325074.
- CAST. (2018), Universal design for learning guidelines version 2.2 [graphic organizer]. Wakefield, MA: Author. Available at http://udlguidelines.cast.org.
- CAST. (2020), UDL Tips for Assessment, Wakefield, MA: Author. Available at https://www.cast.org/products-services/resources/2020/udl-tips-assessments.
- Cauley, K. M., and Mcmillan, J. H. (2010), “Formative Assessment Techniques to Support Student Motivation and Achievement,” The Clearing House: A Journal of Educational Strategies, Issues and Ideas, 83, 1–6. DOI: 10.1080/00098650903267784.
- Chien, Y. T., Chang, Y. H., and Chang, C. Y. (2016), “Do We Click in the Right Way? A Meta-Analytic Review of Clicker-Integrated Instruction,” Educational Research Review, 17, 1–18. DOI: 10.1016/j.edurev.2015.10.003.
- Cline, K., and Huckaby, D. A. (2020), “Checkpoint Clicker Questions for Introductory Statistics,” PRIMUS, 31, 775–791. DOI: 10.1080/10511970.2020.1733148.
- Cline, K., Zullo, H., and Huckaby, D. A. (2020), “Addressing Common Errors and Misconceptions in Integral Calculus with Clickers and Classroom Voting,” Teaching Mathematics and Its Applications: An International Journal of the IMA, 39, 71–85. DOI: 10.1093/teamat/hrz002.
- Danielson, C., and Meyer, D. (2016), “Increased Participation and Conversation Using Networked Devices,” The Mathematics Teacher, 110, 258–264. DOI: 10.5951/mathteacher.110.4.0258.
- Davidson, C. N., and Katopodis, C. (2022), The New College Classroom, Cambridge, MA: Harvard University Press.
- Dogucu, M., Johnson, A. A., and Ott, M. (2023), “Framework for Accessible and Inclusive Teaching Materials for Statistics and Data Science Courses,” Journal of Statistics and Data Science Education, 31, 144–150. DOI: 10.1080/26939169.2023.2165988.
- Egelandsdal, K., Ludvigsen, K., and Ness, I. J. (2019), “Clicker Interventions in Large Lectures in Higher Education,” in Learning, Design, and Technology, eds. M. Spector, B. Lockee, and M. Childress, pp. 1–22, Cham: Springer. DOI: 10.1007/978-3-319-17727-4_147-1.
- Freeman, S., Eddy, S. L., Mcdonough, M., Smith, M. K., Okoroafor, N., Jordt, H., and Wenderoth, M. (2014), “Active Learning Increases Student Performance in Science, Engineering, and Mathematics,” Proceedings of the National Academy of Sciences of the United States of America, 111, 8410–8415. DOI: 10.1073/Pnas.1319030111.
- Gay, A. S., and Burbridge, L. (2016), “Bring Your Own Device for Formative Assessment,” The Mathematics Teacher, 110, 310–313. DOI: 10.5951/mathteacher.110.4.0310.
- George, B. J., and Leon, J. (2023), “Making the Switch: Experiences and Results from Converting a Biostatistics Course to Flipped and Online Formats for Public Health Students,” Journal of Statistics and Data Science Education, 31, 91–101. DOI: 10.1080/26939169.2022.2046522.
- Glaser, B. G., and Strauss, A. L. (1967), The Discovery of Grounded Theory: Strategies for Qualitative Research. New York, NY Aldine De Gruyter.
- Gustafsson, P., and Ryve, A. (2022), “Developing Design Principles and Task Types for Classroom Response System Tasks in Mathematics,” International Journal of Mathematical Education in Science and Technology, 53, 3044–3065. DOI: 10.1080/0020739X.2021.1931514.
- Gutiérrez, R. (2007), October), “Context Matters: Equity, Success, and the Future of Mathematics Education,” in Proceedings of the 29th Annual Meeting of the North American Chapter of the International Group for the Psychology of Mathematics Education (Vol. 18), pp. 1–18.
- Hattie, J., and Timperley, H. (2007), “The Power of Feedback,” Review of Educational Research, 77, 81–112. DOI: 10.3102/00346543029848.
- Heritage, M. (2011), “Formative Assessment: An Enabler of Learning,” Better: Evidence-Based Education, 6, 18–19. Available at https://csaa.wested.org/wp-content/uploads/2020/01/fa/_enabler/_of/_learning/_highlights.pdf
- Hudesman, J., Crosby, S., Flugman, B., Issac, S., Everson, H., and Clay, D. B. (2013), “Using Formative Assessment and Metacognition to Improve Student Achievement,” Journal of Developmental Education, 37, 2. Available at https://files.eric.ed.gov/fulltext/ej1067283.pdf
- Hudesman, J., Crosby, S., Ziehmke, N., Everson, H., Isaac, S., Flugman, B., Zimmerman, B., and Moylan, A. (2014), “Using Formative Assessment and Self-Regulated Learning to Help Developmental Mathematics Students Achieve: A Multi-Campus Program,” Journal on Excellence in College Teaching, 25, 107–130.
- Hunsu, N. J., Adesope, O., and Bayly, D. J. (2016), “A Meta-Analysis of the Effects of Audience Response Systems (Clicker-Based Technologies) on Cognition and Affect,” Computers & Education, 94, 102–119. DOI: 10.1016/j.compedu.2015.11.013.
- Kay, R. H., and Lesage, A. (2009), “Examining the Benefits and Challenges of Using Audience Response Systems: A Review of the Literature,” Computers & Education, 53, 819–827. DOI: 10.1016/j.compedu.2009.05.001.
- Landers, M., and Reinholz, D. (2015), “Students’ Reflections on Mathematics Homework Feedback,” Journal of Developmental Education, 38, 22–36.
- Levinson, M., Geron, T., and Brighouse, H. (2022), “Conceptions of Educational Equity,” AERA Open, 8, 233285842211213. DOI: 10.1177/23328584221121344.
- Lim, K. H. (2011), “Addressing the Multiplication Makes Bigger and Division Makes Smaller Misconceptions via Prediction and Clickers,” International Journal of Mathematical Education in Science and Technology, 42, 1081–1106. DOI: 10.1080/0020739X.2011.573873.
- Maciejewski, W., Bergthold, T., and Bragelman, J. (2022), “Postsecondary General Education Mathematics: Theory and Practice,” International Journal of Mathematical Education in Science and Technology, 1–24. DOI: 10.1080/0020739X.2022.2110533.
- Maxwell, J. A. (1996), Qualitative Research Design: An Interactive Approach, Thousand Oaks, CA: Sage Publications.
- Mcgee, M., Stokes, L., and Nadolsky, P. (2016), “Just-in-Time Teaching in Statistics Classrooms,” Journal of Statistics Education, 24, 16–26. DOI: 10.1080/10691898.2016.1158023.
- Mcguire, J. M., Scott, S. S., and Shaw, S. F. (2006), “Universal Design and Its Applications in Educational Environments,” Remedial and Special Education, 27, 166–175. DOI: 10.1177/07419325060270030501.
- McKenney, S., and Reeves, T. C. (2013), “Systematic Review of Design-Based Research Progress: Is a Little Knowledge a Dangerous Thing?” Educational Researcher, 42, 97–100. DOI: 10.3102/0013189X12463781.
- Mcloone, S., and Brennan, C. (2015), “On the Use and Evaluation of a Smart Device Student Response System in an Undergraduate Mathematics Classroom,” AISHE-J The All Ireland Journal of Teaching and Learning in Higher Education, 7, 2431–24319.
- Meyer, A., Rose, D. H., and Gordon, D. T. (2014), Universal Design for Learning: Theory and Practice, Lynnfield, MA: CAST Professional Publishing.
- Montalbano, A. C. (2021), “Examining the Effects of Self-Regulated Learning and Growth Mindset Instruction for Underprepared Students in Corequisite College Algebra,” Doctoral Dissertation, Arizona State University.
- Muir, S., Tirlea, L., Elphinstone, B., and Huynh, M. (2020), “Promoting Classroom Engagement through the Use of an Online Student Response System: A Mixed Methods Analysis,” Journal of Statistics Education, 28, 25–31. DOI: 10.1080/10691898.2020.1730733.
- Nielsen, K. L., Hansen, G., and Stav, J. B. (2013), “Teaching with Student Response Systems (SRS): Teacher-Centric Aspects That Can Negatively Affect Students’ Experience of Using SRS,” Research in Learning Technology, 21, 1–13. DOI: 10.3402/rlt.v21i0.18989.
- Novak, G., Patterson, E., Gavrin, A., and Christian, W. (1999), Just-in-Time-Teaching: Blending Active Learning with Web Technology, New York: Prentice Hall.
- Rose, D. (2000), “Universal Design for Learning,” Journal of Special Education Technology, 15, 47–51. DOI: 10.1177/016264340001500407.
- Sasson, I., Yehuda, I., and Miedijensky, S. (2022), “Innovative Learning Spaces: Class Management and Universal Design for Learning,” Learning Environments Research, 25, 725–739. DOI: 10.1007/s10984-021-09393-8.
- Schneiter, K., Hadfield, K. F., and Clements, J. L. (2022), “Leveraging the ‘Large’ in Large Lecture Statistics Classes,” Journal of Statistics and Data Science Education, 31, 173–178. DOI: 10.1080/26939169.2022.2099488.
- Shapiro, A. M., Sims-Knight, J., O’Rielly, G. V., Capaldo, P., Pedlow, T., Gordon, L., and Monteiro, K. (2017), “Clickers Can Promote Fact Retention but Impede Conceptual Understanding: The Effect of the Interaction between Clicker Use and Pedagogy on Learning,” Computers & Education, 111, 44–59. DOI: 10.1016/j.compedu.2017.03.017.
- Shute, V. J. (2008), “Focus on Formative Feedback,” Review of Educational Research, 78, 153–189. DOI: 10.3102/0034654307313795.
- Suurtam, C. (2012), “Assessment Can Support Reasoning and Sense Making,” The Mathematics Teacher, 106, 28–33. DOI: 10.5951/mathteacher.106.1.0028.
- Tang, G., El Turkey, H., Cilli-Turner, E., Savic, M., Karakok, G., and Plaxco, D. (2017), “Inquiry as an Entry Point to Equity in the Classroom,” International Journal of Mathematical Education in Science and Technology, 48, S4–S15. DOI: 10.1080/0020739X.2017.1352045.
- Yopp, D., and Rehberger, R. (2009), “A Curriculum Focus Intervention’s Effects on Prealgebra Achievement,” Journal of Developmental Education, 33, 28–30.
- Zimmerman, B. J., Moylan, A., Hudesman, J., White, N., and Flugman, B. (2011), “Enhancing Self-Reflection and Mathematics Achievement of at-Risk Urban Technical College Students,” Psychological Test and Assessment Modeling, 53, 108–127.