Abstract
With the rise of the popularity of Bayesian methods and accessible computer software, teaching and learning about Bayesian methods are expanding. However, most educational opportunities are geared toward statistics and data science students and are less available in the broader STEM fields. In addition, there are fewer opportunities at the K-12 level. With the indirect aim of introducing Bayesian methods at the K-12 level, we have developed a Bayesian data analysis activity and implemented it with 35 mathematics and science pre-service teachers. In this manuscript, we describe the activity, the web app supporting the activity, and pre-service teachers’ perceptions of the activity. Lastly, we discuss future directions for preparing K-12 teachers in teaching and learning about Bayesian methods.
Disclaimer
As a service to authors and researchers we are providing this version of an accepted manuscript (AM). Copyediting, typesetting, and review of the resulting proofs will be undertaken on this manuscript before final publication of the Version of Record (VoR). During production and pre-press, errors may be discovered which could affect the content, and all legal disclaimers that apply to the journal relate to these versions also.1 Introduction
Students encounter uncertainty in many parts of the school. Why are there more birds visiting the courtyard outside of their school today? Why was the traffic worse today than yesterday? How come an investigation during a Chemistry laboratory did not work out as well for students in one laboratory group as another? How confident about historical knowledge should one be after reviewing the histories of people living 100s or 1000s of years in the past? Answers to these questions are necessarily uncertain. One needs to reason about uncertainty due to the changing circumstances, new knowledge, or variation in the situation. For instance, many things could cause greater visits from birds. Students (and adults) may generate a range of plausible ideas and no answer or any single answer will offer the last word on this question. Thus, answers to these questions are uncertain.
While uncertainty is present in students’ everyday experiences, how we teach about uncertainty in school often falls short of offering learners useful strategies or mathematical or statistical approaches that can bolster how they generate answers to real-world scientific questions. The challenge in understanding uncertainty is not unique to students. Many scientists (and statisticians) also struggle with uncertainty in answering scientific questions. If trained in statistics, scientists and students are more commonly trained in frequentist statistics and often solely rely on single measures, such as p-values in hypothesis testing, to summarize what one learns from data. Utilization of Bayesian methods in scientific practice (Wasserstein and Lazar, 2016) to potentially overcome the mis- and over-use of p-values as well as the inclusion of Bayesian methods in statistics classes at the university level (Berry, 1997; Witmer, 2017; Johnson et al., 2020; Hu, 2020; Hoegh, 2020; Dogucu and Hu, 2022; Hu and Dogucu, 2022) have been widely recommended. Needless to say, the practice of scientists and their training are intertwined. Thus teaching students early on about dealing with uncertainty and introducing them to Bayesian ideas should be a curricular priority in any scientific training.
There have been many historical changes that make Bayesian methods more popular than they used to be in the past. The early 1990s might be considered as the birth of modern Markov chain Monte Carlo (MCMC) methods often attributed to Gelfand and Smith (1990). Perhaps the most prominent change that impacts the teaching and learning of Bayesian methods is the advances in computing. There are various tools requiring various skill levels available for teaching and learning Bayesian methods. Tools include but are not limited to point-and-click software JASP (Love et al., 2019), full probabilistic programming languages STAN (Carpenter et al., 2017) and JAGS (Plummer et al., 2003), and R packages such as rstanarm (Goodrich, 2022) and tidybayes (Kay, 2022). Most of these tools are relatively new. For instance, JAGS was released in 2007, STAN in 2012, and rstanarm in 2016.
Despite the availability of newer tools that make Bayesian statistics more accessible in the classroom, Bayesian courses are often geared toward students majoring in statistical, data, and mathematical sciences, and only a few are geared toward students in other STEM fields (e.g., biology, astronomy) (Dogucu and Hu, 2022). At the K-12 school level, there are also debates about introducing Bayesian ideas from different perspectives, such as interpreting and evaluating probabilities and making informal statistical inferences (Chernoff, 2014; Nilsson et al., 2014; Martignon and Erickson, 2014; Kazak, 2015). We believe that making Bayesian methods more prominent in the broader STEM education community is vital and starting the teaching and learning of Bayesian thinking at earlier grade levels is also important.
With this in mind, we developed and taught a classroom activity to support Bayesian thinking. Our goal was to design and implement the activity for pre-service mathematics and science teachers to learn about and be able to use Bayesian data analysis. An indirect goal in this was advancing learners at the grades K-12 (pre-collegiate) levels to think about and understand uncertainty through an accessible but rigorous Bayesian approach. Given the infrequent training in Bayesian methods at the college level, we prioritized training pre-service (or, not yet teaching, in contrast to in-service teachers) mathematics and science teachers in Bayesian methods and preparing them to incorporate Bayesian ideas in their future K-12 courses.
We first describe the relevant research in mathematics and statistics education and in science education on which our work expands, then go on to describe and discuss our teaching activity and experience.
1.1 Relevant work in mathematics and statistics education
The notion of uncertainty has a unifying role in dealing with data and chance, the two closely related topics that are part of the mainstream school mathematics curriculum but often treated separately. With the increasing attention to developing students’ informal statistical inference (Makar and Rubin, 2018) starting from early grades (Ben-Zvi, 2006; Watson, 2008; Makar, 2014), reasoning about uncertainty has become of interest in the context of making informal statistical inference at the school level (Braham and Ben-Zvi, 2015; Kazak, 2015; Henriques and Oliveira, 2016). Informal statistical inference involves making claims beyond data, using data as evidence to support these claims, and using probabilistic language to make generalizations (Makar and Rubin, 2009). Hence, an articulation of uncertainty is at the heart of informal statistical inference.
In the traditional method of teaching statistical inference, a common underlying reasoning process, known as the Fisherian approach, entails “assessing the strength of evidence against a claim” (Rossman, 2008, p.7) based on the frequency interpretation of probability. An alternative form of reasoning, which is arguably more intuitive in making statistical inferences from data involves the Bayesian perspective that is based on a subjectivist notion of probability (Albert, 2002). This kind of reasoning process starts with a prior probability associated with a hypothesis or claim based on a personal judgment or experience and involves updating that probability in light of new data (Rossman, 2008). However, subjective probability, which is one of the main approaches to measuring probability, is not addressed in the school mathematics curricula even though there are opportunities for students to use subjective probability descriptors (impossible, less likely, more likely, and certain) for the outcomes of chance events in elementary school (Jones et al., 2007). Use of subjective probability can be useful in scientific practice. For instance, in making predictions about retirement age, studies show that subjective probability prediction of retirement age contains a lot of information that can go unmeasured otherwise (Kézdi and Shapiro, 2023).
Some recent research in mathematics education has focused on supporting young students’ reasoning about uncertainty using the subjectivist notion of probability and the Bayesian approach. In a study with 7-8-year-old children, Kazak and Leavy (2018; 2022) engaged them in predicting how likely a specific outcome of chance events (e.g., drawing a green jellybean from a bag) by marking it on a non-numeric happy face scale (on one end a sad face for an impossible event, in the middle a neutral face for an equiprobable event, and on the other end a happy face for a certain event). They focused on children’s personal (subjective) probability estimates and how their prior probability estimates changed when new data were available to the children through carrying out physical experiments with 24 trials and then computer simulations with 500 or 1000 trials. The results suggested how intuitive this reasoning process could be in modifying prior probability estimates based on new evidence for even young children.
Moreover, Kazak (2015) examined 10-11-year old students’ reasoning about uncertainty in relation to their personal degree of confidence in their statement (proposition) regarding the fairness of a chance game, i.e., whether there is an equal chance of winning and losing. The game required randomly drawing one token from each of the two bags including four (red/blue) tokens and if the two tokens were the same color, the students would win the game (otherwise, they would lose). There were multiple games to be played with different bag contents, such as game 1 involved one bag with 3 red tokens and 1 blue token and the other with 1 red token and 3 blue tokens, game 2 involved one bag with 2 red tokens and 2 blue tokens and the other with 2 red tokens and 2 blue tokens, and so on.
First, students were asked to assess whether the game was fair or not and then to state the level of confidence in their statement (proposition) regarding the game’s fairness. Students working in small groups initially evaluated the fairness of the given four games based on their intuitions or personal beliefs with an explanation and marked their confidence level on a scale from 0 (not at all confident) to 10 (totally confident). Then they played the game physically as much as they wanted (ranging from 5 to 30 times) and were asked to mark their confidence level about the fairness of the game again on a new scale based on the game results. In the next part, the groups used computer simulations to collect more data (ranging from 100 to 100000) and used information from the simulation results to update their level of confidence. In other words, the task addressed the probability of a proposition rather than the probability of an event and the belief notion of probability, i.e., “the degree to which we can be confident of something uncertain, given what we know or can find out” (Hacking, 2001, p. 127).
Kazak’s study showed that the task supported both expression of students’ probability beliefs about a proposition using the confidence scale and updating their confidence in their personal beliefs with the new information available through experiments and simulations. While students’ first ‘intuition-based’ propositions about the fairness of the games tended to lead them to wrong judgments initially, both their propositions and levels of confidence on them seemed to improve as more data were collected. Hence, the study suggests that scaffolding students’ reasoning about the fairness of the game with this task design can help promote Bayesian reasoning in earlier grades of schooling.
Even though with age, students’ perceptions of probability change (Piaget and Inhelder, 1951; Kreitler and Kreitler, 1986; Barash et al., 2019), many challenges with learning statistical inference remain even at the undergraduate level and beyond. Statistical inference is often taught from the frequentist perspective and the latest recommendations include teaching inference through simulation, such as bootstrap sampling and randomization tests (Rossman and Chance, 2014). However, despite the many benefits, simulation-based activities do not always help to resolve misconceptions related to inference. For instance, in a class teaching inference with simulation, pre-service teachers had difficulties formulating hypotheses, interpreting p-values, and drawing conclusions (Biehler et al., 2015).
Although not specific to pre-service teachers, Bayesian courses and activities have also been recommended and taught at the undergraduate level as an alternative approach to statistical inference. Even though Bayesian courses are not that common at the undergraduate level (Dogucu and Hu, 2022), there are many examples of such courses (Witmer, 2017; Johnson et al., 2020; Hu, 2020; Hoegh, 2020; Hu and Dogucu, 2022). Statisticians also tried to introduce Bayesian ideas in the first course in statistics (Albert and Rossman, 2009). Efforts have also been made to introduce Bayesian ideas through various activities, including with the aid of M&M’s candies (Eadie et al., 2019) and a web-simulator (Barcena et al., 2019) to search for a submarine.
1.2 Relevant work in science education
While there has been more prior research in mathematics and statistics education that advances a Bayesian way of approaching uncertainty, there is some relevant research in science education. Two foundational papers considered the science and engineering practice—an activity common to the professional work of scientists and engineers (National Research Council, 2013)—of arguing from evidence in K-12 classrooms from a Bayesian perspective (Szu and Osborne, 2012; Nussbaum, 2011), where argumentation refers to “a process for reaching agreements about explanations and design solutions.” (National Research Council, 2013, Appendix F, p. 13). Nussbaum (2011) provided examples from implementing Bayesian approaches to argumentation in actual K-12 classroom contexts. While focused on argumentation, the subject matter of students’ engagement in arguing from evidence centered on the question of raising taxes to provide resources to individuals in need. Szu and Osborne (2012) showed how the prior and likelihood could be obtained from empirical evidence—also in the context of students engaging in scientific argumentation.
Szu and Osborne (2012) make an important distinction with respect to how and why Bayesian approaches to scientific reasoning can be useful to grades K-12 science teachers and learners. Namely, “the key leap that characterizes the debate about the value of Bayesian inference as a model of scientific reasoning” (p. 61) lies in acknowledging the degrees of belief that students hold about phenomena and scientific ideas and theories. This subjective view of probability makes Bayes’ Theorem more than a mathematical expression; instead, Bayes’ Theorem can be used to understand and bolster student reasoning. They explain that this key facet of Bayesian approaches can support an informal but principled form of scientific reasoning. This focus on informal but principled scientific reasoning is in line with similar calls in the domain of statistics education for students to have opportunities to participate in informal statistical inference (Makar and Rubin, 2018).
In addition to these two papers, some recent research in undergraduate physics education contexts has advanced a more qualitative approach to Bayesian methods (Warren, 2018, 2020). Warren designed and implemented what he termed Bayesian updating activities into introductory, university-level physics courses. In these activities, students expressed their initial confidence in the hypotheses they would test. Then, they were prompted to consider how experimental data they collected aligned with (or differed from) their initial hypotheses, after which they updated their beliefs using Bayes’ Theorem. Importantly, this work took a more qualitative approach to Bayesian reasoning: Students’ initial beliefs were not expressed in terms of numbers or distributions but as hypotheses. However, this approach may still be challenging for most students at the pre-collegiate level, as applying Bayes’ Theorem still requires a degree of mathematical acumen that may be out of reach for students outside of advanced high school-level mathematics or statistics courses.
Rosenberg, Kubsch, Wagenmakers and Dogucu (2022) extended some of this past research in science education. They explicated some epistemic (or, relating to knowledge) principles that science teachers could use with their students in a heuristic manner. These were a) be open to new evidence, b) account for what is already known, and c) consider alternative explanations. In addition, they built an interactive, web-based version of the qualitative approach advanced by Warren (2018, 2020). But this application does not allow the exact calculations to be made and instead uses more heuristic calculations; only works for hypotheses, rather than considering parameters. In short, it is more useful as an informal means of introducing Bayesian reasoning. We discuss next how we move past these limitations with the application and lesson plan we developed.
In the next section, we describe the instructional context, activity design, and materials—including the Shiny Web Application used by pre-service teachers. We then present findings from the implementation and then discuss the findings; contributions to teacher education, grades K-12 education, and college statistics teaching; limitations; and recommendations for implementation and adaptations.
2 Activity Design, Materials, and Intervention
2.1 The Instructional Context
For the three years before the implementation, one of the authors taught a course for pre-service (not yet teaching) and job-embedded (teaching while earning their teaching license) science teachers at a University in the Southeastern United States. This course focused, broadly, on project-based learning in science (Krajcik and Czerniak, 2018). This approach emphasizes learning science through planning and carrying out complex projects motivated by an important scientific question or problem.
A parallel course was taught for pre-service mathematics teachers by another instructor. In the past, the instructor of the course for pre-service mathematics teachers and the author who taught the course for pre-service science teachers combined several of their course sessions. The rationale for doing this was manifold: to support learning about the complementary subject matter (for mathematics teachers, science, and for science teachers, mathematics) and to engage the pre-service teachers in these courses in activities that integrate mathematics and science - namely, data modeling (Lehrer and English, 2018; Kazak et al., 2021), as work with empirical data represents a relatively rare area of overlap between the science and mathematics curricular standards (the Next Generation Science Standards (National Research Council, 2013) and the Common Core State Standards (National Governors Association, 2010), both of which were adopted for the standards used in the state). Findings from these earlier efforts are documented in Lawson et al. (2021). Because of these earlier attempts to work with both mathematics and science pre-service teachers around data, this was a suitable context for exploring the Bayesian approach that we advance and describe in this paper. Both instructors, thus, were experienced with teaching these courses, and both were interested in supporting their students in these courses—current and future teachers—to be able to engage their (grades K-12 or pre-collegiate) students to work with data in more ambitious, meaningful ways.
2.2 The Activity Design
In addition to a Shiny web application described in Section 2.4, we developed an activity that applies the Bayesian approach to analyzing and interpreting data. The aim of introducing Bayesian methods to pre-service mathematics and science teachers was two-fold. First, mathematics teachers needed to be convinced that personal (subjective) probability was useful because, with enough scientific evidence, different scientists would arrive at the same or similar conclusions, so subjective probabilities would not matter as much. The Shiny app helps seeing if the data collected have a large sample size then the posteriors would be similar or same. Second, science teachers needed to be convinced that Bayesian thinking was useful for answering scientific questions by seeing how it could help them to analyze data in practical ways.
To engage pre-service teachers in investigating data from a Bayesian perspective, we wanted to pose a motivating problem for the pre-service teachers. We decided to focus on a topic related to the sustainability initiatives at the university, which was energy conservation on campus. To motivate and frame the activity as an authentic one, we also wanted to pose a problem for which there was not an already-known answer. The problem involved pre-service teachers estimating a parameter, π, that is, the proportion of unoccupied rooms on campus with lights on. The activity consists of six parts:
Part I - Prior Ideas: After the introduction of the problem, pre-service teachers were first asked to make an initial estimate about the proportion of lights left on along with expressing how confident they were in their estimate on a scale from 0% to represent being not at all confident to 100% to represent total confidence. This estimate and the uncertainty around the estimate provided an opportunity for pre-service teachers to share their prior information about π. Although pre-service teachers did not necessarily have the prerequisite knowledge, the instructor guided them to think of the point estimate as the expected value of the prior distribution, and the confidence as a measure of their subjective strength of belief. In this way, a higher confidence value reflects a lower variance of the prior distribution and pre-service teachers were guided into thinking this way without using any technical terms such as expected value or variance. By asking them also to write the assumptions they considered when estimating the proportion, we encouraged them to present their prior observation or knowledge that gives them the basis for their initial estimate. Each pre-service teacher then used the app to reflect their own prior idea about the proportion by selecting a Beta distribution determined by the shape and rate parameters (alpha and beta). The distribution that corresponded best to the pre-service teacher’s initial idea about π provided a prior model before collecting any data.
Part II - Data: Pre-service teachers worked in groups (4-6 pre-service teachers) to record data on the status of lights in unoccupied rooms from different, large buildings on campus (one per group) using a Google Sheet. Thirty minutes were allocated to this data collection. The data included the assigned room name or number and whether one or more lights were on in the room (yes = 1, no = 0). After the data collection by groups, each pre-service teacher used their group’s data to complete the rest of the tasks individually.
Part III - Change in Ideas: In this part, pre-service teachers were asked to consider only the first five observations. By using the Shiny app, pre-service teachers now visualized the prior, the likelihood, and the posterior distributions given their data (n = 5) and wrote down what they noticed and wondered about their prior, likelihood, and posterior distributions. They could also compare the influence of the different data and different prior on the posterior. We needed them to understand their posterior as representing an estimate that compromised between their prior ideas and data using Bayes’ Theorem. Considering the posterior, they then marked again how confident they were in their estimate on the scale (0% to 100%) provided. After a class discussion about taking into account the prior data, or both, a brief lecture on frequentist and Bayesian approaches was provided (we elaborate on how we could expand on what information could be introduced to pre-service teachers in the limitations section). Then, they were asked which of these approaches is more closely aligned with scientific inquiry and to explain why.
Part IV - More Data: Pre-service teachers then used the Shiny app to analyze all of the data (n = 48-57) collected by their group. In this part of the investigation, pre-service teachers needed to understand that the posterior from the previous part (III) was used as the prior. Then they were asked to interpret the data and compare the updated posterior with the previous one. They marked again how confident they were in their updated estimate on the scale (0% to 100%) based on the new information.
Part V - Pooling Class Data: To see the effect of a large sample size, all the data collected by the groups were combined into a whole-class data (n = 205) spreadsheet. By considering the prior, likelihood of the data, and the posterior based on the whole-class data, pre-service teachers were asked to write about what they noticed about their estimates now and evaluated their confidence again by marking the scale given. At the end of the investigation, pre-service teachers drew a conclusion about the proportion of rooms with lights left on across the campus and reflected on how this investigation can be extended.
Part VI: Reflection and Planning: Pre-service teachers reflected on what they took away from the activity, what they could use with their future students, and what they would still like to know. Pre-service teachers carried out this reflection in small groups, after which they responded to prompts with short, written reflections.
2.3 Materials
The materials used consisted of the following (please see the Appendices for links to all of the materials):
The Shiny interactive web application. The application enabled pre-service teachers to estimate a posterior using a Beta-Binomial model that we described earlier.
A brief Google Form for pre-service teachers to self-assess their degree of Bayesian and frequentist thinking. This consisted of four questions that teachers could answer and then interpret the meaning of in terms of how much their thinking aligned with a Bayesian or Frequentist approach to data analysis (from the Bayes Rules! book (Dogucu et al., 2021)).
A Google Docs document that served as a digital worksheet. This document consisted of six parts that aligned with how we structured the activity for pre-service teachers: 1) prior ideas, 2) data, 3) change in ideas, 4) more data, 5) pooling class data, and 6) reflection.
Google Sheets spreadsheet for pre-service teachers to record observations as data. This spreadsheet included separate tabs for teachers to record their data in groups—and a tab to pool the entire class’s data. Summaries of these data were used in the app.
A Google Slides presentation. This was used to introduce new ideas to pre-service teachers and to help organize the task.
2.4 The Shiny Web Application
We developed a web application to assist the learning of some foundational Bayesian ideas. We wanted the users to be able to 1) specify a prior model; 2) understand that the posterior model is constructed by considering the prior model and the likelihood function (based on the data) simultaneously; and, 3) understand how more data (i.e., evidence) causes the influence of the prior on the posterior to be weaker—and the influence of the likelihood to be stronger. These ideas are model-agnostic and hold true for any Bayesian model. In the web app (and the activity) we have utilized the Beta-Binomial model for its simplicity. The term simple refers to the fact that there is a single parameter in the model and not necessarily the ease of learning. In addition, the Beta-Binomial model is one of the most popular models taught in Bayesian courses (Dogucu and Hu, 2022). Thus we thought it would be an appropriate model to teach pre-service teachers mathematics and science as their first Bayesian model.
The app is developed with the R package shiny (Chang et al., 2021) and provides interactivity to the Beta-Binomial model visualizations in the R package in bayesrules (Dogucu et al., 2021) as used in Chapters 3 and 4 of the Bayes Rules! book (Johnson et al., 2022). The static visualization functions in this package support learning the three foundational ideas of Bayesian modeling mentioned in the previous paragraph (Dogucu and Johnson, 2022). However, in our teaching, we chose to use interactive visualizations with the Shiny framework to avoid R installation issues. Further, since it does not require users to code, it can be used with learners who are not familiar with R. We developed the app independent of a context (e.g., coin flip) so that other educators can also utilize it should there be a need and interest.
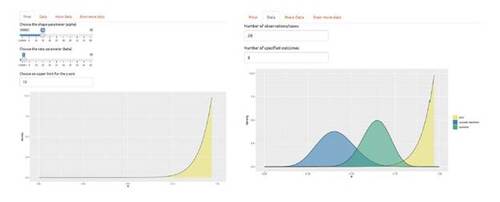
Using the app, the user starts by choosing the shape parameters of the Beta prior. They can change these values interactively until they find the distribution that matches their beliefs. In the next step, the user provides the data information. Once provided, then the app visualizes the prior, likelihood, and posterior. With the science educators who may not necessarily be familiar with the binomial distribution, we have avoided using terminologies such as trial and success; instead, we have used “number of observations or cases” and “number of specified outcomes,” respectively. We show the first two tabs of the app in Figure 1.
The app also supports scenarios where the user can provide more data and update the posterior and even more data in a final round. These additional tabs for data and more data aim to have users visually see that the posterior is closer to the likelihood with more evidence.
2.5 Participants
As described earlier in Section 2.1, the sample for this work involved pre-service (earning their teaching license) science and mathematics teachers. We note that a few students were technically job-embedded (concurrently teaching and earning their teaching license) teachers. Though University-level students in the courses we taught, we refer to them in this manuscript as pre-service teachers as this was their primary identity in the courses. We combined the two classes for a single, approximately three-hour session during the Fall 2021 semester. Notably, the COVID-19 pandemic was a severe challenge during this semester, and, accordingly, both the courses were offered in a hybrid modality: pre-service teachers could join online if they were concerned about (or exposed to) COVID-19, and many did based on their preferences that changed on a week-by-week basis. More specifically, there were 21 science and 14 mathematics pre-service teachers enrolled in the courses. The pre-service teachers had limited prior exposure to and experience with statistics, data analysis, and data science. None of the middle or high school pre-service science teachers’ programs of study required any statistics or data science courses. High school pre-service mathematics teachers’ program of study required a course on probability and statistics (with Calculus 3 as a pre-requisite, meaning that few of the participants in this study had taken this course at this point in their program).
Of the 35 pre-service teachers, practically all participated in the activity. However, 9 science and 7 mathematics pre-service teachers consented for us to use their work products as data sources for this study, for a total of 16 participating pre-service teachers. Three of those pre-service teachers did not share their complete work with us, and so our analytic sample consisted of 13 pre-service teachers—7 science and 6 mathematics.
2.6 Accommodations
As noted earlier, the courses were offered in a hybrid modality; for the session in which we carried out the Bayesian data analysis activity, several pre-service teachers joined in a fully online modality, and we took several steps to accommodate these pre-service teachers with the aim of ensuring that they had opportunities to fully engage in all the activities. Specifically, we constructed groups of pre-service teachers that combined not only pre-service teachers in the mathematics and science courses (so that they had opportunities to network and collaborate with pre-service teachers teaching a different subject area) but also pre-service teachers joining face-to-face and online. Because pre-service teachers in the online modality typically joined for around two (instead of the full three) hours of the earlier sessions, we shared all materials ahead of time and recorded a video for online pre-service teachers to view in advance of the session. We instructed pre-service teachers in the face-to-face classroom to advocate for the online teachers in their group and to be responsible for their online groupmates to be able to participate; accordingly, teachers in the face-to-face noted to the instructors when their online groupmates had challenges hearing audio or when they had questions to raise to the whole class. While pre-service teachers worked in groups and talked through all aspects of the task, they completed and submitted the task independently.
3 Findings from the Implementation
To provide content and formative feedback on the implementation, we collected and analyzed teacher comments in the form of their responses in the Google Docs document. The pre-service teachers’ individual written responses to three questions (“What is one thing you have taken away from this activity?”, “What is one thing you still want to know or learn about this investigation?”, and “For what topics could you use an approach like this (with or without the app) with your students?”) were analyzed qualitatively. First, the codes from the data were generated to label the main ideas related to the pre-service teachers’ reflections on the activity and discussed by the authors until reaching an agreement. Then, we grouped codes with common topics together into the themes that we report here.
The key points taken away by the pre-service mathematics and science teachers after completing this activity were mainly related to the content, lesson format, and technology. When the pre-service teachers commented on their experiences with the content aspect of the activity (i.e., Bayesian data analysis), they tended to consider the concepts and approaches used to analyze and interpret data. Some examples of such comments are “I now have a better intuition regarding the differences between prior, likelihood, and posterior probabilities” and “That there are many different methods to interpret and draw conclusions from data.”
The pre-service teachers’ comments about the lesson format (i.e., “interactive lessons” and “group activity”) showed their predominant orientation towards teaching. For instance, as seen in the comment “This is a great group activity for teachers, for our future teachers, to be introduced to the value and limitations of data,” the pre-service teacher appeared to reflect on his experience and relate it to his teaching in the future. Moreover, some pre-service teachers mentioned learning how to use the Shiny app as a new tool to analyze the data.
The activity also seemed to foster pre-service teachers’ interest in Bayesian ideas (and, more generally, statistics and probability), which purportedly were not part of their teacher training, per their responses. For instance, a pre-service mathematics teacher stated, “I want to learn more about Bayes’ Theorem and how it can be applied in other situations in the real world. I also want to learn about other ways of representing data. I have never been in a Statistics class, but this was very interesting.” Some pre-service teachers (especially those preparing to teach science) were interested in learning more about the app and visualizing data for their own teaching (e.g., “How I can make more data visual for my students”).
When the pre-service teachers were asked to reflect on other topics that they could use a similar approach with their students, they mostly gave general data collection examples in different contexts, such as measurement, functional relationships, bird surveys, and even quantum physics. Hence, the perception that the Bayesian approach can be used in any data analysis seemed to be common among the pre-service teachers. This range was reflected in specific examples of ways that the Bayesian approach could be used that the pre-service teachers noted. Particularly, while a pre-service mathematics teacher provided a binomial example (i.e., a survey about what people like or do not like) similar to the activity, a pre-service science teacher related the approach used in the activity to his subject area, such as testing hypotheses (“You could use the app to analyze data that students collecting in an experiment and compare their hypothesis (prediction) to the results.”).
4 Discussion
Our aim was to design and implement a Bayesian data analysis activity for pre-service mathematics and science teachers. We reasoned that this would show that it is possible for pre-service teachers with no background in Bayesian statistical methods to do such an activity. In this section, we discuss the activity and our observations from teaching it to pre-service teachers. We do this threefold. First, we discuss Bayesian thinking and its place in teacher education and how this activity contributes to the preparation of science and mathematics teachers. Second, we revisit our indirect aim of bringing Bayesian thinking to the K-12 level. Last but not least, the participants we worked with were college students in addition to being pre-service teachers. Thus we discuss the activity and its contributions from a college-level statistics education perspective.
4.1 Contributions to Teacher Education
One contribution this work makes is demonstrating the viability and value of bringing together pre-service mathematics and science educators. Traditionally, pre-service teacher preparation has held teachers in these two content areas largely separate—though there is one prominent program that integrates the coursework of future mathematics and science teachers (Backes et al., 2018). Still, mostly, mathematics teachers learn to teach mathematics with other mathematics teachers, and science teachers with other science teachers. Helping students to analyze data is a hallmark of both the mathematics and science standards (National Governors Association, 2010; National Research Council, 2013) and it is therefore not only viable in terms of curricular standards to design and implement course experiences for mathematics and science educators, but also possibly valuable because of the complementary differences in mathematical and science approaches to data analysis. Namely, mathematical modeling has historically been criticized as ignoring the context in which data analysis occurred (Rubin, 2020). At the same time, how science teachers introduce data to their students may lack statistical rigor (Rosenberg, Schultheis, Kjelvik, Reedy and Sultana, 2022). This became apparent in the participants’ reflections at the end of the activity when two mathematics pre-service teachers commented that they observed mathematics and science pre-service teachers had different approaches to statistical concepts and data analysis. A Bayesian data analysis activity and lesson like the one we implemented was designed to balance these two historical deficiencies in the professional preparation of teachers—combining a meaningful context with mathematical rigor. We observed teachers helping one another with the aspects of the activity and lesson with which they had less experience: Mathematics teachers commented to science teachers about how the distributions they observed in the map connect to calculus-related ideas, and science teachers commented to mathematics teachers about specific environmental science and physics-related ideas. Such opportunities can, therefore, make the other content areas more accessible to both groups of teachers while still meeting the curricular standards because of the central role of data in each.
In this activity, we tried to make transparent or concrete how one’s initial hypothesis based on a personal judgment can be updated with the availability of new data in a real-life context relevant to college students. The pre-service teachers started by stating their initial prediction and their confidence level in their estimate. Then, they analyzed the prior-likelihood-posterior distributions in the app and updated their confidence level with the first five data collected by their group (n = 5), with all group data (n = 48-57), and finally with the class data (n = 205). This approach relied on the intuitiveness of the deductive reasoning used in the Bayesian approach, as emphasized by others (Albert, 2002; Rossman, 2008), and made this activity potentially useful for pre-service teachers even without prior undergraduate coursework in probability, statistics, and calculus. Moreover, some pre-service teachers’ comments showed an interest in learning statistics, probability—and more specifically—Bayesian ideas after completing this activity in a three-hour session. Hence, such activities can be incorporated into a teacher education course that is relevant to the Bayesian data analysis content, such as the course focusing on project-based learning in science used in this study.
Another contribution this study makes to teacher education is a demonstration of a technology specifically designed for teaching and learning. In teacher education, there is a longstanding interest in how teachers use content-specific (e.g., mathematics or science education) and context-specific (e.g., usable given the technologies at hand in K-12 schools) technologies (Mishra and Koehler, 2006). The app we designed had these considerations in mind. It is not a tool designed (or necessarily useful) for Bayesian data analysis in general; other widely-used tools—such as Stan (Gelman et al., 2015)—exist for that. At the same time, the tool was designed to enable learners to carry out analyses that are statistically and technically valid. Moreover, the app is available to any student and teacher via a computer (or a Chromebook) with a web browser. For these reasons, this study contributes an example of statistical software for teaching and learning that is intended to partially address the call of McNamara (2019) to design tools that bridge the gap between those strictly for learning and those for professionals. The tool we developed is available for any teacher to use. We can envision extensions of this tool that permit analyses using different distributions for the dependent variable (i.e., the Normal-Normal and Gamma-Poisson conjugate prior models) that further bridge between what teachers and learners could do in K-12 classrooms using the app we developed and what tools such as Stan permit more sophisticated users to do.
4.2 Contributions to K-12 Education
There have been emerging opportunities for introducing Bayesian ideas at the school level in probability and informal statistical inference contexts (Chernoff, 2014; Nilsson et al., 2014; Martignon and Erickson, 2014; Kazak, 2015). This study complements those works as we indirectly intended to foster students’ understanding of uncertainty through the Bayesian approach in K-12 levels by implementing our Bayesian data analysis activity with pre-service mathematics and science teachers. After completing the activity and lesson, the pre-service teachers’ comments indicate their intention to use several aspects of the activity, such as lesson format (group activity), content (the value and limitation of data), and the app, to foster student learning in their own classrooms.
A research-related contribution this work makes to K-12 science education is an example of how Bayesian data analysis applies in this context. There is prior research on how Bayes’ Theorem can be used in science classrooms, but this work has explored a Bayesian approach to what is commonly referred to in science education research as the science and engineering practice of argumentation (Nussbaum, 2011; Szu and Osborne, 2012)—or the research is strictly at the undergraduate level (Warren, 2018, 2020).
There are a few examples of Bayesian data analysis, but this work has been conducted in the undergraduate physics context (Warren, 2018, 2020). Thus, the activity and lesson we described in this article present the first example of which we are aware of how mathematics and sciences teachers at the middle and high school levels can support their students to analyze data in a Bayesian manner. We hope that future research—ours or others—makes further contributions in this area by beginning to document the impacts of participation in Bayesian data analysis using the kinds (or adaptations) of research design and assessments used in the work of Warren (2020).
Another contribution of this study to K-12 education is to describe how to implement a Bayesian approach to reasoning about uncertainty that provides a natural way to use additional data to update prior probability estimates and beliefs about confidence for future mathematics and science teachers. There are three main approaches to probability measurements: classical (known as ‘theoretical’ in school mathematics), frequentist (known as ‘experimental’ in school mathematics), and subjective. While some aspects of the first two approaches are incorporated in K-12 mathematics curricula in different countries, there is a lack of treatment of subjective probability in these documents (Jones et al., 2007). As also noted by Jones et al. (2007) and supported by more recent research (Kazak, 2015; Kazak and Leavy, 2022), there is some evidence that even young students can develop intuitions about modifying prior probability estimates or beliefs about confidence levels when new data are available when engaging with subjective probability. So, pre-service mathematics and science teachers who have such learning experiences themselves may be more likely to use these ideas to help their students develop the kind of knowledge needed to make personal probability judgments.
The Bayesian data analysis activity presented in this paper involves ideas related to informal statistical inference (Makar and Rubin, 2009) and uncertainty. These ideas are potentially relevant to both mathematics and science curricula at the K-12 level as analyzing and interpreting data with an articulation of uncertainty are part of the mathematics and science standards (see the Common Core State Standards: Mathematics (CCSSM) http://www.corestandards.org/Math and the Next Generation Science Standards https://www.nextgenscience.org/). Even though mathematics and science contents are taught in isolation at the school level, mathematics can provide the foundations for analyzing data in solving real-world problems, and science can be a rich source of meaningful contexts for data investigations (Watson, 2017). Knowledge transfer, the application of learning in different contexts, is an important part of problem-solving and an essential skill for the twenty-first century (Nakakoji and Wilson, 2020). In fact, knowledge transfer between disciplines is considered to be an essential part of curricula to prepare students for the future workforce (OECD, 2019). We anticipate that the implementation of this activity within a scientific context (sustainability or energy conservation) with the participation of both mathematics and science pre-service teachers can inspire efforts to make connections between mathematics and science contents in the K-12 school curriculum.
4.3 Contributions to College Statistics Education
We have mentioned earlier in Section 1 that the statistics community calls for scientists to consider Bayesian methods as an alternative in data analysis (Wasserstein and Lazar, 2016). The statistics education literature shows evidence of courses at the college level offered in statistics departments (Berry, 1997; Witmer, 2017; Johnson et al., 2020; Hu, 2020; Hoegh, 2020; Hu and Dogucu, 2022) but these courses do not seem to be in the broader STEM programs (Dogucu and Hu, 2022) with very few exceptions. The fact that Bayesian courses have many prerequisites (Dogucu and Hu, 2022) could be one reason that these courses are not accessible to the broader STEM community.
One prerequisite that is often the centerpiece of discussions on statistical training is calculus. When it comes to introduction to statistics courses, in the modern-day curricula, they are taught with or without calculus as a prerequisite (Carver et al., 2016) but they are often taught in the frequentist paradigm. Even though Bayesian statistics courses rely heavier on calculus as a prerequisite, the fundamentals of Bayesian reasoning, such as updating beliefs, can even be communicated to young learners (Kazak, 2015). We believe that this activity adds to the body of literature on Bayesian activities (e.g., Eadie et al. (2019); Barcena et al. (2019)) that can be completed with high school algebra knowledge. The activity is intentionally designed to avoid mathematical derivations and focuses on fundamentals of Bayesian thinking with the aid of visualization similar to examples in Dogucu and Johnson (2022). Thus it can serve to introduce Bayesian concepts to college-level students who meet fewer mathematics and statistics prerequisites and cannot access a full course on Bayesian statistics.
4.4 Limitations
Though we think this activity makes several contributions, we also note some limitations. This was a single activity with pre-service teachers in two courses and we think it will be fruitful to expand the group of teachers to understand how well this activity meets the needs of teachers at different grade levels, with differing degrees of mathematical and scientific knowledge, and in different teaching contexts (e.g., schools with different levels of socioeconomic capital). We also think it will be fruitful to expand to teachers at different career stages—namely, to in-service (independently teaching in their classroom) mathematics and science teachers.
Furthermore, we think that expanding the activity to include multiple sessions—a “unit” in a course or even an entire course—could be beneficial, though we do think the initial exposure we provided was still valuable.
Another limitation we would like to consider is balancing necessary background information with the core activity that pre-service teachers completed. Given the duration of the single session, a great deal of information was provided to pre-service teachers about Bayes’ Theorem, Bayesian data analysis methods, and the use of the app. Some of this material could be provided in advance to allow more time for in-class work, discussion, reflection, and planning by teachers. However, we think this element could be bolstered, as more comprehensive support could more meaningfully engage students during the lesson and with the statistical concepts the lesson was designed to target. Specifically, we think the following concepts are the requisite for students to engage with the lesson:
Axioms of probability. including probability being a number between 0 and 1, probabilities adding up to 1 in the support of the function, and the addition rule.
Interpretation of density functions. Understanding the area under the curve as probability and the total area adding up to 1.
Distinguishing density functions and the likelihood function. Understanding of prior and posterior distributions as density and the likelihood function as separate from the two. Understanding of likelihood function and identification of maximum likelihood estimate in the plot.
Considering the recommendations of the GAISE College report to place (Carver et al., 2016) “less emphasis on probability in the introductory course,” we suggest that this prerequisite knowledge should be introduced in a non-technical way as much as possible while relying heavily on the reading of visualizations for beginners.
A last limitation concerns the degree of emphasis on the scientific ideas relative to the emphasis on the Bayesian approach. In particular, we think it would be beneficial to align this activity with the disciplinary core ideas that comprise the curricular standards in the country in which we implemented the activity (i.e., the Next Generation Science Standards; National Research Council (2013)). We think this would involve identifying a scientific phenomenon that has a mechanism or process that can be readily represented with the model type (Beta-Binomial) we used. Or, we could use a different appropriate model type (e.g., Normal-Normal or Gamma-Poisson). Doing so would heighten the stakes for understanding the scientific focus of the activity while retaining the emphasis on understanding how Bayesian methods proceed.
4.5 Recommendations for Implementation and Adaptations
The learning activity and the accompanying web app can be used as is by anyone teaching pre-service teachers, in-service teachers, or equally trained learners. Since these resources are provided as open-source, alterations can be made to adopt these resources in different contexts. Based on our experience in teaching this activity and some limitations that we faced, we suggest the following as possible alterations that the readers may consider:
- If teaching only mathematics pre-service or in-service teachers then the activities can be supported by a further in-depth mathematical explanation of the Beta-Binomial model. Many of our participants, who are pre-service mathematics teachers, were eager to learn why the model worked the way it did.
- If desired, the scientific context can possibly be changed. In this case, readers can choose any other unknown to represent π. This has to be done with caution as the data are assumed to follow a Binomial model which assumes that each observation is independent of the other.
- Bring together STEM teachers. A Bayesian modeling activity is a perfect opportunity to bring together teachers of different subjects. It is worth noting, though, that this can be logistically difficult.
- Dedicate time for data collection outside of class time. Unsurprisingly, teaching time is never enough whether it is teaching Bayesian modeling or any other topic. Teachers, especially those who are less familiar with data modeling, need time to internalize concepts. One alteration that future adaptations can include is that teachers can collect data outside of class time thus freeing more time for clarifying concepts during class time. Collecting data at different times can also help with the generalizability of the findings.
- Alter activities based on the mode of teaching (i.e., hybrid, online, or in-person). Future adaptations should carefully take into consideration the data collection process. For instance, if the activity were taught online, the data scenario needs to be changed so that teachers would be able to collect the data at home and in their dormitories.
- Last, consider using different tools. For instructors who would like to adopt a different Bayesian model but are not interested in or able to utilize the Shiny package to develop an app of their own, JASP (Love et al., 2019) may be appropriate.
5 Closing Remarks
Bayesian data analysis is potentially useful and empowering to students at the grades K-12 (pre-collegiate) levels. Teachers are an essential part of helping their own students to potentially benefit from such an approach. In this work, we designed and developed a lesson for pre-service teachers that teachers experienced and reflected on. In so doing, we showed that it is readily possible for pre-service teachers to use such an approach and to report immediate and potentially longer-term benefits from doing so. We hope this work instigates future research and design and development that is intended to make Bayesian thinking more accessible but as powerful for grades K-12 learners as it is in the many domains in which it is used.
Appendices
The web app is freely accessible online at https://mdogucu.shinyapps.io/teachered-bayes-shiny/ and the source code is available on GitHub https://github.com/mdogucu/teachered-bayes-shiny.
The (Electronic) Handout provided to pre-service teachers during the activity can be accessed at https://docs.google.com/document/d/1G3H1aePCx7Jcg226v59m-LiTVcLYe1Ym/edit?usp=sharing&ouid=110969489876425298430&rtpof=true&sd=true
Slides presented to pre-service teachers during the activity can be found at https://docs.google.com/presentation/d/1L27DRrJFqTGGKv9gCgEYhvJfNntsPymH/edit?usp=sharing&ouid=116742544548104368401&rtpof=true&sd=true
Data Availability
The data that support the findings of this study are openly available at https://osf.io/8ev5z/?view_only=0c07df7b340c4461b088f84e5e37548d.
Human Participants
Informed consent was obtained from all study participants. This study was approved by the University of Tennessee, Knoxville Institutional Review Board (18-04804-XP).
Figure 1 Interface of the web app with the prior tab (on the left) and data tab (on the right).
References
- Albert, J. (2002), Teaching Introductory Statistics from a Bayesian Perspective, in ‘Proceedings of the Sixth International Conference on Teaching Statistics. Cape Town, South Africa [CD-ROM]. Voorburg, The Netherlands: International Statistical Institute’.
- Albert, J. and Rossman, A. (2009), ‘Workshop Statistics: Discovery with Data, a Bayesian Approach’.
- Backes, B., Goldhaber, D., Cade, W., Sullivan, K. and Dodson, M. (2018), ‘Can UTeach? Assessing the Relative Effectiveness of STEM Teachers’, Economics of Education Review 64, 184–198. URL: DOI: 10.1016/j.econedurev.2018.05.002.
- Barash, J., Brocas, I., Carrillo, J. D. and Kodaverdian, N. (2019), ‘Heuristic to Bayesian: The Evolution of Reasoning from Childhood to Adulthood’, Journal of Economic Behavior & Organization 159, 305–322. URL: DOI: 10.1016/j.jebo.2018.05.008.
- Barcena, M. J., Garin, M. A., Martin, A., Tusell, F. and Unzueta, A. (2019), ‘A Web Simulator to Assist in the Teaching of Bayes’ Theorem’, Journal of Statistics Education 27(2), 68–78. URL: DOI: 10.1080/10691898.2019.1608875.
- Ben-Zvi, D. (2006), Scaffolding Students’ Informal Inference and Argumentation, in ‘Proceedings of the Seventh International conference on Teaching Statistics’, pp. 1–6. URL: https://iase-web.org/documents/papers/icots7/2D1_BENZ.pdf
- Berry, D. A. (1997), ‘Teaching Elementary Bayesian Statistics with Real Applications in Science’, The American Statistician 51(3), 241–246. URL: https://www.tandfonline.com/doi/abs/10.1080/00031305.1997.10473970
- Biehler, R., Frischemeier, D. and Podworny, S. (2015), Preservice Teachers’ Reasoning About Uncertainty in the Context of Randomization Tests, in A. Zieffler and E. Fry, eds, ‘Reasoning about Uncertainty: Learning and Teaching Informal Inferential Reasoning’, Catalyst Press Minnesota, pp. 129–162.
- Braham, H. M. and Ben-Zvi, D. (2015), Students’ Articulations of Uncertainty in Informally Exploring Sampling Distributions, in A. Zieffler and E. Fry, eds, ‘Reasoning about Uncertainty: Learning and Teaching Informal Inferential Reasoning’, Catalyst Press, Minneapolis, pp. 57–94.
- Carpenter, B., Gelman, A., Hoffman, M. D., Lee, D., Goodrich, B., Betancourt, M., Brubaker, M., Guo, J., Li, P. and Riddell, A. (2017), ‘Stan: A Probabilistic Programming Language’, Journal of Statistical Software 76(1). URL: DOI: 10.18637/jss.v076.i01.
- Carver, R., Everson, M., Gabrosek, J., Horton, N., Lock, R., Mocko, M., Rossman, A., Roswell, G. H., Velleman, P., Witmer, J. et al. (2016), Guidelines for Assessment and Instruction in Statistics Education (GAISE): College Report, Technical report. URL: http://www.amstat.org/education/gaise
- Chang, W., Cheng, J., Allaire, J., Sievert, C., Schloerke, B., Xie, Y., Allen, J., McPherson, J., Dipert, A. and Borges, B. (2021), ‘shiny: Web Application Framework for R’. URL: https://cran.r-project.org/web/packages/shiny/index.html
- Chernoff, E. J. (2014), Will the Real Bayesian Probability Please Stand Up, in ‘Proceedings of the 9th International Conference on Teaching Statistics. Flagstaff, AZ, USA. Voorburg, The Netherlands: International Statistical Institute’. URL: https://icots.info/9/proceedings/pdfs/ICOTS9_6A1_CHERNOFF.pdf
- Dogucu, M. and Hu, J. (2022), ‘The Current State of Undergraduate Bayesian Education and Recommendations for the Future’, The American Statistician pp. 1239–1262. URL: DOI: 10.1080/00031305.2022.2089232.
- Dogucu, M. and Johnson, A. (2022), Supporting Bayesian Modeling With Visualizations, in ‘Bridging the Gap: Empowering and Educating Today’s Learners in Statistics. Proceedings of the Eleventh International Conference on Teaching Statistics’, International Association for Statistical Education. URL: https://iase-web.org/icots/11/proceedings/pdfs/ICOTS11_222_DOGUCU.pdf?1669865538
- Dogucu, M., Johnson, A. and Ott, M. (2021), ‘bayesrules: Datasets and Supplemental Functions from Bayes Rules! Book’. URL: https://cran.r-project.org/web/packages/bayesrules/index.html
- Eadie, G., Huppenkothen, D., Springford, A. and McCormick, T. (2019), ‘Introducing Bayesian Analysis with m&m’s[textregistered]: An Active-Learning Exercise for Undergraduates’, Journal of Statistics Education 27(2), 60–67.
- Gelfand, A. E. and Smith, A. F. (1990), ‘Sampling-Based Approaches to Calculating Marginal Densities’, Journal of the American statistical association 85(410), 398–409.
- Gelman, A., Lee, D. and Guo, J. (2015), ‘Stan: A Probabilistic Programming Language for Bayesian Inference and Optimization’, Journal of Educational and Behavioral Statistics 40(5), 530–543. URL: DOI: 10.3102/1076998615606113.
- Goodrich, B. (2022), ‘rstanarm: Bayesian Applied Regression Modeling via Stan’. R package version 2.21.3. URL: https://mc-stan.org/rstanarm
- Hacking, I. (2001), An Introduction to Probability and Inductive Logic, Cambridge University Press: New York, NY.
- Henriques, A. and Oliveira, H. (2016), ‘Students’ Expressions of Uncertainty in Making Informal Inference When Engaged in a Statistical Investigation Using Tinkerplots’, Statistics Education Research Journal 15(2), 62–80. URL: DOI: 10.52041/serj.v15i2.241.
- Hoegh, A. (2020), ‘Why Bayesian Ideas Should Be Introduced in the Statistics Curricula and How to Do So’, Journal of Statistics Education 28(3), 222–228. URL: https://www.tandfonline.com/doi/full/10.1080/10691898.2020.1841591
- Hu, J. (2020), ‘A Bayesian Statistics Course for Undergraduates: Bayesian Thinking, Computing, and Research’, Journal of Statistics Education 28(3), 229–235. Publisher: Taylor & Francis. URL: DOI: 10.1080/10691898.2020.1817815.
- Hu, J. and Dogucu, M. (2022), ‘Content and Computing Outline of Two Undergraduate Bayesian Courses: Tools, Examples, and Recommendations’, Stat p. e452. Publisher: Wiley Online Library. URL: DOI: 10.1002/sta4.452.
- Johnson, A., Ott, M. and Dogucu, M. (2022), Bayes Rules! An Introduction to Bayesian Modeling with R, CRC Press. URL: https://www.bayesrulesbook.com/
- Johnson, A., Rundel, C., Hu, J., Ross, K. and Rossman, A. (2020), ‘Teaching an Undergraduate Course in Bayesian Statistics: A Panel Discussion’, Journal of Statistics Education 28(3), 251–261. Publisher: Taylor & Francis. URL: DOI: 10.1080/10691898.2020.1845499.
- Jones, A., Langrall, C. and Mooney, E. (2007), ‘Research in Probability. Responding to Classroom Realities. I F. Lester (ed.): Second Handbook of Research on Mathematics Teaching and Learning’.
- Kay, M. (2022), ‘tidybayes: Tidy Data and ’Geoms’ for Bayesian Models’. R package version 3.0.2. URL: https://mjskay.github.io/tidybayes/
- Kazak, S. (2015), A Bayesian Inspired Approach to Reasoning about Uncertainty:’How Confident Are You?’, in ‘CERME 9-Ninth Congress of the European Society for Research in Mathematics Education’, pp. 700–706. URL: https://hal.science/hal-01287091/
- Kazak, S., Fujita, T. and Turmo, M. P. (2021), ‘Students’ Informal Statistical Inferences Through Data Modeling with a Large Multivariate Dataset’, Mathematical Thinking and Learning pp. 1–21. URL: DOI: 10.1080/10986065.2021.1922857.
- Kazak, S. and Leavy, A. (2022), ‘The Emerging Interplay Between Subjective and Objective Notions of Probability in Young Children’, Canadian Journal of Science, Mathematics and Technology Education 22(3), 538–557. URL: DOI: 10.1007/s42330-022-00227-0.
- Kazak, S. and Leavy, A. M. (2018), Emergent Reasoning About Uncertainty in Primary School Children with a Focus on Subjective Probability, in A. Leavy, M. Meletiou-Mavrotheris and E. Paparistodemou, eds, ‘Statistics in early childhood and primary education’, Springer, pp. 37–54. URL: DOI: 10.1007/978-981-13-1044-7_3.
- Kézdi, G. and Shapiro, M. D. (2023), Retirement Expectations, in ‘Handbook of Economic Expectations’, Elsevier, pp. 293–320.
- Krajcik, J. S. and Czerniak, C. M. (2018), Teaching Science in Elementary and Middle School: A Project-Based Learning Approach, Routledge.
- Kreitler, S. and Kreitler, H. (1986), ‘Development of Probability Thinking in Children 5 to 12 Years Old’, Cognitive Development 1(4), 365–390. URL: DOI: 10.1016/S0885-2014.(86)80009-0
- Lawson, M. A., Herrick, I. R. and Rosenberg, J. M. (2021), ‘Better Together’, Educational Technology & Society 24(4), 180–192. URL: https://www.jstor.org/stable/48629254
- Lehrer, R. and English, L. (2018), Introducing Children to Modeling Variability, in ‘International handbook of research in statistics education’, Springer, pp. 229–260. URL: DOI: 10.1007/978-3-319-66195-7_7.
- Love, J., Selker, R., Marsman, M., Jamil, T., Dropmann, D., Verhagen, J., Ly, A., Gronau, Q. F., Šmíra, M., Epskamp, S. et al. (2019), ‘JASP: Graphical Statistical Software for Common Statistical Designs’, Journal of Statistical Software 88, 1–17. URL: DOI: 10.18637/jss.v088.i02.
- Makar, K. (2014), ‘Young Children’s Explorations of Average Through Informal Inferential Reasoning’, Educational Studies in Mathematics 86(1), 61–78. URL: DOI: 10.1007/s10649-013-9526-y.
- Makar, K. and Rubin, A. (2009), ‘A Framework for Thinking about Informal Statistical Inference’, Statistics Education Research Journal 8(1). URL: DOI: 10.52041/serj.v8i1.457.
- Makar, K. and Rubin, A. (2018), Learning about Statistical Inference, International Handbook of Research in Statistics Education. Springer International Handbooks of Education. Springer, Springer, pp. 261–294. URL: DOI: 10.1007/978-3-319-66195-7_8.
- Martignon, L. and Erickson, T. (2014), Proto-Bayesian Reasoning of Children in Fourth Class, in ‘Sustainability in statistics education. Proceedings of the Ninth International Conference on Teaching Statistics. Voorburg: International Association of Statistics Education’. URL: https://iase-web. org/documents/papers/rt2016/Martignon.pdf
- McNamara, A. (2019), ‘Key Attributes of a Modern Statistical Computing Tool’, The American Statistician 73(4), 375–384. URL: DOI: 10.1080/00031305.2018.1482784.
- Mishra, P. and Koehler, M. J. (2006), ‘Technological Pedagogical Content knowledge: A Framework for Teacher Knowledge’, Teachers College Record 108(6), 1017–1054. URL: DOI: 10.1111/j.1467-9620.2006.00684.x.
- Nakakoji, Y. and Wilson, R. (2020), ‘Interdisciplinary Learning in Mathematics and Science: Transfer of Learning for 21st Century Problem Solving at University’, Journal of Intelligence 8(3), 32.
- National Governors Association (2010), ‘Common Core State Standards’, Washington, DC .
- National Research Council (2013), ‘Next Generation Science Standards: For States, by States’. URL: https://www.nextgenscience.org/
- Nilsson, P., Blomberg, P. and Ärlebäck, J. B. (2014), Exploring Realistic Bayesian Modeling Situations, in ‘Proceedings of the 9th International Conference on Teaching Statistics. Flagstaff, AZ, USA. Voorburg, The Netherlands: International Statistical Institute’. URL: https://icots.info/9/proceedings/pdfs/ICOTS9_6A3_NILSSON.pdf
- Nussbaum, E. M. (2011), ‘Argumentation, Dialogue Theory, and Probability Modeling: Alternative Frameworks for Argumentation Research in Education’, Educational Psychologist 46(2), 84–106. URL: DOI: 10.1080/00461520.2011.558816.
- OECD (2019), ‘Future of Education and Skills 2030: Conceptual Learning Framework’.
- Piaget, J. and Inhelder, B. (1951), La Genèse de L’idée de Hasard Chez L’enfant., Presses Universitaires de France.
- Plummer, M. et al. (2003), JAGS: A Program for Analysis of Bayesian Graphical Models Using Gibbs Sampling, in ‘Proceedings of the 3rd International Workshop on Distributed Statistical Computing’, Vol. 124, Vienna, Austria, pp. 1–10. URL: https://www.r-project.org/conferences/DSC-2003/Proceedings/Plummer.pdf
- Rosenberg, J., Kubsch, M., Wagenmakers, E.-J. and Dogucu, M. (2022), ‘Making Sense of Uncertainty in the Science Classroom: A Bayesian Approach’, Science & Education 31(5), 1239–1262. URL: DOI: 10.1007/s11191-022-00341-3.
- Rosenberg, J. M., Schultheis, E. H., Kjelvik, M. K., Reedy, A. and Sultana, O. (2022), ‘Big Data, Big Changes? The Technologies and Sources of Data Used in Science Classrooms’, British Journal of Educational Technology 53(5), 1179–1201. URL: DOI: 10.1111/bjet.13245.
- Rossman, A. J. (2008), ‘Reasoning about Informal Statistical Inference: One Statistician’s View’, Statistics Education Research Journal 7(2), 5–19. URL: DOI: 10.52041/serj.v7i2.467.
- Rossman, A. J. and Chance, B. L. (2014), ‘Using Simulation-Based Inference for Learning Introductory Statistics’, Wiley Interdisciplinary Reviews: Computational Statistics 6(4), 211–221. URL: DOI: 10.1002/wics.1302.
- Rubin, A. (2020), ‘Learning to Reason with Data: How Did We Get Here and What Do We Know?’, Journal of the Learning Sciences 29(1), 154–164. URL: DOI: 10.1080/10508406.2019.1705665.
- Szu, E. and Osborne, J. (2012), Scientific Reasoning and Argumentation from a Bayesian Perspective, in M. S. Khike, ed., ‘Perspectives on scientific argumentation’, Springer, Dordrecht, pp. 55–71. URL: DOI: 10.1007/978-94-007-2470-9_4.
- Warren, A. R. (2018), ‘Quantitative Critical Thinking: Student Activities Using Bayesian Updating’, American Journal of Physics 86(5), 368–380. URL: DOI: 10.1119/1.5012750.
- Warren, A. R. (2020), ‘Impact of Bayesian Updating Activities on Student Epistemologies’, Physical Review Physics Education Research 16(1). URL: DOI: 10.1103/PhysRevPhysEducRes.16.010101.
- Wasserstein, R. L. and Lazar, N. A. (2016), ‘The ASA Statement on p-Values: Context, Process, and Purpose’, The American Statistician 70(2), 129–133. Taylor & Francis. URL: DOI: 10.1080/00031305.2016.1154108.
- Watson, J. M. (2008), ‘Exploring Beginning Inference with Novice Grade 7 Students’, Statistics Education Research Journal 7(2), 59–82. URL: DOI: 10.52041/serj.v7i2.470.
- Watson, J. M. (2017), ‘Linking Science and Statistics: Curriculum Expectations in Three Countries’, International Journal of Science and Mathematics Education 15, 1057–1073. URL: DOI: 10.1007/s10763-015-9673-y.
- Witmer, J. (2017), ‘Bayes and MCMC for Undergraduates’, The American Statistician 71(3), 259–264. URL: DOI: 10.1080/00031305.2017.1305289.