 ?Mathematical formulae have been encoded as MathML and are displayed in this HTML version using MathJax in order to improve their display. Uncheck the box to turn MathJax off. This feature requires Javascript. Click on a formula to zoom.
Abstract
Today’s data-driven world requires earth and environmental scientists to have skills at the intersection of domain and data science. These skills are imperative to harness information contained in a growing volume of complex data to solve the world’s most pressing environmental challenges. Despite the importance of these skills, Earth and Environmental Data Science (EDS) training is not equally accessible, contributing to a lack of diversity in the field. This creates a critical need for EDS training opportunities designed specifically for underrepresented groups. In response, we developed the Earth Data Science Corps (EDSC) which couples a paid internship for undergraduate students with faculty training to build capacity to teach and learn EDS using Python at smaller Minority Serving Institutions. EDSC faculty participants are further empowered to teach these skills at their home institutions which scales the program beyond the training lead by our team. Using a Rasch modeling approach, we found that participating in the EDSC program had a significant impact on undergraduate learners’ comfort and confidence with technical and nontechnical data science skills, as well as their science identity and sense of belonging in science, two critical aspects of recruiting and retaining members of underrepresented groups in STEM. Supplementary materials for this article are available online.
1 Background
Data are becoming increasingly abundant and diverse. From our smartphones, to wearable computers, to social media, we are constantly creating and being exposed to data. With this explosion of big data, there is a need for a data-literate workforce that is capable of accessing, and analyzing these data in a way that is useful for a diversity of collaborators and decision makers (Henke et al. Citation2016). The Earth and Environmental Sciences (EES), specifically, produces vast amounts of data, from satellite observations to in situ sensor measurements, while at the same time tackling challenging research questions that directly impact peoples’ wellbeing, such as natural hazards (Iglesias et al. Citation2021) or impacts from climate change (Monteleoni, Schmidt, and McQuade Citation2013). At the nexus of big data and socially relevant questions, EES is experiencing an increasing need for well-trained researchers capable of working with large datasets in areas such as modeling weather and climate, managing large networks of environmental sensors, and analyzing the ever-growing quantities of information being streamed from satellites and other remote sensing devices (Gibert et al. Citation2018). This presents a need for researchers with disciplinary backgrounds in EES who also possess the critical computational skills necessary to work with increasingly large datasets, and conduct data-intensive environmental science investigations (Hampton et al. Citation2017). Minority Serving Institutions (MSIs) cater to a student population that often faces institutional barriers and other socioeconomic hurdles that can limit availability of the resources, and educational opportunities, needed to obtain and work with these data, leading to historically underrepresented communities who disproportionately lack access to, and knowledge of these resources. This creates a need for Earth and Environmental Data Science (EDS) training opportunities (Wasser et al. Citation2022), with an emphasis on EES applications, designed for both learners and educators from underrepresented groups.
One approach to domain-specific, data analytic training in EES for members of historically marginalized communities is the Earth Data Science Corps (EDSC; Quarderer et al. Citation2023), led by the Earth Analytics Education Initiative at the University of Colorado Boulder (Earth Lab/The Cooperative Institute for Research in Environmental Sciences [CIRES]). This internship program partners with Tribal Colleges and Universities (TCUs) and a Hispanic Serving Institution (HSI) in the western U.S. to offer technical training in Python, and an immersive, project-based learning experience focused on environmental and geospatial applications for faculty and undergraduates from partner institutions. Through participation in the EDSC summer internship, students and faculty from groups who have been historically underrepresented in STEM (e.g., women, people of color) gain hands-on experience with technical data science skills, and work in groups with peers on an applied EDS project, while developing collaboration and science communication skills, and growing their comfort and confidence working with different data types. A core goal of the EDSC was to build institutional capacity to teach and learn EDS by offering technical and pedagogical professional development to faculty partners. The program also provided an opportunity for EDSC alumni to return to the summer program as advanced interns where they helped train their peers, and developed critical mentorship and leadership skills that supported at least one student to continue on to teach Python at their home institution.
Conceptualized and funded prior to the onset of the COVID-19 pandemic, the EDSC was originally designed as a hybrid, in-person and online program, to begin in May 2020, where participants would spend a week on the University of Colorado campus in Boulder for in-person technical training, before returning to their home institutions for synchronous online instruction, and project work time. However, in March 2020, the EDSC program was forced to abruptly move to a fully online model before in-person meetings were able to take place. Even though the virtual format allowed students to participate in the program while travel was restricted, and pandemic-related safety precautions were in place (Bawadi et al. Citation2023; Fletcher Jr, Minar, and Rice 2023), online learners often report feeling isolated and detached from a larger, social classroom environment (Gillett-Swan Citation2017) and struggle in navigating the technological demands (Bawadi et al. Citation2023). These challenges were addressed through clear scaffolding and ongoing guidance on interacting in virtual platforms, and through intentional group work and frequent check-ins.
Modeled after the Earth Analytics Data Science Bootcamp course (Palomino and Wasser 2023), and informed by years of teaching EDS to professional graduate certificate students in a hybrid online and in-person setting, the EDSC fills a data science training need by offering EDS education to faculty and undergraduates from historically underrepresented groups in a fully online learning environment, thereby accommodating participation without a need to relocate. Often students at MSIs are nontraditional, supporting families, jobs, and other responsibilities. While learning and teaching technical data science topics and skills online have their own unique challenges and constraints (Gulatee and Combes Citation2008; Martin et al. Citation2021), we studied the impact of our approach to assess its effectiveness as a model. Similarly, we looked for evidence of growth in learners’ science identity and sense of belonging in science, two crucial aspects of recruiting and retaining learners from marginalized communities in STEM (Dortch and Patel Citation2017; Rainey et al. Citation2018; Rodriguez and Blaney Citation2021). Below we describe our approach to EDS education, and to democratizing access to data science through the EDSC. We share findings from data collected over three years of the EDSC, and discuss how these results fit into the larger conversation around online learning environments, and teaching technical topics to learners from under-resourced communities. The goal of the work outlined here is to address the following set of questions:
How does involvement in an immersive, online, project-based data science learning environment contribute to the development of participants’:
Self-confidence in their Earth Data Science technical skills?
Science and data science communication skills?
Science identity and sense of belonging?
2 Earth and Environmental Data Science Education
2.1 Earth and Environmental Data Science (EDS)
Our model of Earth and Environmental Data Science (EDS) refers to in-demand skills at the intersection of science and data science (Wasser et al. Citation2022). While data science and domain science have traditionally been taught separately, in today’s data-driven world, there is a demand for those with both technical data science skills as well as domain science content knowledge (Pennington et al. Citation2020). Our instructional approach strengthens several components of EDS. First, we teach technical data science skills including scientific programming, version control, and the command line, which are critical skills for Earth data scientists (Hampton et al. Citation2017; Wasser et al. Citation2022). Next, domain science knowledge is needed as it supports data processing decisions, developing approaches to address scientific questions using data, and the selection of appropriate data needed to pose and address a research question. Understanding different data types is critical to our EDS education model, given that scientists spend nearly 80% of their time cleaning their data and preparing it for analysis (Snyder Citation2019). Likewise, having a solid grasp of different data structures makes it easier and faster for learners to identify potential data issues, select appropriate processing tools and integrate data. Finally, communication and collaboration skills are essential for anyone working in EDS, given science is becoming increasingly transdisciplinary, and professional work environments are shifting toward remote options where collaboration often happens asynchronously.
2.2 Democratizing Access to EDS Education
There is a growing opportunity for learners to pursue careers in the booming data science job market (Manyika et al. Citation2017), yet learning technical data science skills remains a challenge, since courses in these areas are traditionally offered at large, well-funded research-intensive universities (Tang and Sae-Lim Citation2016). While successful models for teaching data science and computational methods in the health sciences (Tan, Elkin, and Satagopan Citation2022), applied statistics (Nolan and Temple Lang Citation2015), and physics and astronomy (Caballero et al. Citation2019) have been reported, including summer workshops and research experience for undergraduates and faculty, there is a need for targeted training opportunities in the earth (Pennington et al. Citation2020) and environmental sciences (Emery et al. Citation2021). Our EDS education model is built on four core components that contribute to program scalability and sustainability: (i) provide EDS training to both undergraduate students and faculty at partner institutions, (ii) provide faculty with pedagogical support needed to integrate EDS curriculum into existing courses at their home institutions, (iii) empower the next generation of teachers by providing interns with the opportunity to return as advanced interns to mentor their peers and, (iv) widely democratize access to EDS curriculum by publishing teaching and learning materials online as Open Educational Resources (OER) that others including faculty at MSIs can use in their classrooms.
Throughout their participation in the EDSC summer program, faculty mentors participated in workshop sessions alongside undergraduate students and were a familiar point of contact for troubleshooting and support. As a faculty mentor, attending the workshops was a way to show students that faculty were involved and invested in their students’ learning and success. Faculty mentors met together, provided feedback, offered troubleshooting support, shared resources, and worked toward broadening the reach of the EDSC through course material development. A significant milestone emerged with the initiation of the EDSC program’s support for participating faculty in creating an EDS module designed for integration into their preferred courses. This not only enabled faculty members to incorporate this module into one or more of their classes, but also facilitated the extension of summer projects into the academic year.
In years two and three of the program, we invited EDSC participants from the previous year to serve as advanced intern student mentors, creating and maintaining a channel of connectedness within the student group. It is vital for students to feel connected to peers who have succeeded, given we know vicarious experiences and observational learning can be a highly valuable motivator for students, helping to build self-efficacy (Bandura Citation1986; Zaniewski and Reinholz Citation2016; Lim et al. Citation2017; Fayram et al. Citation2018; Ahern-Dodson et al. Citation2020). Following the model that we developed for our other EDS programs (Wasser et al. Citation2022), we published all learning resources for the EDSC online on our https://www.earthdatascience.org learning portal which sees over one million unique global users each year. The curriculum for the EDSC can be found in our Introduction to Earth Data Science textbook (Palomino, Wasser, and Joseph Citation2021) and is available to be used for both asynchronous independent learning as well as embedded into existing courses.
2.3 The Earth Data Science Corps (EDSC)
Through a 12-week paid summer internship, the National Science Foundation (NSF)-funded EDSC included technical workshops and an immersive, project-based learning experience, intended to build participants’ comfort and confidence with different technical and nontechnical data science skills, provide experience with various data science practices, and help shape participants’ science identities and sense of belonging to a larger community of data scientists. All EDSC workshops and meetings were virtual, taking place over Zoom (Zoom Video Communications Citation2020) during the first year of the program (2020), and SpatialChat (Citation2022) in subsequent years (2021, 2022). Homework assignments and other student questions were posted to a free and open-source Internet forum software called Discourse (Citation2022), facilitating asynchronous communication between students and workshop instructors. Participants also made regular use of Slack (Citation2022), a messaging program designed for the professional workplace to maintain regular communication. While a JupyterHub (Jupyter 2022) was maintained by Earth Lab staff during the first year of the EDSC to provide access to lesson notebooks, in the second and third years all programming and homework notebooks were completed using the free Google Colab environment (Google Citation2022) which hosts cloud-based Jupyter Notebooks (Kluyver et al. Citation2016). Moving to Google Colab further builds capacity for faculty at MSIs to teach this material given the platform is also freely available. Faculty partners could then easily use the notebooks developed in our program in their classrooms in future years, allowing students to get started coding right away without the need to download packages or set up a local environment, a hurdle that can often be difficult to overcome, particularly for those who are new to programming (Kim and Henke Citation2021). Google Colab also allowed participants to take their work with them at the end of the internship for continued access to course materials and lessons, without the need to install a working environment on their local computers.
Modeled after our Earth Data Analytics (EDA) Professional Graduate Certificate program at the University of Colorado Boulder (Wasser, Herwehe, and Palomino Citation2019a) and the Data Carpentry teaching approach (Teal et al. Citation2015), EDSC technical workshops took place synchronously online two to three times each week for six weeks during the summer and covered topics including strings, lists, and operators in Python, working with tabular and time-series data using pandas (McKinney Citation2011; Pandas Development Team Citation2022), working with raster and vector spatial data using rioxarray (Snow et al. Citation2021; rioxarray contributors Citation2023), GeoPandas (GeoPandas contributors Citation2023) and EarthPy (Wasser et al. Citation2019b), and plotting data using Matplotlib (Caswell et al. Citation2022). Participants were also introduced to topics related to writing clean, open, reproducible code that can be run on any operating system. EDSC workshop topics were briefly introduced by an EDSC instructor before participants worked with their peers and faculty mentors in small breakout sessions. Communication tools including Zoom and SpatialChat helped create an interactive, online learning environment where users were encouraged to share their screens and engage in small groups and paired programming (Saltz and Heckman Citation2020) to work through coding activities and homework challenges with their colleagues.
After six weeks of technical workshops (), EDSC participants shifted their focus to a six-week, immersive, applied EDS group research project with peers from their home institutions and led by their faculty mentors (). During the six weeks of group project work time, teams met regularly (2–3 times/week) to organize project ideas and craft their project pitches using a Message Box (COMPASS Science Communication Citation2023), to look for relevant data to answer their research questions, and develop workflows that applied Python and EDS skills learned during the technical training sessions. Throughout project work time, all of the teams would meet together as a large group to share weekly progress reports and solicit feedback from their peers. This gave each group the opportunity to practice their public speaking and science messaging in preparation for their final presentations that took place during the last week of the EDSC internship.
Table 1 Outline of tools and topics covered during the technical workshops (Weeks 1–6) of the Earth Data Science Corps summer internship.
Table 2 Outline of topics covered during group project work time (Weeks 7–12) of the Earth Data Science Corps summer internship (2020–2022).
One critical aspect of successful project-based learning is a student’s relationship to the topic being studied. Students and faculty worked together to select projects that were data-driven but also culturally relevant. Working in teams of four to five students and one to two faculty partners, projects from the EDSC focused on a variety of locally and culturally relevant topics that have included flooding on tribal lands, COVID-19 data sovereignty, developing spatial mapping tools for Tribal College campuses and communities, transportation, air-quality patterns, and water resource management in the Denver metropolitan area, bird behavior and methane fluxes in the Prairie Pothole Region in the Dakotas, among others. Student research projects included formal group presentations and written blog posts summarizing their methods and findings, giving participants an opportunity to further develop their science communication skills, a critical component of our EDS model (Wasser et al. Citation2022). Details about each EDSC group project can be found here: https://earthlab.colorado.edu/our-work/teaching-and-learning-earth-data-science/earth-data-science-corps/earth-data-science-corps-projects
2.4 EDSC Demographics
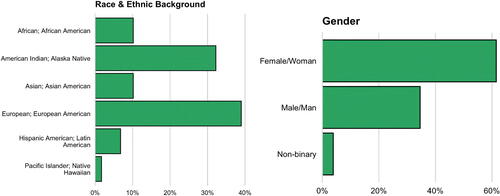
The EDSC partnered with the University of Colorado Boulder, along with two Tribal Colleges and Universities (TCUs) and a Hispanic Serving Institution (HSI) for all three years of the program (2020–2022), as well as a local community college in the first year of the program (2020). These five institutions were selected for partnership prior to project funding to span a wide range of EDS education capacities and build a diverse, workforce-ready cohort of undergraduate students through training and applied projects. Faculty mentors recruited students from participating institutions and were encouraged to select applicants who could help build ethnic and gender diversity in the data sciences (e.g., women, minorities). Roughly one-third of participants reported having a deep connection with their Native tribal communities, with a nearly equal fraction collectively identifying as either African American, Asian, or Hispanic. Nearly two-thirds of students who participated in the EDSC identified as female (). From 2020 through 2022, the EDSC trained three separate cohorts of participants, which included 61 undergraduate student interns and eight faculty mentors. In total, 53 participating undergraduate student interns provided consent to participate in this study (Year 1 [2020] = 19 students; Year 2 [2021] = 15 students; Year 3 [2022] = 19 students).
Fig. 1 Demographic information from EDSC undergraduate student interns (2020–2022; n = 53). In six cases participants reported multiracial backgrounds.
3 Methods
3.1 Data Collection & Analysis
This study includes three years of survey data collected from participating EDSC undergraduate student interns to examine how the EDSC approach to data science instruction shaped learners’ Python and data science skills, communication skills related to data science, confidence with different data science practices, and sense of identity and belonging in science. Likert surveys were developed (see Appendix Tables A1–A5) to assess changes across five different EDS constructs: technical (i) Python and (ii) data science skills, (iii) communication skills in science and data science, (iv) general data science practices, and (v) sense of science identity and belonging. The instruments intended to measure students’ comfort and confidence with Python (Table A1) and data science (Table A2) were designed by the EDSC assessment and evaluation team and included items that asked about creating reproducible workflows, publishing code, using Jupyter Notebooks, and working with time-series, tabular, spatial, and remotely sensed data using Python. Similarly, the authors developed survey items to assess EDSC participants’ self-perceived confidence in communicating their science findings orally and through writing, including blogs (Table A3), and with different data science practices (Table A4) including generating research questions, and finding data to address those questions. In addition to measuring students’ comfort and confidence with different technical data science and communication skills, this study also aimed to understand the effects on student identity and sense of belonging in science (Table A5). Questions asked as part of this dimension of the end-of-program survey were taken from a validated instrument used to measure science identity and sense of belonging in science (Chemers et al. Citation2011; Robnett, Chemers, and Zurbriggen Citation2015).
Table 3 Min and max values of person ability measured in logits and % probability for both trials for each of the 5 survey dimensions.
Table 4 Min and max values of item difficulty measured in logits and % probability for each of the 5 survey dimensions.
Table 5 Measures of average mean-square (MNSQ) item infit for each trial of the 5 survey dimensions.
Data were collected at the end of each of three summers (2020–2022) through a retrospective post-then-pre survey (Lam and Bengo Citation2003) where participants provided two responses to each set of questions, one that measured their level of comfort or confidence after completing the EDSC workshops, and another that measured their comfort or confidence before participating in the EDSC. Of the different types of retrospective post-surveys, the retrospective post-then-pre design (sometimes written as retrospective pretest or post + retrospective pretest) has been shown to provide a more accurate measure of outcomes than the traditional pre-then-post design, and can lead to more accurate estimates of changes due to some intervention than a traditional pre-post design because it can control for response shift bias, and result in a more accurate participant reflection (Pratt, McGuigan, and Katzev Citation2000; Drennan and Hyde Citation2008; Cartwright and Atwood Citation2014).
Analysis of Likert surveys traditionally involves assigning numerical values to each of the different response categories (e.g., 1 = Strongly Disagree, 2 = Disagree, 3 = Neither Agree nor Disagree, 4 = Agree, 5 = Strongly Agree). These numerical values are often totaled for each respondent and then used to calculate descriptive statistics (mean, standard deviation) and as variables in parametric statistical analysis (t-tests, ANOVA, etc.). This traditional approach to analyzing responses from Likert surveys, known as Classical Testing Theory (CTT), which makes use of raw responses, often violates normality requirements needed to carry out inferential statistics (Boone, Staver, and Yale Citation2013). Raw data collected from Likert surveys is ordinal in nature, and nothing is known about the distance between response categories like Agree and Strongly Agree (Boone Citation2020). One technique used to convert ordinal data from Likert surveys to linear data that can be used in t-tests and analysis of variance (ANOVA) is Rasch modeling (Rasch Citation1960). Part of a larger family of measurement approaches known as Item Response Theory (IRT), Rasch modeling is commonly used in psychometrics to assess the quality of survey instruments. This approach to measurement provides estimates of person ability, and item difficulty along a common log-odds (logit) scale. Here, a person’s ‘ability’ can be thought of as the amount of an underlying trait held by that individual (e.g., level of Python or Data Science skill, etc.). Item difficulty is the level of a specific trait that a survey taker must have in order to endorse that particular survey item. A key feature of any Rasch model is the likelihood of a survey taker responding in a specific way to a particular item is a function of the difference between the individual’s ability and the difficulty of the survey item (Boone, Staver, and Yale Citation2013).
Ability and difficulty values measured in logits can also be reported as probabilities using the inverse logit function where e is Euler’s number (2.718) and x is the logit value (Abbakumov, Desmet, and Van den Noortgate Citation2020). When item difficulty and person ability are measured in percent probability, it provides a direct estimate of the likelihood of success (Wright and Stone Citation1979). Higher values indicate a higher chance of success, while lower values indicate a lower chance of success. Person ability measured in percent probability represents the estimated probability that a particular individual will endorse an item of average difficulty. Item difficulty measured in percent probability represents how likely a respondent with average ability is to endorse a particular item.
For this study, a Rasch rating scale model (RSM; Andrich Citation1978) for each of the five Likert-like survey instruments was built using the Test Analysis Modules package (TAM; Robitzsch, Kiefer, and Wu Citation2018) in the R programming environment (R Core Team Citation2021). This package calculates measures of person ability, item difficulty, person and item separation reliability, as well as parameters used to identify misfitting items and assess unidimensionality (i.e., is the survey measuring a single construct?). Values of person ability obtained from the Rasch model were then used as variables in ANOVA and post-hoc t-testing to assess growth in participants’ self-perceived comfort and confidence with different technical and nontechnical data science skills following their participation in the EDSC program.
4 Results
4.1 Raw Response Percents (before/after)
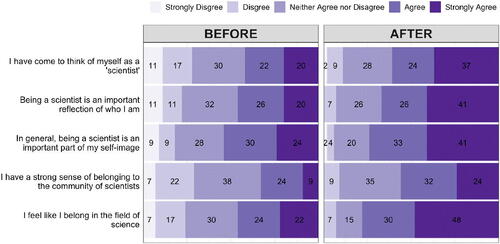
Plots of raw responses (as percentages) from each of the five surveys were developed to visually compare students’ perceived comfort and confidence prior to and following their participation in the EDSC program (). Based on these plots, students’ comfort with specific Python skills (), and confidence with general data science skills () underwent the greatest shift following instruction, with over 90% of respondents reporting either a complete lack of or only slight levels of comfort or confidence in some of these areas before instruction. Post-EDSC responses showed in most instances 60%–80% of participants reported moderate to high levels of confidence or comfort with these same sets of technical Python and data science skills. While a shift in students’ attitudes related to data science communication (), data science practices (), and science identity () were also observed in the plots of raw percentages, growth was less pronounced in these areas when compared to the shifts in responses reported on the surveys used to measure Python and data science skills. For each of these three survey instruments, at most 70%–75% of respondents disagreed with or reported low levels of confidence on items asking about their data science communication, data science practices, or science identity and sense of belonging on the pre-instruction questions, suggesting that participants came into the program with a higher self-reported level of ability or comfort in these areas.
Fig. 2 Distribution of raw responses (n = 46) to the Python Skills assessment items. Numerical labels indicate percent of respondents in each category.
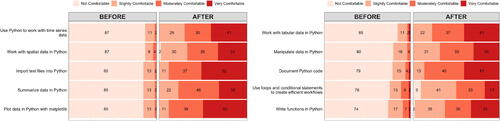
Fig. 3 Distribution of raw responses (n = 46) to the Data Science Skills assessment items. Numerical labels indicate percent of respondents in each category.
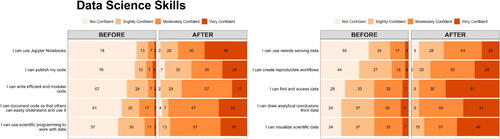
Fig. 4 Distribution of raw responses (n = 48) to the Data Science Communication Skills assessment items. Numerical labels indicate percent of respondents in each category.
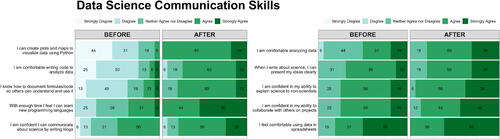
Fig. 5 Distribution of raw responses (n = 48) to the Science Practices assessment items. Numerical labels indicate percent of respondents in each category.
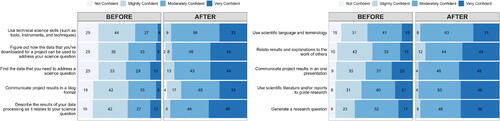
Fig. 6 Distribution of raw responses (n = 46) to the Science Identity assessment items (Robnett, Chemers, and Zurbriggen Citation2015). Numerical labels indicate percent of respondents in each category.
4.2 Rasch Measurement
Raw survey responses were assigned numerical values based on category, with 1 corresponding to the lowest level of endorsement (e.g., Not Confident; Not Comfortable; Strongly Disagree) and a 4 or 5 denoting the highest level of endorsement (e.g., Very Confident; Very Comfortable; Strongly Agree) depending on the number of response categories. These values were used to develop rating scale Rasch models for each trial (before/after) of the five Likert survey instruments, and include measurements of person ability, item difficulty, item fit, and item and person separation reliability. Values of person ability ranged from–6.21 to 9.95 logits (0.20% to 99.9% probability) depending on trial (before/after) and survey dimension (). Measures of item difficulty were calculated for pre-instruction responses, and then held constant as a means of anchoring to post-instruction responses, and ranged from–3.72 to 0.93 logits (2.36% to 71.7% probability) based on survey dimension (). Average item fit parameters (Boone Citation2020) were calculated and found to be in an acceptable range of 0.7 to 1.3 (Bond, Yan, and Heene Citation2020) for both trials of the five survey dimensions () with the exception of the post-instruction Python skills which over-fit the model. Reliability measures, including person- and item-separation reliability, were acceptable (> 0.50; Fisher Citation2007) for all five survey dimensions, pre- and post-instruction (), indicating that both items and persons can be reliably measured using these different assessment tools ().
Table 6 Measures of item (EAP) and person (WLE) reliability for the five dimensions assessed.
4.3 ANOVA/t-Testing/Effect Size
To examine the role that cohort (year of the program), trial (before/after) and survey dimension played in the variation of measured values of person ability, ANOVA was carried out using person ability as the dependent variable, with trial, survey dimension, and cohort added to the model as independent variables (i.e., Person Ability ∼ Trial + Dimension + Cohort). Results from ANOVA including effect sizes (partial eta squared []; Sink and Stroh Citation2006) are summarized in . No statistically significant differences in person ability were present when comparing students from different cohorts of the EDSC (F(2, 469) = 0.22, p = 0.81,
). Both trial (F(1, 469) = 324.75, p < 0.001,
) and survey dimension (F(4, 469) = 45.56, p < 0.001,
) contributed significantly to variation in values of person ability, with large effects (
) reported for each of these two factors. Post-hoc t-testing revealed significant growth in person ability from pre- to post-participation in the EDSC internship program across each of the five different survey dimensions () when participants from all three cohorts were taken on the aggregate. Large effect sizes (Cohen’s d > 0.8) were reported across four of the five survey dimensions, with science identity having a moderate effect (t = 3.32, d = 0.69). Looking at growth in participants’ level of endorsement for each of the five survey dimensions across all three years of the program, significant gains in person ability were observed in each case with the exception of science identity in years 1 and 3 (). These results are reported graphically in which displays growth for all EDSC participants’ ability across each of the five survey dimensions, and in which displays similar results faceted by cohort. Here, again, we see that of the five different survey dimensions, students’ self-perceived Python, and data science skills underwent the largest growth from pre- to post-participation in the EDSC across all three years of the program. Similar figures with values displayed on a percent probability scale have been included in the Appendix (Figures A1 and A2).
Fig. 7 Growth in measures of person ability (logits) for the five different dimensions across the two timepoints aggregated across all EDSC student participants (before and after participation in the EDSC program).
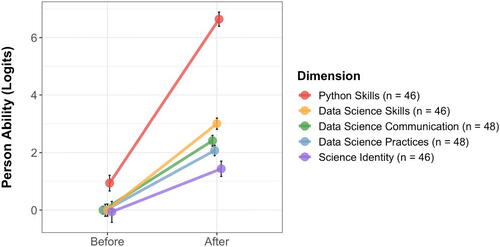
Fig. 8 Growth in measures of person ability (logits) for the five different dimensions across the two timepoints for each of the 3 cohorts of EDSC students (before and after participation in the EDSC program).
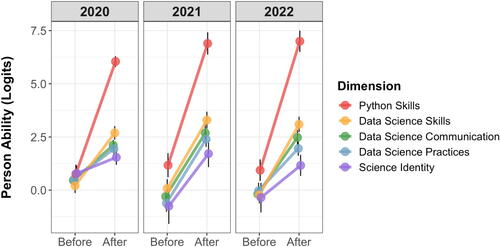
Table 7 Analysis of variance (ANOVA) table demonstrating how trial (before/after), survey dimension, and cohort (year of program) contribute to variation in measures of person ability.
Table 8 Results from post-hoc t-testing and corresponding effect size values aggregated across all EDSC student participants (Cohen’s d).
Table 9 Results from post-hoc t-testing for each of the five survey dimensions across each of the three cohorts of EDSC students.
5 Discussion
The core goal of the NSF-funded EDSC program was to provide training for students and faculty from communities that have been historically underrepresented in STEM through hands-on, project-based EDS training. Partnering with TCUs and HSIs, we helped participants develop comfort with different areas of EDS and self-identify as members of the EDS community. Over the course of 12 weeks in the summertime from 2020 to 2022, three cohorts of undergraduate interns (60 total) and faculty mentors (8 total) participated in virtual technical EDS training using Python, before going on to apply those skills to culturally relevant projects of their own design. This effort is situated within the larger objectives of the Harnessing the Data Revolution (HDR) Data Science Corps program, from one of the NSF’s 10 Big Ideas which aims to provide practical experiences, teach new skills, and offer learning opportunities, in a variety of settings, to data scientists and data science students.
We demonstrated significant shifts in EDS skills and self-identification as EDS scientists among the group of EDSC undergraduate interns, and we argue that both are critical for advancing learning and teaching data skills for students from underrepresented populations in STEM. Significant growth in participants’ self-reported comfort and confidence with different components of their data science toolkits included data science communication and data science practices, as well as their Python and data science skills as measured across all three cohorts of EDSC student participants (, ). Through the EDSC program, we demonstrated that our approach to online data science education resulted in substantial gains in self-reported comfort and confidence in different technical data science areas in a group of novice programmers from historically marginalized communities.
Despite limitations associated with the sudden shift to emergency online learning during the COVID-19 pandemic (Aguilera-Hermida Citation2020), we found that when an emphasis was placed on communication, accessibility, and community building, significant growth in participants’ self-reported technical and nontechnical data science skills, data science practices, and fostering of science identities was achieved in the online learning space. Our data shows that having consistent communication through multiple channels including Slack, Discourse, Zoom, and SpatialChat, making sure teaching and learning materials are open and accessible through our https://www.earthdatascience.org learning portal, and working toward building a community of learners are all critically important when working with beginner programmers, particularly those who may also lack internet bandwidth or consistent internet connectivity.
Overall, our results show that an approach to online data science education that relies on open and accessible educational resources, emphasizes collaborative team work environments, and empowers participants to take control of their own learning through team-designed applied projects, has the ability to significantly shift learners’ comfort and confidence with technical and nontechnical data science skills. Importantly, our approach to online teaching is adaptable to other domain-specific fields of data science, as well as data science education more broadly, and transferable to other disciplines beyond earth and environmental data science.
5.1 Program sustainability and scalability
The following aspects are key to program sustainability and scalability: (i) capacity building to teach and learn EDS at participating institutions, (ii) supporting EDSC alumni through the advanced internship program, (iii) a commitment to open science through the use of tools like Google Colab and publishing EDSC curricular materials on our free and open EDS learning platform (https://www.earthdatascience.org/), and (iv) emerging partnerships with nationally serving organizations focused on undergraduate education and STEM faculty development. Through professional development, participating EDSC faculty mentors developed EDS modules and curricular materials that they could use at their home institutions, to begin incorporating EDS, Python, and Jupyter Notebooks into their existing GIS, geography, and ecology courses. As faculty partners carry content and pedagogy learned through EDSC participation to their classrooms, they will continue teaching EDS skills to their students, sustaining and scaling the impact of this program.
The advanced internship component of the EDSC allowed alumni to return in years 2 and 3 of the program to develop peer mentoring experience, continue adding to their data science toolkits, and build their capacity to teach EDS content to others. Several EDSC alumni who took part in the advanced intern program have presented their work at professional conferences, sought out additional internship opportunities, matriculated into graduate degree programs focused on data analytics, and returned to their home institutions to teach data science courses. These and other EDSC alumni contribute to the foundation of the next generation of diverse earth and environmental data science practitioners, and they will help sustain the message and vision of the EDSC for many years to come.
We see our commitment to open, reproducible science through the use of tools like Google Colab and our online EDS learning platform (https://www.earthdatascience.org/) as a primary sustainability engine for the EDSC program. Free, cloud-based development platforms like Google Colab allow participants to get started coding right away without having to overcome challenging hurdles like installing Python environments on their local computers, and provide continued access to learning materials after the conclusion of the internship. Similarly, the resources contained within our online learning portal are free, licensed through Creative Commons Attribution ShareALike (https://www.earthdatascience.org/license/), accessed by millions of users each year, and are available for teachers and learners to modify and meet their own unique needs. Through our online learning portal, EDSC interns and faculty partners have unlimited access to the EDSC curriculum after completion of the internship, and are encouraged to use these resources in their classrooms and as reference materials as they continue adding to their EDS skill sets, and incorporating EDS modules into their teaching and research.
Lastly, partnerships that have emerged as a result of the EDSC with nationally recognized organizations focused on undergraduate education and faculty development are another mechanism that helps sustain and scale similar programs that are inspired by and modeled after the EDSC internship. One noteworthy example has been the formation of a STEM faculty working group at TCUs, spearheaded by collaboration with the American Indian Higher Education Consortium (AIHEC). The primary objectives of this working group include introducing EDS concepts to Indian Country by training faculty at TCUs to incorporate EDS in their STEM curriculum including the use of LiDAR and other remotely sensed data, facilitating partnerships with TCU faculty beyond those who participated in the EDSC, and empowering TCUs and local tribes to develop and maintain cloud-based data management workflows. EDSC also led to a partnership with the NSF-funded Macrosystems Ecology For All Research Coordination Network (MEFA), a spin-off of the Ecological Research as Education Network (EREN; Stack Whitney et al. Citation2022; Styers et al. Citation2021). Through this emerging partnership, we are creating a series of training opportunities, modeled after the faculty development component of the EDSC, specifically designed for undergraduate biology and environmental science faculty interested in incorporating EDS modules into their existing curriculum.
Efforts like those described above to build capacity, train the next generation of EDS educators, make curricular materials freely available, and develop partnerships with nationally serving organizations focused on faculty development help with program scalability and sustainability. However, internship programs that compensate students and instructors are reliant on funding sources. In order to fully harness the data revolution, and continue building diversity into the future of the EDS workforce, it is critical to continue offering such program opportunities. One example of these continued efforts is through a new national synthesis center, the Environmental Data Science Innovation and Inclusion Lab, ESIIL (Balch et al. Citation2023). This NSF-funded data synthesis center, hosted at the University of Colorado Boulder is built on four key pillars: i.) team science approaches and research in environmental data science, ii.) innovative tools and collaborative cyberinfrastructure, iii.) building inclusive partnerships and groups of earth and environmental data scientists, and iv.) data science education and training programs for a diverse and inclusive community. The ESIIL Stars program, modeled after the EDSC, is a five-month paid internship that partners with communities from underrepresented groups in STEM, and combines online data skills training, career development, an open textbook, and project based learning for undergraduates and faculty from MSIs. Through the ESIIL Stars program, we will continue to refine our approach to EDS education, and further develop partnerships that emerged out of the EDSC.
5.2 Future Directions
While this study paints a positive picture of one approach to learning and teaching EDS online, improvements in future work include incorporating survey instruments that do not rely on self-reporting, expanding the participants to a larger, more randomized group, and valuing important anecdotal stories around learning successes. For example, finding a more objective measure of Python proficiency or data science skills would improve our understanding of the impact our approach has on learners’ growth in these areas. While we have attempted to control for participants’ response shift bias through the use of a retrospective post-then-pre design (Marshall et al. Citation2007), there is potential for self-reporting response bias. Future work should develop objective measures to assess different components of learners’ technical and nontechnical data science skills. Further, there is also potential for a larger, randomly selected group of participants in order for these findings to be generalized to the larger population of data science learners. Also, anecdotal stories about the learning that took place are critical to capture. During the technical workshops, and particularly during group project work time, participants learned to grapple with large, messy, heterogeneous datasets, and deal with issues related to Indigenous Data Sovereignty. Participants also found innovative ways of making the data science tools and techniques that were developed as part of the EDSC work alongside the approaches to doing EDS that were already critical components of their data science toolkits, including using proprietary software and other programming languages not taught as part of the EDSC. These learning experiences are important for the EDSC story, and ones that we hope to continue to tell in research efforts going forward.
This study provides a successful model for the broader community of data science educators and researchers who are seeking ways to make their classrooms more accessible, looking for tools to assess data science learners’ comfort and confidence, and working on developing assessment and evaluation tools to better understand data science learning in other contexts. Through this work, we have demonstrated that the skills being taught in the EDSC framework can be blended to support relevant, culturally responsive, and meaningful project-based learning. What makes the EDSC unique is its purposeful approach to supporting smaller MSIs, including TCUs, to build capacity to learn and teach technical data science skills on their home campuses, a critical component of helping to create a more diverse STEM and data science workforce, and a mechanism for sustaining and scaling the teachings of the EDSC. While our research focuses on learning data science in the realm of solving applied EDS challenges, we see this approach as being applicable to STEM and data science educators on a broader scale. We developed this approach to be something that others can model and implement at their campuses, and we welcome conversations with groups who are interested in partnering with us as we work to harness the data revolution, and help build the next generation of earth and environmental data scientists.
IRB Statement
The surveys used to collect data for this manuscript were reviewed and approved by the IRB committee at the University of Colorado–Boulder (20-0254) in accordance with federal regulation and the Belmont Report principles. Consent was obtained from all study participants as required in our IRB-approved protocol.
supplementary_materials_for_review.zip
Download Zip (987 KB)Supplementary Materials
Supplemental materials include: Survey instrument items; findings from Rasch measurement plotted on a percent probability scale.
Disclosure Statement
No potential conflict of interest was reported by the author(s).
Data Availability Statement
Data and code used to do analysis for this work have been deidentified and are currently stored in a public Zenodo repository (https://doi.org/10.5281/zenodo.10092423).
Additional information
Funding
References
- Abbakumov, D., Desmet, P., and Van den Noortgate, W. (2020), “Rasch Model Extensions for Enhanced Formative Assessments in MOOCs,” Applied Measurement in Education, 33, 113–123. DOI: 10.1080/08957347.2020.1732382.
- Aguilera-Hermida, A. P. (2020), “College Students’ Use and Acceptance of Emergency Online Learning Due to COVID-19,” International Journal of Educational Research Open, 1, 100011. DOI: 10.1016/j.ijedro.2020.100011.
- Ahern-Dodson, J., Clark, C. R., Mourad, T., and Reynolds, J. A. (2020), “Beyond the Numbers: Understanding How a Diversity Mentoring Program Welcomes Students into a Scientific Community,” Ecosphere, 11, e03025. DOI: 10.1002/ecs2.3025.
- Andrich, D. (1978), “A Rating Formulation for Ordered Response Categories,” Psychometrika, 43, 561–573. DOI: 10.1007/BF02293814.
- Balch, J. K., Nagy, R. C., Hummel Du Amaral, C., Culler, E., Gold, A., Iglesias, V., Monteleoni, C., Parker, J., Rattling Leaf, J., Stavros, N., Sullivan, S., Swetnam, T. L., Tuff, T., and Quarderer, N. (2023), “COS 208-5 - The Environmental Data Science Innovation & Inclusion Lab (ESIIL): A Next-Generation NSF Data Synthesis Center (Version 1),” figshare. DOI: 10.6084/m9.figshare.24263068.v1.
- Bandura, A. (1986), Social Foundations of Thought and Action, pp. 23–28, Englewood Cliffs, NJ: Prentice-Hall, Inc.
- Bawadi, H., Shami, R., El-Awaisi, A., Al-Moslih, A., Abdul Rahim, H., Du, X., Moawad, J., and Al-Jayyousi, G. F. (2023), “Exploring the Challenges of Virtual Internships during the COVID-19 Pandemic and Their Potential Influence on the Professional Identity of Health Professions Students: A View from Qatar University,” Frontiers in Medicine, 10, 1107693. DOI: 10.3389/fmed.2023.1107693.
- Bond, T. G., Yan, Z., and Heene, M. (2020), Applying the Rasch Model: Fundamental Measurement in the Human Sciences (4th ed.), New York: Routledge. DOI: 10.4324/9780429030499.
- Boone, W. J. (2020), “Rasch Basics for the Novice,” in Rasch Measurement, ed. M. S. Khine, pp. 9–30, Singapore: Springer.
- Boone, W. J., Staver, J. R., and Yale, M. S. (2013), Rasch Analysis in the Human Sciences, Dordrecht: Springer.
- Caballero, M. D., Chonacky, N., Engelhardt, L., Hilborn, R. C., del Puerto, M. L., and Roos, K. R. (2019), “PICUP: A Community of Teachers Integrating Computation into Undergraduate Physics Courses,” The Physics Teacher, 57, 397–399. DOI: 10.1119/1.5124281.
- Cartwright, T. J., and Atwood, J. (2014), “Elementary Pre-Service Teachers’ Response-Shift Bias: Self-Efficacy and Attitudes toward Science,” International Journal of Science Education, 36, 2421–2437. DOI: 10.1080/09500693.2014.925152.
- Caswell, T. A., Lee, A., Droettboom, M., de Andrade, E. S., Hoffmann, T., Klymak, J., and Kniazev, N. (2022), matplotlib/matplotlib: REL: v3.6.0rc2 (Eκδoχ v3.6.0rc2). DOI: 10.5281/zenodo.7032953.
- Chemers, M. M., Zurbriggen, E. L., Syed, M., Goza, B. K., and Bearman, S. (2011), “The Role of Efficacy and Identity in Science Career Commitment among Underrepresented Minority Students,” Journal of Social Issues, 67, 469–491. DOI: 10.1111/j.1540-4560.2011.01710.x.
- COMPASS Science Communication. (2023), available at https://www.compassscicomm.org/leadership-development/the-message-box/ Accessed Sept. 18, 2023.
- Discourse. (2022), “Discourse Community Forum,” available at https://www.discourse.org/
- Dortch, D., and Patel, C. (2017), “Black Undergraduate Women and Their Sense of Belonging in STEM at Predominantly White Institutions,” NASPA Journal about Women in Higher Education, 10, 202–215. DOI: 10.1080/19407882.2017.1331854.
- Drennan, J., and Hyde, A. (2008), “Controlling Response Shift Bias: The Use of the Retrospective Pre-Test Design in the Evaluation of a Master’s Programme,” Assessment & Evaluation in Higher Education, 33, 699–709. DOI: 10.1080/02602930701773026.
- Emery, N. C., Crispo, E., Supp, S. R., Farrell, K. J., Kerkhoff, A. J., Bledsoe, E. K., O’Donnell, K. L., McCall, A. C., and Aiello-Lammens, M. E. (2021), “Data Science in Undergraduate Life Science Education: A Need For Instructor Skills Training,” BioScience, 71, 1274–1287. DOI: 10.1093/biosci/biab107.
- Fayram, J., Boswood, N., Kan, Q., Motzo, A., and Proudfoot, A. (2018), “Investigating the Benefits of Online Peer Mentoring for Student Confidence and Motivation,” International Journal of Mentoring and Coaching in Education, 7, 312–328. DOI: 10.1108/IJMCE-10-2017-0065.
- Fisher, W. P. (2007), “Rating Scale Instrument Quality Criteria,” Rasch Measurement Transaction, 21, 1095.
- Fletcher Jr, E. C., Minar, N. J., and Rice, B. A. (2023), “The Future Ready Lab: Maintaining Students’ Access to Internships during Times of Crisis,” Education and Urban Society, 55, 577–592. DOI: 10.1177/00131245211065413.
- GeoPandas contributors. (2023), geopandas/geopandas: v0.13.2 (v0.13.2). Zenodo. DOI: 10.5281/zenodo.8009629.
- Gibert, K., Horsburgh, J. S., Athanasiadis, I. N., and Holmes, G. (2018), “Environmental Data Science,” Environmental Modelling & Software, 106, 4–12. DOI: 10.1016/j.envsoft.2018.04.005.
- Gillett-Swan, J. (2017), “The Challenges of Online Learning: Supporting and Engaging the Isolated Learner,” Journal of Learning Design, 10, 20–30. DOI: 10.5204/jld.v9i3.293.
- Google. (2022), “Welcome to Colaboratory,” available at https://colab.research.google.com/ Retrieved September 6, 2022.
- Gulatee, Y., and Combes, B. (2008), “Identifying Social Barriers in Teaching Computer Science Topics in a Wholly Online Environment,” in Science Mathematics and Technology Education: Beyond Cultural Boundaries, eds. D. Fisher, R. Koul, and S. Wanpen, p. 173–182. Perth: Curtin University of Technology.
- Hampton, S. E., Jones, M. B., Wasser, L. A., Schildhauer, M. P., Supp, S. R., Brun, J., Hernandez, R. R., Boettiger, C., Collins, S. L., Gross, L. J., Fernández, D. S., Budden, A., White, E. P., Teal, T. K., Labou, S. G., and Aukema, J. E. (2017), “Skills and Knowledge for Data-Intensive Environmental Research,” Bioscience, 67, 546–557. DOI: 10.1093/biosci/bix025.
- Henke, N., Bughin, J., Chui, M., Manyika, J., Saleh, T., Wiseman, B., and Sethupathy, G. (2016), “The Age of Analytics: Competing in a Data-Driven World,” McKinsey Global Institute, 4, 136.
- Iglesias, V., Braswell, A. E., Rossi, M. W., Joseph, M. B., McShane, C., Cattau, M., Koontz, M. J., McGlinchy, J., Nagy, R. C., Balch, J., Leyk, S., and Travis, W. R. (2021), “Risky Development: Increasing Exposure to Natural Hazards in the United States,” Earth’s Future, 9, e2020EF001795. DOI: 10.1029/2020EF001795.
- Jupyter (2022), Retrieved September 7, 2022, from https://jupyter.org/hub
- Kim, B., and Henke, G. (2021), “Easy-to-Use Cloud Computing for Teaching Data Science,” Journal of Statistics and Data Science Education, 29, S103–S111. DOI: 10.1080/10691898.2020.1860726.
- Kluyver, T., Ragan-Kelley, B., Pérez, F., Granger, B. E., Bussonnier, M., Frederic, J., and Willing, C. (2016), “Jupyter Notebooks - A Publishing Format for Reproducible Computational Workflows,” Elpub, 2016, 87–90.
- Lam, T. C., and Bengo, P. (2003), “A Comparison of Three Retrospective Self-Reporting Methods of Measuring Change in Instructional Practice,” American Journal of Evaluation, 24, 65–80. DOI: 10.1016/S1098-2140(02)00273-4.
- Lim, J. H., MacLeod, B. P., Tkacik, P. T., and Dika, S. L. (2017), “Peer Mentoring in Engineering: (Un)Shared Experience of Undergraduate Peer Mentors and Mentees,” Mentoring & Tutoring: Partnership in Learning, 25, 395–416. DOI: 10.1080/13611267.2017.1403628.
- Manyika, J., Chui, M., Madgavkar, A., and Lund, S. (2017), “Technology, Jobs and the Future of Work,” McKinsey Insights.
- Marshall, J. P., Higginbotham, B. J., Harris, V. W., and Lee, T. R. (2007), “Assessing Program Outcomes: Rationale and Benefits of Posttest-Then-Retrospective-Pretest Designs,” Journal of Youth Development, 2, 118–123. DOI: 10.5195/jyd.2007.366.
- Martin, F., Shanley, N. E., Hite, N., Pérez-Quiñones, M. A., Ahlgrim-Delzel, L., Pugalee, D., and Hart, E. (2021), “High School Teachers Teaching Programming Online: Instructional Strategies Used and Challenges Faced,” RPP for CS ’21, October 19–20, 2021, Virtual.
- McKinney, W. (2011), “Pandas: A Foundational Python Library for Data Analysis and Statistics,” Python for High Performance and Scientific Computing, 14, 1–9.
- Monteleoni, C., Schmidt, G. A., and McQuade, S. (2013), “Climate Informatics: Accelerating Discovering in Climate Science with Machine Learning,” Computing in Science & Engineering, 15, 32–40. DOI: 10.1109/MCSE.2013.50.
- Nolan, D., and Temple Lang, D. (2015), “Explorations in Statistics Research: An Approach to Expose Undergraduates to Authentic Data Analysis,” The American Statistician, 69, 292–299. DOI: 10.1080/00031305.2015.1073624.
- Palomino, J., and Wasser, L. (2021), “earthlab/earth-analytics-bootcamp-course: Bootcamp course 2.0 (2.0),” Zenodo. DOI: 10.5281/zenodo.5418486.
- Palomino, J., Wasser, L., and Joseph, M. (2021), “earthlab/earth-analytics-intro-to-earth-data-science-textbook: Earth Analytics Updated Version of the Intro Textbook (1.5),” Zenodo. DOI: 10.5281/zenodo.4686073.
- Pandas Development Team (2022), “pandas-dev/pandas: Pandas (Eκδoχ v1.5.0rc0),” DOI: 10.5281/zenodo.7018966.
- Pennington, D., Ebert-Uphoff, I., Freed, N., Martin, J., and Pierce, S. A. (2020), “Bridging Sustainability Science, Earth Science, and Data Science through Interdisciplinary Education,” Sustainability Science, 15, 647–661. DOI: 10.1007/s11625-019-00735-3.
- Pratt, C. C., McGuigan, W. M., and Katzev, A. R. (2000), “Measuring Program Outcomes: Using Retrospective Pretest Methodology,” American Journal of Evaluation, 21, 341–349. DOI: 10.1177/109821400002100305.
- Quarderer, N., Halama, K., Post, A. K., Hummel Du Amaral, C., Culler, E., Nagy, R. C., Tuff, T., Sanovia, J., Balch, J., Rattling Leaf, J., Gold, A., Swetnam, T. L., Monteleoni, C., Parker, J., Sullivan, S., and Iglesias, V. (2023), “Creating Inclusive Spaces for Earth and Environmental Data Science Education (Version 2),” figshare. DOI: 10.6084/m9.figshare.23990001.v2.
- R Core Team (2021), “R: A Language and Environment for Statistical Computing,” available at https://www.R-project.org/
- Rainey, K., Dancy, M., Mickelson, R., Stearns, E., and Moller, S. (2018), “Race and Gender Differences in How Sense of Belonging Influences Decisions to Major in STEM,” International Journal of STEM Education, 5, 10. DOI: 10.1186/s40594-018-0115-6.
- Rasch, G. (1960), Studies in Mathematical Psychology: I. Probabilistic Models for Some Intelligence and Attainment Tests. Copenhagen: Danish Institute for Educational Research.
- rioxarray contributors. (2023), “rioxarray: 0.15.0 Release (0.15.0),” Zenodo. DOI: 10.5281/zenodo.8247542.
- Robitzsch, A., Kiefer, T., and Wu, M. (2018), “TAM: Test Analysis Modules,” R package version 3.0-21. Available at https://CRAN.R-project.org/package=TAM.
- Robnett, R. D., Chemers, M. M., and Zurbriggen, E. L. (2015), “Longitudinal Associations among Undergraduates’ Research Experience, Self Efficacy, and Identity,” Journal of Research in Science Teaching, 52, 847–867. DOI: 10.1002/tea.21221.
- Rodriguez, S. L., and Blaney, J. M. (2021), “We’re the Unicorns in STEM”: Understanding How Academic and Social Experiences Influence a Sense of Belonging for Latina Undergraduate Students,” Journal of Diversity in Higher Education, 14, 441–455. DOI: 10.1037/dhe0000176.
- Saltz, J., and Heckman, R. (2020), “Using Structured Pair Activities in a Distributed Online Breakout Room,” Online Learning, 24, 227–244. DOI: 10.24059/olj.v24i1.1632.
- Sink, C. A., and Stroh, H. R. (2006), “Practical Significance: The Use of Effect Sizes in School Counseling Research,” Professional School Counseling, 9, 401–411. http://www.jstor.org/stable/42732713 DOI: 10.5330/prsc.9.4.283746k664204023.
- Slack. (2022), “Slack,” available at https://www.slack.com
- Snow, A. D., Brochart, D., Chegini, T., Hoese, D., Hamman, J., RichardScott, O. Z., and Pmallas. (2021), “corteva/rioxarray: 0.3.1 Release (Eκδoχ 0.3.1),” DOI: 10.5281/zenodo.4570457.
- Snyder, J. (2019), “Data Cleansing: An Omission from Data Analytics Coursework,” Information Systems Education Journal, 17, 22. https://isedj.org/2019-17/n6/ISEDJv17n6p22.html
- SpatialChat. (2022), SpatialChat [Software]. Available at https://www.spatial.chat/
- Stack Whitney, K., Heard, M. J., Anderson, L. J., Cooke, S., Garneau, D., Kilgore, J., Kolozsvary, M. B., Kuers, K., Lunch, C. K., McCay, T. S., and Parker, A. T. (2022), “Flexible and Inclusive Ecology Projects That Harness Collaboration and NEON-Enabled Science to Enhance Student Learning,” The Bulletin of the Ecological Society of America, 103, e01963. DOI: 10.1002/bes2.1963.
- Styers, D. M., Schafer, J. L., Kolozsvary, M. B., Brubaker, K. M., Scanga, S. E., Anderson, L. J., Mitchell, J. J., and Barnett, D. (2021), “Developing a Flexible Learning Activity on Biodiversity and Spatial Scale Concepts Using Open-Access Vegetation Datasets from the National Ecological Observatory Network,” Ecology and Evolution, 11, 3660–3671. DOI: 10.1002/ece3.7385.
- Tan, K. S., Elkin, E. B., and Satagopan, J. M. (2022), “A Model for an Undergraduate Research Experience Program in Quantitative Sciences,” Journal of Statistics and Data Science Education, 30, 65–74. DOI: 10.1080/26939169.2021.2016036.
- Tang, R., and Sae-Lim, W. (2016), “Data Science Programs in US Higher Education: An Exploratory Content Analysis of Program Description, Curriculum Structure, and Course Focus,” Education for Information, 32, 269–290. DOI: 10.3233/EFI-160977.
- Teal, T. K., Cranston, K. A., Lapp, H., White, E., Wilson, G., Ram, K., and Pawlik, A. (2015), “Data Carpentry: Workshops to Increase Data Literacy for Researchers,” International Journal of Digital Curation 10, 135–143. DOI: 10.2218/ijdc.v10i1.351.
- Wasser, L. A., Herwehe, L., and Palomino, J. (2019a), “Democratizing Access to Earth Data Science Skills Using Blended Online and in-Person Approaches and Open Education,” in AGU Fall Meeting Abstracts (Vol. 2019), ED13D-0905.
- Wasser, L., Joseph, M. B., McGlinchy, J., Palomino, J., Korinek, N., Holdgraf, C., and Head, T. (2019b), “EarthPy: A Python Package That Makes It Easier to Explore and Plot Raster and Vector Data Using Open Source Python Tools,” Journal of Open Source Software, 4, 1886. DOI: 10.21105/joss.01886.
- Wasser, L., Palomino, J., Herwehe, L., Quarderer, N., McGlinchy, J., Balch, J., and Joseph, M. B. (2022), “Student-Directed Learning in the Open Earth & Environmental Data Science Classroom,” Open Science Framework. DOI: 10.31219/osf.io/xdj4z.
- Wright, B. D., and Stone, M. H. (1979), “Best Test Design.”
- Zaniewski, A. M., and Reinholz, D. (2016), “Increasing STEM Success: A near-Peer Mentoring Program in the Physical Sciences,” International Journal of STEM Education, 3, 1–12. DOI: 10.1186/s40594-016-0043-2.
- Zoom Video Communications. (2020), Zoom. [Software]. Available at https://zoom.us