Abstract
Quantitative Data Analytics (QDA) is a critical skill for professionals across various natural science disciplines. However, college curricula, especially at small colleges, often lag behind the evolving workforce’s needs due to limited faculty resources. Despite abundant training materials, there is a noticeable gap in practical frameworks for effectively developing and implementing QDA training programs, particularly addressing existing curriculum gaps and resource constraints. This study presents a practical framework for developing introductory QDA training programs tailored for non-statistical majors at resource-constrained small colleges with various educational settings. Employing a design science strategy, we developed a modular co-curricular QDA Training Program (CQDATP), consisting of five training modules refined over three iterative phases. This flexible design integrates seamlessly with existing courses or can function as standalone workshops, bolstering students’ preparedness for advanced courses and research opportunities. Our program evaluation indicates that our approach significantly enhanced students’ QDA capabilities without necessitating extensive curriculum overhauls. By focusing on adaptability and resource efficiency, our framework holds the potential to benefit educators, curriculum developers, and administrators at small colleges, ensuring that graduates are well-prepared for data-driven industries, even when resources are limited.
Disclaimer
As a service to authors and researchers we are providing this version of an accepted manuscript (AM). Copyediting, typesetting, and review of the resulting proofs will be undertaken on this manuscript before final publication of the Version of Record (VoR). During production and pre-press, errors may be discovered which could affect the content, and all legal disclaimers that apply to the journal relate to these versions also.1. Introduction
Increasing proficiency in basic Quantitative Data Analytics (QDA) skills is a growing priority for enhancing statistical thinking among college students (Carver et al., 2016). This is especially important in the fields of natural and health sciences that have seen a surge in data-intensive research and evidence-based healthcare practices (Banerjee et al., 2020; Satam et al., 2023). Large-scale data such as human genomes often consist of billions of variables and necessitates enhanced skills in data acquisition, processing, and computational analysis. These skills extend far beyond what is traditionally taught in introductory natural science curricula.
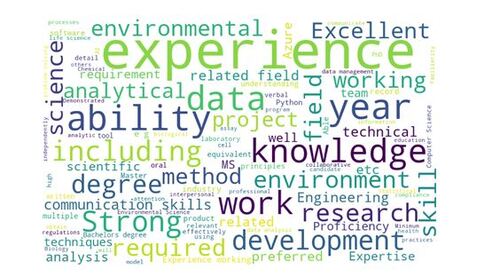
An unfamiliarity with or deficient QDA skills can hinder students’ science education, degree completion, and potential future employment (Speth et al., 2010). Many such students struggle with quantitative assignments in advanced courses (Feser, Vasaly, and Herrera 2013; Magana et al. 2014), and may feel intimidated by high-level quantitative bioscience classes (Saucerman and Vasquez 2014). This skill gap also impacts inquiry-based learning, a key component of natural science education (Wilke and Straits 2005; Crippen and Archambault 2012). In the current job market, there is a clear demand for QDA skills among natural science graduates. We analyzed 98 job postings related to natural science graduates on Indeed.com in December 2023, finding that 78% of the postings mentioned data analytics skills. We extracted the required and desired qualifications from these job postings, and Figure 8 in Appendix A presents the resulting word cloud. Notably, “data” and “analytical” prominently feature as standout words in the skill descriptions. Therefore, the integration of QDA training into natural science curricula has been advocated by researchers (Speth et al., 2010; Porter and Smith, 2019), with initiatives such as undergraduate courses focusing on biostatistical analysis (Del Toro et al., 2022) and embedding graphing skills in biology education (Gardner et al., 2022).
Despite the growing availability of QDA training platforms, incorporating effective QDA education into a traditional college curriculum remains challenging. These difficulties stem from limited resources, constrained time, and a lack of specialized pedagogical knowledge (Emery et al. 2021; Schwab-McCoy et al., 2021). Natural science faculty may not be familiar with QDA tools or may not fully recognize their significance in students’ success (Emery et al. 2021). Statistics faculty often encounter obstacles when teaching computational QDA skills to a diverse student body and may not prioritize customizing these teachings for natural science disciplines (Schwab-McCoy et al., 2021). Small colleges may face additional challenges, as budget limitations often prevent administrators from hiring new data science specialists or introducing new data science courses. Effectively integrating QDA skills across various courses also presents difficulties, requiring both faculty buy-in and a coordinated effort among faculty members (Çetinkaya-Rundel and Ellison, 2021).
In this study, we utilized a design science strategy to develop a co-curricular QDA training program (CQDATP) for non-statistical students that can specifically address existing curriculum gaps and limited faculty resources. Problem-based training materials with biology-specific examples were created based on the following advantages: co-curricular training allows for easy implementation without curriculum changes and flexible scheduling (Estrada, 2014; Henley and Roberts, 2016); and problem-based training, using subject-specific examples, has been shown to be effective in various programs (Gardner and Belland, 2017; Bennie and Erickson, 2023). Our program was developed and refined through three iterative phases over two semesters. The resultant CQDATP consists of a series of practical training modules, each dedicated to a particular QDA skill and defined by explicit learning goals. The effectiveness of the training approach was assessed based on whether participants reached benchmarks of learning outcomes and student feedback. Our results showed that the CQDATP effectively improved students’ QDA skills in the context of our resource constraints.
Throughout our iterative process, we identified key features (framework) essential for the successful development and implementation of training programs. These features, as well as the materials developed for trainingFootnote1, can assist colleagues from other institutions with similar challenges in adopting and/or developing related programs. In comparison to existing alternatives, our program offers significant advantages, particularly for small colleges with limited resources. It enables them to enrich their curriculum without the need for additional faculty. Furthermore, the CQDATP was tailored to meet the specific needs of biological science students, utilizing domain-specific datasets, and focusing on the most relevant QDA skills in this field. Moreover, the CQDATP shows promise for other disciplines looking to implement a similar program.
2. Study Rationale
At our institution, the natural science major requires only one statistics course. However, this course mainly focuses on the theoretical basis of statistical analysis. A key limitation of this class is that it was designed to serve all majors universally and does not focus on the computational data analytical skill development that is crucial for specific fields. A group of faculty members have observed a notable lack of QDA skills while teaching upper-level natural science courses. Despite students completing the above-mentioned statistics course by their junior year, a significant portion of students struggled with fundamental data analytics tasks, such as structuring data in formats such as csv, graphing, and conducting simple regression analysis. This disparity highlights the disconnect between the theoretical concepts taught in statistics courses and the practical application of the QDA skills. In response to this concern, we first explored the possibility of adopting existing training materials and programs, including BioQUEST (Jungck, 2001), MathBench Biology Modules (Thompson et al., 2010), and online courses offered by platforms such as Udacity and Coursera. While these programs offer an enriched learning environment, we realized that these resources cannot be easily adopted to our institution. A primary issue was the limited faculty availability to teach these courses, coupled with the complexities of enacting significant curricular revisions. Individual faculty members often struggle to integrate additional training into their existing workload. Coordination, planning, and achieving departmental consensus are inherently time-consuming, further slowing the process. Instructors, particularly those unfamiliar with computational data analytics, require significant time to assimilate and effectively teach new content. Additionally, budgetary limitations and constraints on faculty hiring severely restrict our ability to swiftly implement and support new programs. Additionally, some of the available training materials focused on non-biological data, hindering the integration of statistical education with “real data with a context and a purpose” as recommended by the Guidelines for Assessment and Instruction for Statistical Education (GAISE) College Report (Carver et al., 2016).
Thus, we have recognized the need to develop our own program tailored to the specific skill gaps and resource limitations at our institution. We also aimed to discover and define a framework that extends beyond creating individual training sessions, ensuring long-term and wide adaptability. Through our iterative assessment process, we identified three key elements in a successful practical framework that would need to be refined over time: 1) content planning (e.g., identifying skill gaps, developing training content), 2) delivery planning (e.g., training session scheduling, selecting instructors), and 3) creating assessment tools and teaching notes. Further details can be found in later sections.
The training program (CQDATP) features recommendations outlined in the GAISE College Report (Carver et al., 2016), which specifically emphasizes the preparation of students to “become critical consumers of statistically-based results”. Our training session does not merely focus on developing computational skills but includes discussion on data types, errors, ethics, and interpretation. The report also promotes the use of technology and fosters multivariate thinking with real data. Our program is tailored to natural science students, employing subject-specific complex datasets, and focusing on pertinent computational QDA skills. Furthermore, the modular structure of our CQDATP was chosen because of its inherent scalability, benefiting both instructors and students in diverse educational settings. Instructors have the flexibility to integrate modules into classroom activities or assignments and to use them in workshops, thus preparing students for upcoming courses or research activities. As recommended by reviewers, we compared our program with existing programs such as Macalester’s program (Macalester, n.d.) and online courses. A summary of our program, highlighting distinguishing features from previously published works, is shown in Table 1.
3. Method
3.1. Study Process
Design-based research strategy focuses on the creation and testing of an intervention within an ongoing educational setting (Bell 2004; Collins, Joseph, and Bielaczyc 2016). Following this strategy, we developed, tested, and improved our training materials and framework through three iterations. A few key elements for successful program development were identified (Table 2). Improvements and adjustments for both program and framework were made based on the following research questions that have been raised and addressed after each iteration:
RQ1: Does the CQDATP enhance the QDA skills of natural science students?
RQ2: What are participants’ perceptions of the CQDATP?
RQ3: Can instructors easily be trained to deliver training sessions effectively?
Table 2 displays the iterative research process of developing the framework, considering aspects such as content planning, delivery planning, and training tools. For each phase, we considered factors such as the current skill gap, faculty availability, and Teaching Assistant (TA) resources. In the initial phase, Module Excel was introduced to examine our first research question (RQ1). In Module Excel, topics such as data type identification, basic descriptive statistics, linear regression, and Excel-based graphing are introduced. This phase involved eighteen undergraduate students in an upper-level course. In Phase 2, we additionally offered Module R, focusing on fundamental topics in R. In this phase, the original eighteen students from Phase 1 along with an additional twenty volunteer students participated. Assessment in Phase 2 involved the analysis of student performance data and questionnaire responses, addressing both RQ1 and RQ2. Phase 3 marked an expansion of the training program, introducing three additional modules: Module T-Test, Module Chi-Square, and Module PCA, as detailed in Section 3.2. Building on feedback from earlier phases, a more flexible schedule for training sessions was introduced, offering five sessions of each module throughout a week as standalone workshops. Participants in this phase completed five training modules within a single semester. Data collected in Phase 3 included not only students’ questionnaire responses and performance data but also feedback from the instructors who conducted the training, addressing RQ3. Overall, the iterative development process enabled the refinement of the CQDATP framework through empirical evidence and participant feedback. The study has been reviewed and approved by the Institutional Review Board of Indiana University under protocol number 1804101673.
3.2. Training Modules
In the course of our program development, we have meticulously designed five training modules with hands-on exercises, each focused on imparting specific computational QDA skills. These modules were selected based on their relevance and utility in the natural science professions. The topics covered in these modules are detailed in Table 3, which provides an overview of the subjects, prerequisites, and learning objectives. To identify the most critical QDA tools and concepts that are not adequately addressed in existing courses, we collected feedback from faculty, especially those who teach upper-level courses to address skill gaps in the current curriculum.
Our modular design emphasizes self-contained units, enabling students to advance from data comprehension and modeling to generating and interpreting graphical results within each module. This approach ensures that students can fully experience the entire data analytics process for each analytic type upon completion of the corresponding module. However, when prior knowledge is necessary, a pre-requisite or recommended module is clearly listed to aid students’ planning.
The initial modules, Module Excel and Module R, serve as fundamental modules that acquaint students with foundational data science concepts and computational analysis using widely used software, such as Microsoft Excel and R. In Module Excel, in addition to identifying different data types and understanding basic statistical approaches and terminology, students conduct simple linear regression analysis in Excel. Linear regression is a commonly used technique in natural science. The students’ use of linear regression serves as a way to demonstrate to them the connection between conceptual understanding and modeling with a practical tool. The training heavily involves the discussion of validity and interpretation of the results (e.g., variance of data; equation of the fit line). In Module R, the basics of the R programming language, including dataset import/export, exploratory data analysis, summary functionality, and data quality analysis, are introduced. Other advanced modules (Module T-Test, Module Chi-Square, and Module PCA) build upon these foundations to delve into more complex topics such as hypothesis testing, t-tests, chi-square analysis, and principal component analysis (PCA), all of which are essential for understanding data presented in higher-level natural science courses.
These advanced topics, which promote multivariate thinking, follow the recommendations outlined in the GAISE College Report (Carver et al., 2016). For instance, Module PCA introduces students to Principal Component Analysis, a technique particularly valuable for handling complex datasets, such as population genomics datasets. Practical applications of PCA involve working with real datasets, such as a collection of 6,000 single nucleotide polymorphisms (SNPs) or gene expression levels of thousands of genes from over one hundred human subjects, a common approach in genetic studies. This hands-on experience allows students to effectively analyze and comprehend intricate, high-dimensional data, preparing them for advanced research endeavors.
Each module comprises several main components: (1) learning objectives, (2) step-by-step tutorials that provide comprehensive guidance for QDA using sample datasets from the natural science domain, and (3) pre- and post-quiz that assess participants' ability to apply QDA skills to analyze a dataset. The sample datasets closely resemble those frequently analyzed in the natural science fields. This enables students to better understand and interpret research articles they would read for upper-level courses. In developing these training modules, we intentionally designed training materials and instructor aids to facilitate easy adoption by faculty with diverse backgrounds. The structured module format, consisting of learning objectives, tutorials, and pre-and post-quizzes, ensures uniformity across all modules, creating a consistent and effective learning experience for students. Figure 1 provides examples of step-by-step instructions from Module R, illustrating the clarity and comprehensiveness of our instructional materials.
3.3. Training Delivery
In our study, we adopted an in-person training delivery format based on the findings of Estrada (2014), who emphasized the positive impact of a relational learning environment on students’ sense of community, engagement, and persistence in STEM fields. Each training module is designed to be completed within 75 minutes, whether it is delivered as a class assignment or a stand-alone workshop. This duration was selected to enable easy integration as an in-class exercise by future instructors, given that most classes at our institution are 75 minutes long.
The standard delivery of a module follows a structured format, consisting of several key components. Each session begins with a brief pre-training survey to assess students’ prior knowledge. The learning objectives are then presented to provide students with clear expectations for the session. An instructor leads a 20-minute presentation that covers the dataset and background for the specific QDA skills. This presentation includes discussions on the limitations of each analysis, required sample sizes, and statistical distributions, such as the normal distribution. Additionally, it addresses sources of uncertainty and provides guidance on visually representing uncertainty in data and statistical models, presenting how to effectively convey uncertainty through graphical representations when applicable. Following the presentation, participants complete a 25-minute hands-on activity at their own pace while instructors provide technical help, as requested by each participant. This interactive segment allows students to apply the newly introduced concepts and skills in a practical context. To conclude the training, students are given an exit quiz that typically requires approximately 30 minutes to complete. This assessment evaluates students’ understanding of the material covered in the module.
To investigate the adaptability and effectiveness of our modules in terms of instructor delivery (RQ3), modules were delivered by multiple instructors with differing backgrounds and levels of subject expertise, and the assessment results were compared. In the initial phases (Phases 1 and 2), the modules were delivered by an instructor who developed them. In Phase 3, we recruited three college senior students majoring in Informatics to act as instructors. As seniors, they have completed the required mathematical and statistical courses in their degree program, including a course on statistical techniques. This course covers topics such as elementary probability theory, random variables, statistical distributions, and key concepts in statistical inference (e.g. estimation and hypothesis testing). We chose students who majored in Informatics because of their familiarity with programming. Although they may not have specific experience with R, their programming background enables them to quickly learn R and effectively assist with troubleshooting. To ensure the quality and effectiveness of their teaching, we provided them with well-prepared, detailed lecture slides and teaching materials, serving both as a guide and a reliable information source. To further support them, we conducted thorough run-throughs of the modules with them before delivery. We focused on ensuring that student instructors had a solid grasp of the training material and could facilitate the module effectively, especially in troubleshooting technical issues, which was a vital part of their role.
3.4. Participants
A total of 61 undergraduate natural science students from a regional four-year college in Indiana, U.S. participated in our study, as detailed in Table 4. Upper-level students (5 juniors and 13 seniors) participated in Phase 1 as the module was incorporated into the Biochemistry I course. For Phase 2, Module R was offered to the same Biochemistry I students as a lab exercise. We also offered both Module Excel and R to twenty volunteer students, ranging from first-year students to seniors, thereby broadening the scope of our study to include more diverse academic backgrounds. In Phase 3, all participants were a new group of volunteer students who registered to complete all five modules within a single semester. We offered five sessions per week for each module. This approach allowed us to enroll more sophomores (57%) who were on the cusp of enrolling in upper-level courses and needed to acquire QDA skills. While the majority of participants (n = 23) were majoring in biology, biochemistry, and biological and physical sciences, a small portion of participants came from diverse fields such as informatics, international public health, and neuroscience. This diversity in participant backgrounds reflects the interdisciplinary appeal and relevance of our training modules.
3.5. Data Collection
To assess participant performance, we created a list of benchmarks for each module based on the learning objectives outlined in Table 3. The benchmarks for Module Excel and Module R are shown in Table 5. The Association of American Colleges and Universities’ Quantitative Literacy VALUE (Valid Assessment in Undergraduate Education) Rubric (Rhodes 2010) was used to assess the competency. The rubric includes six competency areas: interpretation, representation, calculation, application/analysis, assumption, and communication, to score participants’ mastery of QDA skills.
For each phase, the improvement of participants’ mastery of QDA skills was used as a metric to assess the effectiveness of the training. Participants’ mastery of QDA skills was measured by comparing the results of the pre- and post-quizzes, as well as laboratory report grades, when applicable. In Phase 1, the effectiveness of the first module (Module Excel) was assessed with pre-training test results and post-training results measured by a rubric-based grading of the lab reports. Additionally, two months after the training session, we re-tested the same group of participants to evaluate the long-term retention of situational knowledge. In Phase 2, we evaluated the learning outcomes of Module R using benchmark-based exit quizzes. We also collected participants’ feedback on their learning experience through a questionnaire. During Phase 3, we further refined the benchmark-based assessment process, as detailed in Section 4.3. Furthermore, we analyzed the effectiveness of non-natural science instructors based on participant feedback surveys.
4. Results
4.1. Findings from Phase 1
The focus of Phase 1 was to verify the effectiveness of the training format and assessment method. As seen in Figure 2, prior to the training session, only 50% of participants were able to construct an x-y scatter plot using Microsoft Excel (Scatter Plot). Moreover, only 17% of participants were able to define the portion of the graph showing a linear relationship (Linear Segment), and only 42% of participants were able to perform a linear regression analysis with Microsoft Excel (Regression Equation). After the training, 100% of participants met the benchmarks of Scatter Plot, Axis Assignment, Regression Equation, and Variable Calculation, and 93% of participants met the Linear Segment (n = 18). Two months later, participants were asked to plot and perform a linear regression analysis with a new set of data they collected for a laboratory exercise. According to Figure 2, the percentage of participants who successfully met benchmarks two months later was significantly higher than that of the pre-training test, indicating that many participants retained the skills.
4.2. Findings in Phase 2
Module R was developed and tested in Phase 2. We used the same format and delivery style of Module Excel since the participants noted that it was helpful. Module R was offered to Biochemistry students (n = 18) as a part of the lab course and as a standalone session for other volunteer students (n = 20). When these training sessions were offered as a standalone session, benchmarks were assessed as an exit quiz. Each benchmark was graded on a 0 (not achieved) or 1 (achieved) scale. We compared participants’ QDA skills based on the Module R benchmarks (Table 5) before and after the training. According to the results shown in Figure 3, 100% of the participants mastered the skills via training regardless of which sessions they took (n = 38).
Participants’ input was more formally collected starting with Phase 2. Figure 4 shows the participants’ perception of the training module. In terms of the difficulty level, 50% of participants rated the training as easy, while 23% felt it was difficult. In terms of pacing, 68% considered it appropriate, 23% perceived it as fast, and 9% found it slow. 91% agreed that “The training session enabled them to apply the skills to practice”. Furthermore, 95% of participants agreed that “the training instructions were clear and easy to follow”. One participant commented, “The exercise was very interesting. It was easy to follow along with the way the instructors presented it.” In addition to the content of the training, participants also commented on the accessibility of the software. For instance, a participant mentioned that the cloud-based training environment was helpful, “Very good introduction/refresher on R. … the cloud application is very accessible.”
4.3. Reflection on Phases 1 and 2 and Enhancement Implemented in Phase 3
As we reflect on the progress made in Phase 1 and Phase 2 of our training program development, we acknowledge both our achievements and areas for improvement. During these initial phases, our primary focus was on identifying training topics and gaining valuable insights into the elements that are crucial for the effectiveness of a training program. For example, we identified the importance of establishing clearly defined learning objectives for each module that aid students and faculty in selecting relevant and beneficial topics.
Despite the fact that R and scripting is a new tool to most students, they stated that the training was manageable. The overwhelmingly positive feedback regarding the practicality of the training and participants’ performance in exit quizzes affirmed the effectiveness of integrating practical activities and contextual information into our training. As we moved into Phase 3, we intended to retain these design principles, as they had proven instrumental in achieving our training objectives.
However, as part of our ongoing efforts for improvement, we also identified common conceptual and procedural misunderstandings during Phase 1 and Phase 2. For instance, some participants encountered challenges in correctly assigning rows and columns in tabular data, while others had difficulties interpreting histograms. These observations prompted us to refine subsequent versions of the training materials to address these specific areas of confusion.
While standalone training sessions had advantages and were equivalently effective as in-class training, many logistical adjustments were necessary for their implementation. To accommodate many participants’ schedules while keeping the session size manageable for one instructor, multiple sessions needed to be offered for each module. We quickly realized that multiple instructors were required, which further necessitated instructor training materials. We created instructional guides for instructors and conducted practice run-throughs of the presentations. These additional materials are crucial for the scalability and sustainability of our program, as well as for adoption by different institutions.
While the original assessment method efficiently identified basic comprehension, it failed to capture the nuance of student understanding. We refined our assessment approach from a binary benchmark system (met/not met) in exit quizzes to a more detailed method with targeted questions for each benchmark. Table 6 in Appendix B provides a detailed demonstration of the assessments utilized in various phases.
4.4. Findings in Phase 3
In Phase 3, we introduced three additional modules (Module T-Test, Chi-Square, and PCA). Figure 5 illustrates the participants’ scores in the exit quizzes for the five modules. Most participants met or exceeded the expectation (i.e., scores higher than eight out of ten). The percentage of participants that met or exceeded the expectations was 75% in Module Excel, 87.5% in Module R, 87.5% in Module T-Test, 87.5% in Module Chi-Square, and 93.8% in Module PCA.
Figure 6 displays the results of post-training questionnaires asking the participants’ learning experience, as well as their feedback on module materials and structure. The variation in the number of respondents across modules is due to some participants not completing the post-training survey after the exit quizzes. Module T-Test was rated as “Difficult” by more participants when compared to the other modules. This aligns with the observation that the average performance was the lowest in this module (Figure 5). We attribute this to the introduction of the complex concepts fundamental to hypothesis testing, such as Type I and Type II errors, power, and sample size. These topics were introduced for the first time in Module T-Test, thus representing a significant increase in cognitive demand and conceptual depth. Interestingly, as participants progressed to Module Chi-Square and Module PCA, there was a marked decrease in the perceived difficulty level, as evidenced by Figure 6 (a). This shift suggests an increase in participants’ familiarity and comfort with learning new statistical concepts. The improved performance in later modules implies that once participants overcame the initial hurdle of understanding hypothesis testing, they were better equipped to tackle subsequent conceptually challenging modules. This highlights the potential benefits of structuring educational content in a way that builds upon previous knowledge, gradually introducing complexity while reinforcing core concepts.
Figure 6 (d) indicates that most participants taught by student instructors indicated that the modules were understandable and easy to follow (95% agreed in Module Excel, 91% agreed in Module R, and 100% agreed in other modules). Students also stated that the training enabled them to apply the skills into practice, as shown in Figure 6 (c). The feedback suggested that our modules can be easily delivered by instructors without prior knowledge of the subject area.
We also collected feedback from instructors in Phase 3 using questionnaires. All the instructors agreed on the following statements: “I felt a collaborative and positive atmosphere in the session” and “I felt very comfortable delivering materials”. Therefore, we believe employing student instructors to assist and/or carry the workload of the module delivery is feasible and advisable.
In addition, in an open-ended question “What are the difficulties the participants experienced during the session?”, we discovered that the major difficulties came from coding with R. Two instructors reported, “Some students had issues reading the dataset because they didn’t set up the correct working directories, but we were able to figure them out.”; and “students forget that they have to upload the file into the right place. This then causes them to be behind slightly.”
Some natural science participants who had no programming background had trouble understanding the R scripts in the training material. One instructor reported, “Some students had gotten lost on the for loop part of the code, and were unable to keep up with the rest of the group. I had them just pay attention until we finished and then helped them after the training session …”. The instructors were able to help them by explaining the scripts and providing the information they needed. Participants’ positive feedback indicates that they are likely to get help for technical issues in the in-person session with the instructor(s) and complete the training. This may not be the case if they learned via a self-guided online tutorial.
After the completion of all five modules, we requested the final survey encompassing all sessions. According to the results shown in Figure 7, all participants (n = 12) agreed that the workload of the training was manageable, and the face-to-face sessions were helpful for understanding the materials. Accomplishment of the training also gave them the feeling of achievement and fulfillment.
The QDA training coincided with an increased interest and participation of students in independent summer research projects. Following Phase 3, we observed a remarkable surge in the number of participants applying for summer research opportunities with faculty members, with 19 students expressing their willingness to engage in these projects. This number is a significant increase from previous years, where typically only three to five students voluntarily participated in such research endeavors. While this marked uptick in participation occurred following the data analytics training, it is important to clarify that this association is observational and does not establish a direct cause-and-effect relationship. The increase in student interest and confidence could be influenced by a variety of factors, and further research would be necessary to determine the specific impact of the QDA training on their engagement in research activities.
5. Discussion
Our study presents the CQDATP framework as a practical approach for faculty at small colleges to enhance students’ QDA skills. This initiative holds value in institutions where significant curriculum changes are impractical due to limited faculty and teaching resources. The modular nature of CQDATP allows for seamless integration into existing courses or as co-curricular activities, thereby offering scalability and adaptability across various educational settings.
Moreover, the program’s structured approach, with clear learning objectives and prerequisites, accommodates students from diverse backgrounds and allows for tailored learning experiences. Instructors, leveraging this structure, can guide students to modules that complement classroom learning or serve as standalone exercises, to reduce the direct instructional burden. The program's adaptability was confirmed through its successful deployment in small group settings, led by trained student instructors. Feedback from Phase 3 participants confirmed that the training sessions’ workload and quality met their expectations even when offered by student instructors. Building on the successful involvement of senior students who have completed a course in statistical techniques (described in Section 3.3) and possess a programming background, we suggest that similarly qualified students could effectively deliver these modules with minimal additional training. Therefore, we recommend that student instructors who are familiar with programming and have completed comparable coursework in statistical techniques be considered eligible to assist with, or even lead, the training modules. This approach not only utilizes their existing knowledge but also provides them with valuable teaching experience.
Additionally, we acknowledged the significant benefits of incorporating contextual details and applying relevant datasets from the field. This strategy aids natural science students in understanding the content more deeply and maintaining their motivation to acquire computational QDA skills. Overall, this framework is both scalable and transferable, offering a viable solution for small colleges and two-year institutions aiming to bolster their students’ data analytics skills without the need for extensive curriculum revisions.
However, further research is needed to study the long-term impact of QDA training on students’ academic and career success. While our program provides a solid foundation in data analysis, we recognize the need to focus more on the complexities of uncertainty and data ethics. To this end, we plan to systematically incorporate advanced modules that explore the sources of uncertainty, such as measurement error, sampling variability, and the assumptions behind models. Additionally, recognizing the critical role of communication in data science, we aim to better equip our students with the skills necessary for transparently communicating the uncertainty in their findings. This will involve training on how to effectively report measures of uncertainty and articulate their implications comprehensively to audiences of varying technical backgrounds. Moreover, an understanding of the ethical implications associated with handling and communicating uncertainty will be integrated, ensuring students are aware of the potential impacts of their work on stakeholders and society at large.
Furthermore, we recognize that having student instructors may not fully cover the depth and range of statistical questions that might arise. As a future improvement, we are considering additional support strategies. This might include creating a more robust support system where these instructors can quickly get assistance from senior instructors or statisticians when faced with questions beyond their scope. We also see an opportunity to enhance the continuous professional development of instructors, including more advanced training in statistics and teaching methodologies.
As Artificial Intelligent (AI) tools become more integrated into analytical processes, our training will evolve to include these technologies. This will enhance their readiness for advanced study and the interdisciplinary nature of modern data science, preparing them for a job market where AI competency is increasingly valued. In addition, future research directions include conducting qualitative studies to identify the key quantitative skills required in the natural science workforce and to comprehend the application of these skills in real-world scenarios.
6. Conclusion
We proposed a practical framework designed to enhance QDA training for natural science students, particularly within the constraints of limited teaching resources. Through three iterative phases, a training program was built and evaluated using this framework. The program’s distinctive features, including in-person co-curricular sessions, context-based problem-solving, and a flexible, module-based structure, offer a nuanced approach to addressing the prevalent QDA skill gaps in current curricula. Our iterative development allowed for testing feasibility with an incrementally broader audience while staying within resource constraints. Our findings further our understanding of effective pedagogical strategies for practical QDA skill training in natural science education at small colleges. Moreover, by highlighting specific elements that contribute to the training program’s success, our framework establishes a foundation for future implementation of innovative statistics and data science teaching and learning approaches at the institutional level.
Data Availability Statement
The data that support the findings of this study are openly available in Zenodo at 10.5281/zenodo.7947120.
Appendices
Appendix A
Appendix B
Table 1 QDA training program comparison
Table 2. Development of the CQDATP framework in three phases.
Table 3. Topics, prerequisites, and learning objectives of the training modules.
Table 4. Composition of participants. The symbol * indicates participants in Phase 2 (5 out of the 10 juniors and 13 out of the 17 seniors) who had also participated in Phase 1, amounting to a total of 18 out of 38 participants from Phase 1.
Table 5. Benchmarks for Module Excel and Module R
Table 6. Comparison of selected exit quiz questions between Phase 1, 2 and Phase 3.
Figure 1. Examples of step-by-step instructions in the training module R
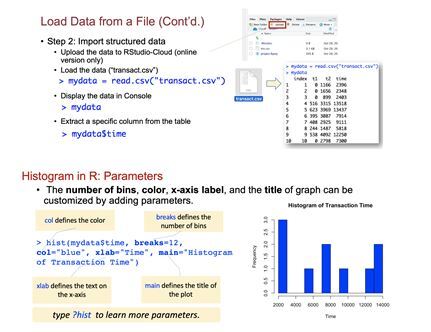
Figure 2. Assessment result of Module Excel in Phase 1. The benchmarks are described in . The benchmarks were assessed before (Pre, in green) and after (Post, in blue) the training session. Their performance was tested again two months later (in yellow). n = 18.
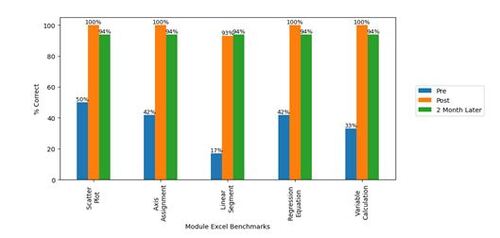
Figure 3. Assessment results of Module R in Phase 2, n = 38. The benchmarks are described in .
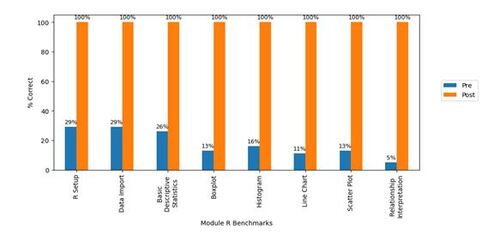
Figure 4. Responses from participants in Phase 2 on perceived difficulty, training pace, and skill applicability. n = 22.
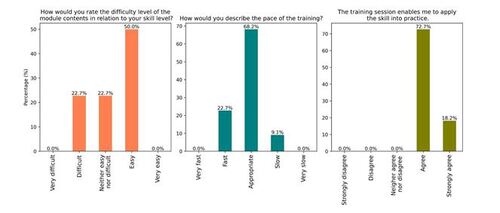
Figure 5. Performance of students in the exit quiz in Phase 3. n = 22.
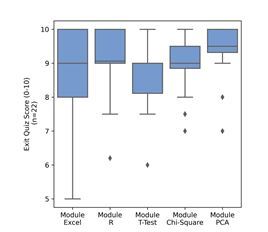
Figure 6. Participants’ responses for modules in Phase 3: (a) perceived difficulty level, (b) perceived pace, (c) training applicability, and (d) instruction clarify in TA-led session.
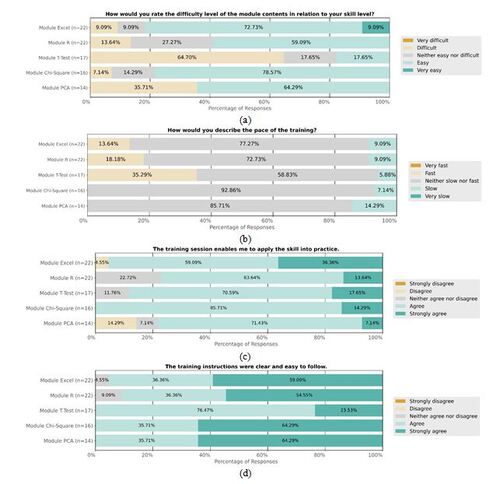
Figure 7. Ratings of participants in Phase 3.
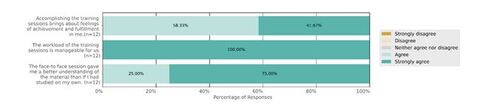
Figure 8. Word cloud of the required or desired skills in the job postings related to natural science careers.
Notes
1 Training materials are openly available in Zenodo at 10.5281/zenodo.7947120.
References
- Banerjee, A., Chakraborty, C., Kumar, A., & Biswas, D. (2020). “Emerging trends in IoT and Big Data Analytics for Biomedical and Health Care Technologies.” Handbook of Data Science Approaches for Biomedical Engineering, 121-152. DOI: 10.1016/B978-0-12-818318-2.00005-2.
- Bell, P. (2004), “On the Theoretical Breadth of Design-Based Research in Education.” Educational psychologist, 39 (4), 243-253. DOI: 10.1207/s15326985ep3904_6.
- Bennie, B., & Erickson, R. A. (2023). “Obtaining and Applying Public Data for Training Students in Technical Statistical Writing: Case studies with Data from US Geological Survey and General Ecological Literature.” Journal of Statistics and Data Science Education, 1-10. DOI: 10.1080/26939169.2023.2195459.
- Çetinkaya-Rundel, M., & Ellison, V. (2021). “A Fresh Look at Introductory Data Science.” Journal of Statistics and Data Science Education, 29(sup1), S16-S26. DOI: 10.1080/10691898.2020.1804497.
- Collins, A., Joseph, D., and Bielaczyc, K. (2016), “Design Research: Theoretical and Methodological Issues.” in Design-Based Research: Clarifying the Terms: Psychology Press, pp. 15-42. DOI: 10.1207/s15327809jls1301_2.
- Carver, R. H. F., Everson, M., Gabrosek, J., Horton, N. J., Lock, R. H., Mocko, M., Rossman, A. J., Roswell, G. H., Velleman, P. F., Witmer, J. M., & Wood, B. (2016). “Guidelines for Assessment and Instruction in Statistics Education (GAISE) College Report 2016.” American Statistical Association. https://www.amstat.org/docs/default-source/amstat-documents/gaisecollege_full.pdf
- Coursera. (n.d.). “Data Analysis with R Programming.” Coursera. https://www.coursera.org/learn/data-analysis-r
- Crippen, K. J., and Archambault, L. (2012), “Scaffolded Inquiry-Based Instruction with Technology: A Signature Pedagogy for STEM Education.” Computers in the Schools, 29 (1-2), 157-173. DOI: 10.1080/07380569.2012.658733.
- Del Toro, I., Dickson, K., Hakes, A. S., & Newman, S. L. (2022). “Early Undergraduate Biostatistics & Data Science Introduction Using R, R Studio & the Tidyverse.” The American Biology Teacher, 84(3), 124-129. DOI: 10.1525/abt.2022.84.3.124.
- Emery, N. C., Crispo, E., Supp, S. R., Farrell, K. J., Kerkhoff, A. J., Bledsoe, E. K., O’Donnell, K. L., McCall, A. C., and Aiello-Lammens, M. E. (2021), “Data Science in Undergraduate Life Science Education: A Need for Instructor Skills Training.” BioScience, 71 (12), 1274-1287. DOI: 10.1093/biosci/biab107.
- Estrada, M. (2014), “Ingredients for Improving the Culture of STEM Degree Attainment with Co-curricular Supports for Underrepresented Minority Students.” National Academies of Sciences White Paper, 28.
- Feser, J., Vasaly, H., and Herrera, J. (2013), “On the Edge of Mathematics and Biology Integration: Improving Quantitative Skills in Undergraduate Biology Education.” CBE—Life Sciences Education, 12 (2), 124-128. DOI: 10.1187/cbe.13-03-0057.
- Gardner, J., and Belland, B. R. (2017), “Problem-Centered Supplemental Instruction in Biology: Influence on Content Recall, Content Understanding, and Problem Solving Ability.” Journal of Science Education and Technology, 26 (4), 383-393. DOI: 10.1007/s10956-017-9686-0.
- Gardner, S. M., Angra, A., & Harsh, J. A. (2022). “A Framework for Teaching and Learning Graphing in Undergraduate Biology.” Trends in Teaching Experimentation in the Life Sciences: Putting Research into Practice to Drive Institutional Change, pp. 143-170. DOI: 10.1007/978-3-030-98592-9_8.
- Henley, L., and Roberts, P. (2016), “Perceived Barriers to Higher Education in STEM among Disadvantaged Rural Students: A Case Study.” Inquiry, 20 (1), 19-38. https://commons.vccs.edu/cgi/viewcontent.cgi?article=1068&context=inquiry
- Jungck, J. R. 2001. “BioQUEST Library.” Vol. 6. Academic Press, Cambridge, MA.
- Macalester (n.d.),”Data and Computation Fundamentals. Macalester.” https://www.macalester.edu/hhmi/curricularinnovation/data
- Magana, A. J., Taleyarkhan, M., Alvarado, D. R., Kane, M., Springer, J., and Clase, K. (2014), “A Survey of Scholarly Literature Describing the Field of Bioinformatics Education and Bioinformatics Educational Research,” CBE—Life Sciences Education, 13 (4), 607-623. https://www.lifescied.org/doi/10.1187/cbe.13-10-0193
- Porter, S. G., & Smith, T. M. (2019). “Bioinformatics for the Masses: The Need for Practical Data Science in Undergraduate Biology.” OMICS: A Journal of Integrative Biology, 23(6), 297-299. DOI: 10.1089/omi.2019.0080.
- Rhodes, T. (2010), “Valid Assessment of Learning in Undergraduate Education (Project).” Liberal Education and America’s Promise (Program), & Association of American Colleges and Universities. https://www.aacu.org/initiatives-2/value
- Satam, H., Joshi, K., Mangrolia, U., Waghoo, S., Zaidi, G., Rawool, S., … & Malonia, S. K. (2023). “Next-Generation Sequencing Technology: Current Trends and Advancements.” Biology, 12(7), 997. DOI: 10.3390/biology12070997.
- Saucerman, J., and Vasquez, K. (2014), “Psychological Barriers to STEM Participation for Women Over the Course of Development,” Adultspan Journal, 13 (1), 46-64. https://mds.marshall.edu/adsp/vol13/iss1/4
- Schwab-McCoy, A., Baker, C. M., & Gasper, R. E. (2021). “Data Science in 2020: Computing, Curricula, and Challenges for the Next 10 Years.” Journal of Statistics and Data Science Education, 29(sup1), S40-S50. DOI: 10.1080/10691898.2020.1851159.
- Speth, E. B., Momsen, J. L., Moyerbrailean, G. A., Ebert-May, D., Long, T. M., Wyse, S., & Linton, D. (2010). “1,2,3,4: Infusing Quantitative Literacy into Introductory Biology.” CBE—Life Sciences Education, 9(3), 323-332. DOI: 10.1187/cbe.10-03-0033.
- Thompson, K. V., Nelson, K. C., Marbach-Ad, G., Keller, M., and Fagan, W. F. (2010), “Online Interactive Teaching Modules Enhance Quantitative Proficiency of Introductory Biology Students,” CBE—Life Sciences Education, 9 (3), 277-283. DOI: 10.1187/cbe.10-03-0028.
- Udacity. (n.d.). “Data Analysis with R.” Udacity, https://www.udacity.com/course/data-analysis-with-r–ud651
- Wilke, R. R., and Straits, W. J. (2005), “Practical Advice for Teaching Inquiry-Based Science Process Skills in the Biological Sciences,” The American Biology Teacher, 534-540. DOI: 10.2307/4451905.