
 ?Mathematical formulae have been encoded as MathML and are displayed in this HTML version using MathJax in order to improve their display. Uncheck the box to turn MathJax off. This feature requires Javascript. Click on a formula to zoom.
Abstract
Single qubit in solid-state materials recently emerges as a versatile platform for quantum information. Among them, the nitrogen vacancy (NV) centre in diamond has become a powerful tool in quantum sensing for detecting various physics parameters, including electric and magnetic fields, temperature, force, strain, with ultimate precision and resolutions. It has been widely used in different conditions, from samples in ambient to samples in ultra-high pressure and low temperature. It can detect quantum phase transitions as well as neuron activities. Here we give a general review on both the physics of the sensing mechanism and protocols and applications.
1. Introduction
Quantum sensors detect weak physical signals in nanoscale by quantum coherence, quantum properties or quantum entanglement. Large amounts of quantum sensors are experimentally realized. For example, neutral atoms like cold atoms [Citation1] and atomic vapours [Citation2] as magnetometer; trapped ions [Citation3] and Rydberg atoms [Citation4] for electric fields; superconducting quantum interference device (SQUID) as the most sensitive magnetometer; atomic-scale defects in crystals like nitrogen vacancy (NV) colour centres and so on. The energy levels of NV are sensitive to magnetic fields, electric fields, strain, and temperature variations at room temperature, making it a versatile sensor. As a quantum sensor, NV
is rather simple to implement with high resolution. A single 532-nm solid-state laser is sufficient for optical initialization and readout. Also, NV
centre-based sensors work for signals from several Hz level [Citation5] up to several GHz [Citation6]. NV
centre sensors can be placed within a nanometre-scale platform like cells for biological applications [Citation7].
The development of sensors has played a big role in the advances of technologies. Sensors with better performance and working ranges help people explore new regions. Since 1997, a new system of point defect in solids has become a successful field for sensing [Citation8]. Especially, the first one in this family: the negatively charged NV centre is a promising candidate. Unlike other systems, NV has good coherent properties for processing even in ambient conditions, as well as superior sensitivity and resolution for sensing purpose. Quantum research using the NV centre has lots of potentials for quantum information technology. In this review, we focus on recent interdisciplinary research works using the NV centre.
2. The nitrogen vacancy (NV) Centre
The NV centre is a point defect in a diamond crystal, which contains a substitution N atom directly connected to a vacancy with symmetry, see . The crystal axis between the nitrogen atom and vacancy defines the NV centre axis. There are 4 possible orientations in a single crystal diamond. Negatively charged NV
centre is optically active, which shows the zero-phonon line at 637 nm with broad phonon sidebands. Both ground and excited states show a zero-field splitting which lifts off the degeneracy between ms = 0 and
spin states.
Figure 1. (a) The structure of the NV centre in the diamond crystal, which contains a substitution N atom directly connected to a vacancy with symmetry. (b) The simplified level structure of the NV centre. Its unique transitions lead to optical spin initialisation and readout. The optically detected magnetic resonance (ODMR) measurement is enabled by scanning MW of frequencies across the resonant frequencies between
and
ground states.
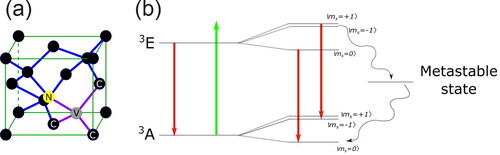
Due to its unique level structure as shown in , optical excitation can lead to both spin initialisation and spin readout. For excited state, it mainly relaxes to the ground state by emitting red fluorescence (PL). The ratio of relaxing through the meta-stable state can generally be ignored. On the contrary,
excited states have a large ratio of relaxing via a non-radiative transition that involves the meta-stable state. Through the meta-stable state, the spin preferentially relaxes to
ground state, in contrast to a negligibly small amount to
ground state. Therefore, the system can be initialized through optical pumping. Furthermore, since the meta-stable state has a lifetime around 250 ns, the effective brightness of
is
lower than ms = 0 state. Therefore, the spin states can be optically readout. The optically detected magnetic resonance (ODMR) measurement is enabled by scanning microwave (MW) of frequencies across the resonant frequenciesbetween
and
ground states.
ground states gain population at the transition frequencies and render dips (PL drops) on the ODMR spectrum.
3. Principle of NV sensing
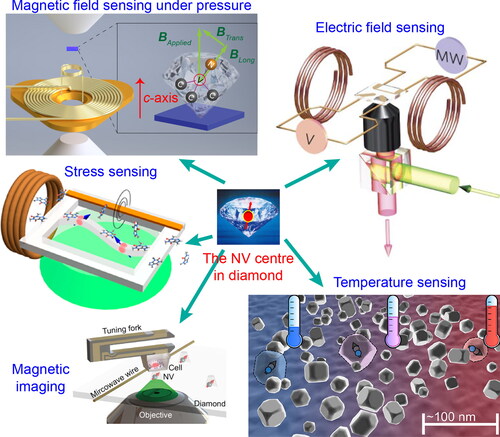
The NV centre is robust in various research areas [Citation9–13], as illustrated in . Interesting research works can be done by using different properties of the NV centre. Here, we introduce the principle of NV sensing.
Figure 2. An illustration of the versatility of the NV centre, including magnetic field sensing under pressure (Reproduced with permission from Yip et al., Science 366, 1355 (2019). Copyright 2019 American Association for the Advancement of Science), electric field sensing (Reproduced with permission from Dolde et al., Nat. Phys. 7, 459 (2011). Copyright 2011 Springer Nature, stress sensing (Reproduced from Barson et al., Nano Lett. 17, 1496 (2017). Copyright 2017 Author(s), licensed under a Creative Commons Attribution (CC BY) license), temperature sensing (Reproduced from Neumann et al., Nano Lett. 13, 2738 (2013). Copyright 2013 Author(s), licensed under a Creative Commons Attribution (CC BY) license) and magnetic imaging (Reproduced from Wang et al., Sci. Adv. 5, eaau8038 (2019). Copyright 2019 Author(s), licensed under a Creative Commons Attribution (CC BY) license).
3.1. Sensing from electron spin resonance (ESR) spectrum
The Hamiltonian and the transition frequencies among the sub-levels of the electronic triplet ground states in the NV centre are governed by external physical parameters. By using ODMR to measure the level structures, these physical parameters can be determined. Here, the full ground-state electron spin Hamiltonian of the NV centre is [Citation14]:
(1)
(1)
where
is the electron spin operator, Deff is the effective spin-spin and axial (along the NV axis) electric-strain field components, ϵx, ϵy are the effective non-axial electric-strain field components,
is the effective magnetic field.
We define a coordinate frame with its axis along the NV centre axis, also that the non-axial strain field is along the
axis
the Hamiltonian can be reduced to:
(2)
(2)
which is the Hamiltonian of the form of zero-field splitting.
D, E are the longitudinal and transversal zero-field splitting parameters respectively, with D ≈ at ambient conditions while E is negligibly small compared to D and usually capped at several MHz. D is subjected to pressure and temperature change around the NV centre, on the other hand, E is subjected to the external non-axial strain field acting on the NV centre. The last term accounts for the Zeeman Effect by an external magnetic field
, where γe is the electron gyromagnetic ratio.
D splits and
states, and the
states are further split by E. By identifying the positions of peaks on the ODMR spectrum, one can extract information about the external fields acting on the NV centre. For example, in the absence of strain field, EquationEq. (2)
(2)
(2) predicted that there is a peak at D on the ODMR spectrum thereby calculating the value of the pressure or temperature applied according to some previously reported results.
3.2. Sensing with relaxometry
For a single NV sensing spin, a phase can be generated by the weak external field b during free-precession interval τ. Here Δ
is the change of spin quantum number,
≈2 for the NV centre. Then the ideal spin-projection-limited sensitivity given by the minimum external field can be detected is
. For the ensemble sensors with N individual spins the sensitivity can be increased to
[Citation15, Citation16]. To reach such shot-noise limitation, there are still several difficulties to be resolved. First, for the interval τ, the dephasing limits it up to
and deteriorates the sensitivity by
while P depends on the origin of dephasing. Higher-order dynamical decoupling sequences can be applied to NV ensembles [Citation17] yielding a phase memory time of 2 ms, which is the limit set by longitudinal spin relaxation of NV centres at room temperature, to reach the alternating current (ac) magnetic field sensitivity of
comparing the spin-projection-limited sensitivity of
Also finite initialization and readout time will deteriorate the sensitivity by a factor
[Citation18]. Second, the NV spin state detection is depending on the PL difference from ms = 0 and
of wavelength from 650 nm to 800 nm. A parameter is defined
to qualify the readout technology [Citation19], where a and b is the photons detected from ms = 0 and
respectively. For imperfect readout technology, the readout fidelity is
The sensitivity will also be degraded by this factor σR. In summary, technologies of dynamical decoupling and spin readout are needed to improve spin coherence time and readout fidelity to reach such spin-projection-limited sensitivity.
The change of external surroundings does not only change the central positions in the spectrum, but also the decay process and the spectral linewidth. Relaxometry is a common tool in electron spin resonance (ESR). For the NV centre, both longitudinal and transverse relaxations are commonly used for sensing applications.
The longitudinal relaxation describes the spin-flip process (i.e. the T1 decay). Resonant photon or phonon can provide the energy for this transition. Thus, the transition ratio can be a good measure of the energy density in that frequency. Since the ground state of the NV centre is a spin triplet and can be optically initialized and readout, by measuring its spin T1 time, one can measure the resonant noise surrounds the qubit. The resonant frequency among spin-triplet states is in the order of GHz. The T1 lifetime is sensitive to noise in resonance with spin transitions. Furthermore, by using a magnetic field to change the Zeeman splitting, the sensing frequency can be fine-tuned. This method has been widely used, especially for sensing spin-wave dynamics [Citation20, Citation21].
Similar to the longitudinal case, the transverse relaxation can also be used for sensing. The transverse relaxation describes the decoherence process. Unlike the longitudinal one, the transverse relaxation is sensitive to noise in all frequencies. Since NV centres generally have long decoherence time ( time around μs, and T2 can go up to ms), the change of its decoherence time or the change of ESR linewidth has been used as a sensitive sensor for magnetic noises. Besides measuring the changes with a free induction decay or Hahn echo, the noise can be analysed in more detail with the dynamical decoupling method.
3.3. Dynamic decoupling for spin coherence preservation
Controlling a quantum system interacting with its surrounding environment precisely is one of the key challenges of quantum computation. Dynamical decoupling can be exploited to efficiently alleviate the interactions with high fidelity operations [Citation22, Citation23].
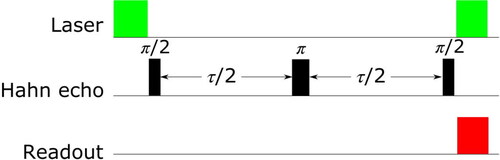
Spin echo [Citation24] is the original idea of dynamical decoupling. In coherent dynamics, it is typically performed as Hahn echo, whose basic sequence is where π represents a microwave pulse of sufficient duration to rotate the state along x-axis for π on Bloch Sphere and τ is free evolution time (). The principle is that the π pulse in the middle flips electron spin, making the phase noises accumulated during the first and second evolution time cancel each other for one dimension. For NV spin system, NV electron spin evolutes under the environment of nuclear spin bath of C13 spin-1/2. The evolution goes under two conditions: 1. ms = 0: no interaction. 2.
: H = SAI, is the hyperfine interaction. Therefore, the procession of nuclear spins is controlled by the NV electron spin state. Then when the NV electron spin is prepared in a superposition state, it is entangled with nuclear spin baths, which are randomly placed in the diamond lattice with a certain proportion, at a rate determined by the external magnetic field. Because of this, the coherence of a single electron spin cannot maintain for a long period and it is impossible to couple NV electron spin with one specific C13 single nuclear spin. The Hahn echo signal sequence decouples the spin from the spin bath environment, which changes slowly compared with τ (high pass filter), that increases coherence from
μs to
μs [Citation25].
Figure 3. Hahn echo, whose basic sequence is where π represents a microwave pulse of sufficient duration to rotate the state along x-axis for π on Bloch Sphere and τ is free evolution time.
In order to cancel fluctuating noise to the n-th order of t, , the Carr-Purcell-Meiboom-Gill (CPMG) pulse sequence [Citation26] was developed, see . To be more specific, the magnetic field generated by the spin bath environment can be defined as
that B0 and
reperesent the mean value of the magnetic field and the fluctuation part respectively. The magnetic field can be written as a Taylor series:
(3)
(3)
Figure 4. The Carr-Purcell-Meiboom-Gill (CPMG) pulse sequence. The sequence of CPMG is and the interval duration between each two π pulse is equal. The CPMG pulse sequence is proved to extend the coherence time longer by eliminating high order fluctuating noise.
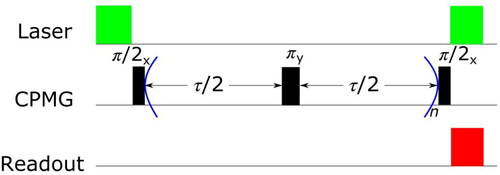
The sequence of CPMG is and the interval duration between each two π pulse is equal, which is so called periodic dynamic dycoupling (PDD). First, we consider CPMG-1, the first microwave
pulse transfers NV electron spin into the superposition state
. Inhomogeneities a0 leads to the decoherence of
with function
The evolution operator is
The π pulse in the middle inverts the sign of Hevol, making a effective Hamiltonian
that refocuses the electron spin. The contribution of a0 in the dephasing is completely removed, whereas the contribution from high-order terms is suppressed via
[Citation27]. Then the last π
pulse transfer the coherence into population for optical readout. For CPMG-n, the effect on the phase shift will be
The effect on the k-th Taylor term is [Citation27]
(4)
(4)
The CPMG pulse sequence is proved to extend the coherence time longer by eliminating high order fluctuating noise. However, this design of sequence has difficulties making quantum operations in high fidelity when n is large than 70–100. More sophisticated sequences such as XY-8 have been designed.
So far, one of the most effective sequences is the KDD (Knill dynamical decoupling), as shown in . The KDD sequence is defined as [Citation28]:
(5)
(5)
Figure 5. Knill dynamical decoupling (KDD) sequence. This KDD method is robust against pulse errors and is symmetric for arbitrary initial superposition states.
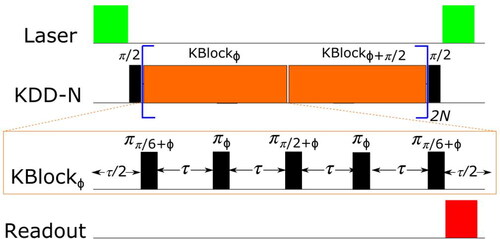
This KDD method is robust against pulse errors and is symmetric for arbitrary initial superposition states.
3.4. Noise spectroscopy through dynamical decoupling
Dynamical decoupling removes the influence of noise with low frequencies on the coherence of the qubit. But for other frequencies, its influence on decoherence is kept. Therefore, it can be used similar to relaxometry and it can provide the spectral resolution, as proposed in [Citation29–31]. The NV centre has valid detection protocols for ac magnetic fields with different frequencies. Interaction with the environment leads to the increasing of T1-decay rate [Citation32] or T2-decay rate [Citation33] in order to detect ac magnetic field in GHz and MHz range respectively. While dynamical decoupling based protocol works well in the frequency range of kHz to MHz [Citation34, Citation35].
The application of DD in spin resonance experiments is well known in order to eliminate low-frequency noise. Applying N uniformly spaced pulse sequences with an interval τ can effectively average out the magnetic noise effect at frequencies below working as tuneable high-pass filters. This property can be used to adjust the sensitivity of processing NV spin to the frequency of spin noise. After the effective Hamiltonian generated by DD sequence, the initial coherent superposition state
decoherences by the influence of the mean square value of fluctuations
, which can be measured as
. Here
describes the power spectral density of the noise and
is the filter function of DD sequences, which is called spin lock-in detection method [Citation36]. The π pulses invert the direction of the magnetic field accumulated by the NV spin. This method enhances the noise signal so that the NV centre can be used to sense magnetic fields with high resolution. Using the phase variance from measurement and filter function from, DD sequence, one can reconstruct the target field [Citation37].
For different DD methods, in principle they can all used for the above-mentioned lock-in method. However, there are still some limitations. First, it should match the related time scale. Then, it is limited by pulse errors and relaxation time of the NV spin. Lastly, sequences that only use single-axis decoupling, which only protect a specific superposition state, accumulate errors with increasing number N of π pulses. Because of this, the XY-n sequence is a suitable method for noise spectroscopy measurement. What’s more, in order to break the limitation of T2 decay into T1 decay, correlation method is developed for high resolution [Citation38].
4. Quantum sensing in different working environments using the NV Centre
With these features discovered, the NV centre in diamond has been used widely in various applications in quantum information technologies, ranging from quantum computing, quantum communication, to sensing magnetic field, electric field, temperature and other physical parameters. Here, we would like to review a few recent progress in a few specific fields. We first briefly discuss the versatility of the NV centre in sensing different physical parameters, then review some applications on material research as examples.
4.1. Magnetic field and electric field sensing
The magnetic field sensed by the NV centre can be, in principle, extracted from the resonances of the ODMR spectrum associated with the Zeeman splitting term. Nonetheless, this method can only resolve a relatively high magnetic field that contributes to an observable splitting in resonance peaks. Measuring weak magnetic fields with pulsed sequences are, therefore, developed. Since the magnetic field influences the precession of the spin in the Bloch sphere, the magnetic field can be obtained by analysing the signal from certain pulsed sequences [Citation16, Citation39–41].
Moreover, the NV centre is also sensitive to the electric field. Similar to the magnetic field, the electric field also changes the ODMR spectrum. To enhance the sensitivity, certain protocols can be applied to precisely determine the local electric field and/or external electric field [Citation10, Citation42].
4.2. Temperature sensing
The temperature dependence of the ODMR spectrum has been revealed in detail. The ZFS D varies significantly with the temperature change. In general, it shows a linear behaviour around room temperature, while having a non-linear change upon cooling down. Moreover, it remains nearly no change at low temperatures. Precise measurements can be performed using certain pulsed sequences and the NV centre works well as a local temperature sensor due to its tiny size [Citation12, Citation43–45].
Stress sensing
The spin-stress Hamiltonian shows that the NV centre is sensitive to different components of the stress tensor. Hence, the stress tensor of a mechanical system can be fully reconstructed via NV sensing. By carefully analysing the ODMR spectrum, the stress tensor can be computed and gives detailed information on the mechanical system [Citation11, Citation46–49]. In addition, the NV centre is robust under pressure. Therefore, it works well as a pressure sensor as well as a versatile sensor under pressure [Citation9, Citation48, Citation50–54].
4.3. Applications on material research
The superior sensitivity, especially the magnetic field, of the NV centre provides huge chances to probe material responses thoroughly and locally. Here, we discussed a few frontier examples that utilizing the NV centre for different purposes. In particular, common techniques on material research require a bulk sample. Interestingly, the use of the NV centre, as a non-invasive and in situ sensor, provides new aspects at the microscopic level.
Spin waves take an important place in low-dissipation information processing. Imaging the transportation of spin waves is crucial for developing spin-wave devices. Bertelli et al. [Citation55] introduced a distinct approach, using a layer of NV centre in a diamond chip, to image spin waves in yttrium iron garnet (YIG) thin film in close proximity using phase-sensitive magnetic resonance imaging. The experimental setup was shown in . The key idea is to tune the spin-wave frequency in order to match the NV ESR frequency, thus driving the NV spin transitions by the oscillating magnetic stray field. They first characterized the NV PL as a function of external magnetic fields and MW frequencies in their device. These parameters served as tuning parameters to access spin waves with different wavelengths. They then performed Rabi oscillations verse distance from the stripline and extracted the spin-wave amplitude and decay length, corresponding to a reasonable Gilbert damping parameter of similar thickness [Citation57]. Furthermore, they visualized the individual spin-wave front with different wavelengths. By combining the technique of pulsed control of the NV spins, they revealed the spin-wave dispersion in space and time domains, as shown in . In addition, they showcased their approach by using multi-striplines to image the interference and caustic of spin waves. They also provided theoretical calculations to confirm the experimental results.
Figure 6. (a) Left: Schematic drawing of the setup. A YIG thin film was placed below a diamond chip, containing NV centres at 20 nm below the surface. NV centres detected the magnetic stray field from the spin waves results from PL drops at certain frequencies. Right: A gold stripline was used to generate spin waves. An external magnetic field was aligned with one of the four possible NV orientations. (b) Spin-wave frequency verse wave number. The red line was the calculated spin-wave dispersion. (c) Normalized NV PL using pulsed control verse distance from the stripline and delay time, showing the spin-wave dispersion in both space and time domains. Reproduced from Bertelli et al., Sci. Adv. 6, eabd3556 (2020). Copyright 2020 Author(s), licensed under a Creative Commons Attribution (CC BY) license. (d) Left: Schematic drawing of using the NV sensor to locally probe the magnons of a YIG thin film. Right: Normalized NV PL as a function of external magnetic field and microwave frequency. The calculated dispersion agreed with the observed features. Reproduced from Lee-Wong et al., Nano Lett. 20, 3284 (2020). Copyright 2020 Author(s), licensed under a Creative Commons Attribution (CC BY) license.
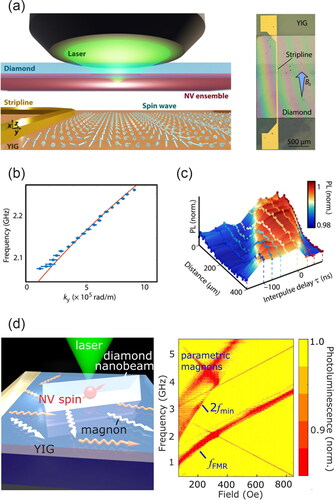
Regarding spintronic devices made by YIG thin film, magnons are another exciting playground due to the long coherence length, extended lifetime, and low dissipation. Lee-Wong et al. [Citation56] reported optical detection of magnons, by proximate NV centres, with a broad range of wavevectors in YIG. The magnons were generated by employing the nonlinear parametric excitation. By measuring the PL at different MW frequencies and external magnetic fields, they first demonstrated the intrinsic coupling between exchange spin waves with an NV qubit, as shown in . They then modified the magnon band structure by varying the thickness and dimensions of the YIG thin film, showcasing the universality of their technique. The enhanced dipolar interaction changes the magnon dispersion significantly. They further illustrate the discrete values of the magnon wavevectors by patterned the YIG thin film into a microdisk, and several spin-wave modes had been observed. Their experimental findings were supported by theoretical calculations, showing the powerfulness of NV imaging on spin systems.
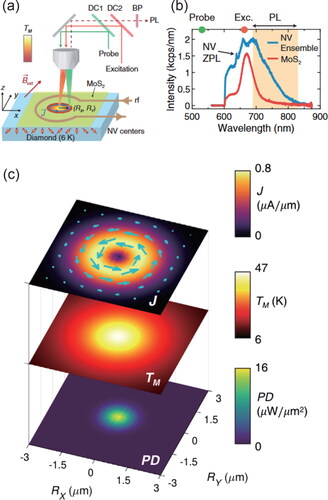
Apart from sensing spin systems, photocurrent was also sensed by the NV centre. Zhou et al. [Citation58] investigated, using embedded NV magnetometers, the light-matter interaction through probing the photocurrent response in 2 D materials with submicron resolution. They interfaced monolayer MoS2 with a near-surface ensemble of NV centres in diamond, and the magnetic fields measured by NV centres were mapped to the photothermal current. The experimental setup was shown in . The XY8-N dynamical decoupling sequence, with optimized sensitivity using quantum lock-in protocol, was implemented to probe the ac magnetic field. Interestingly, they detected the photo-Nerst current around the 661-nm excitation spot on the MoS2, with excellent agreement with their calculations (). Moreover, the temporal dynamics was also revealed by measuring the photothermal carrier generation. The rise time for the local photocurrent was confirmed by their calculations of the system’s transient thermal response. In conclusion, the photo-Nernst effect was observed, hence showing various opportunities for researching the optoelectronic phenomena in materials.
Figure 7. (a) An 661-nm excitation laser was used to generate a temperature distribution within Mos2, driving a circulating photocurrent distribution. The NV centre probed the magnetic field produced by the photocurrent and optically read out by a 532-nm probe laser. (b) Room-temperature PL of the boundary between Mos2 and an ensemble NV centre under 532-nm illumination. This graph justified the use of 661-nm excitation wavelength (longer than NV ZPL at 637 nm) to minimize optical excitation. The orange shaded region represented the NV PL collection region. (c) Comparison of the current density model which best fits the data, the simulated laser-induced temperature distribution TM, and the power density PD of the excitation laser. The current density model was in close agreement with the temperature gradient, also agreed with the experiential data. Reproduced from Zhou et al., Phys. Rev. X 10, 011003 (2020). Copyright 2020 Author(s), licensed under a Creative Commons Attribution (CC BY) license.
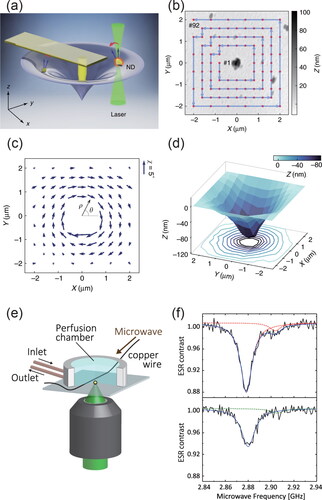
Besides, the rotational information of the NV centre has unexpected applications. Xia et al. [Citation59] made use of the 3 D rotation data of NDs, which induced by atomic force microscopy (AFM) indentation, to reconstruct the non-local surface topography, as illustrated in . They first calibrated the ODMR spectrum by using an ensemble-bulk diamond of known crystallographic orientation under a designed external magnetic field. They then measured the deformation of a PDMS film using a single-ND method, as shown in (b-d). This method measured the ODMR spectrum of a target ND with the presence of nearby AFM indentations. They showed that the experimental data were best described with a linear elastic bilayer model. Moreover, the deformation of the gelatin particle in water was reconstructed by the multiple-ND method. This method tracked several NDs near the AFM indentation. They compared quantitatively between the experimental data and the elastocapillary model, therefore concluded that this method was important in studying the surface tension effect. This work is promising in further research on soft materials. Meanwhile, Fujiwara et al. [Citation60] made use of a single ND incorporating a single NV centre to detect its rotational motion in nanoscale. The experimental setup was shown in . The NDs were initially attached on a coverslip in an aqueous buffer solution. The detachment was triggered by changing the pH value from distilled water to 9.9, then changed back to 9.1. Under this situation, the PL of NDs started to fluctuate. The ODMR measurements were performed before the NDs moved away. By tracking the linewidth broadening of the NV centre during the detachment process, they confirmed the detection of rotational Brownian motion (). They presented that the full width at half maximum (FWHM) was broadened by 1.8 MHz and can be explained by the Einstein–Smoluchowski relation.
Figure 8. (a) Schematic drawing of the experimental setup. The NDs were spread throughout the surface. The deformation caused by the localized indentation of an AFM tip was sensed by the rotation of NDs. (b) AFM image of a polydimethylsiloxane (PDMS) surface with an ND located at the centre, showing the sequence of the indentation from # 1 to # 92. (c) The rotation of the ND. The arrow represented both the magnitude of the rotation angle and the direction. (d) The reconstructed surface of the PDMS film upon AFM tip indentation at the centre. Reproduced from Xia et al., Nat. Commun 10, 3259 (2019). Copyright 2019 Author(s), licensed under a Creative Commons Attribution (CC BY) license. (e) The NDs were placed in a homemade perfusion chamber that simultaneously allows the exchange of the solution and the optical experiment. (f) ODMR spectra of the ND when it is fixed on the coverslip (top) and is about to detach (bottom). The reduction of contrast and broaden of linewidth can be observed clearly. Reproduced from Fujiwara et al., Sci. Rep. 8, 14773 (2018). Copyright 2018 Author(s), licensed under a Creative Commons Attribution (CC BY) license.
4.5. Novel techniques in the superconductivity research
Benefited from the high sensitivity to the magnetic field, recent research works had shown promising applications in exploring superconductivity using the NV centre. Here, we discuss a few recent techniques measuring the exotic magnetic features associated with the Meissner effect. One important feature to be studied is the superconducting phase transition and the corresponding critical temperature Tc. Several traditional techniques, including resistivity and mutual inductance method, are excellent at determining the Tc. Here, we take one step forward by using the NV centre as a local sensor for the local magnetic field measurement. Since a superconducting sample expels the nearby magnetic field below Tc, and returns to normal above Tc, it is expected to have a significant change on the magnetic field near the sample upon warming up.
In 2011, Bouchard et al. [Citation61] showed primarily experimental results observing the first Meissner effect measured by the NV centre. They used a scanning diamond tip to probe the surface magnetism of a Bi2Sr2Ca2Cu3O10 (BSCCO-2223) sample. They extracted the critical temperature K by examining the centre frequency D against temperature. The value obtained by the NV centre is in good agreement with previous results [Citation62]. This work demonstrated that the Meissner effect can be probed by NV magnetometry in close proximity. However, extra care should be taken since the centre frequency D is also temperature-dependent.
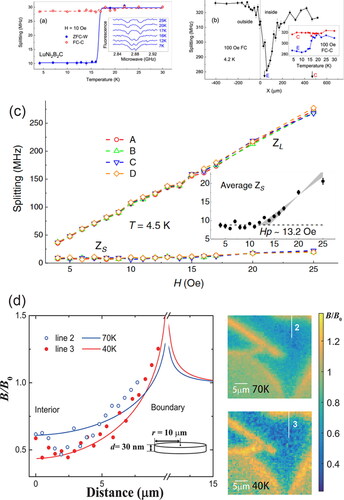
Recently, advanced sensing protocols were proposed by considering the change on the Zeeman splitting term instead of the centre frequency. Nusran et al. [Citation63] used a diamond plate for sensing the local magnetic field variation across different samples. They performed measurements outside and inside the sample, as well as at the edge of the sample. Since the observed magnetic moment depends on the experimental protocol, they defined four terminologies and abbreviations for the experiments: (1, ZFC-W) The sample was cooled below Tc without a magnetic field, then warmed up above Tc with an applied magnetic field. Measurements are taken on the warming side; (2, FC-C) The sample was cooled with an applied magnetic field. Measurements were taken while cooling; (3, ZFC) The sample was cooled down to 4.2 K without a magnetic field, after which a magnetic field was applied and measurements were performed. (4, FC) The sample was cooled in a constant magnetic field down to 4.2 K and measurements were performed. From the analysis of the ODMR splitting against temperature, they extracted the Tc of various superconducting materials, as shown in . Due to the intrinsic magnetic property of different groups of samples, different exotic behaviours can be observed from different protocols. Meanwhile, they measured the spatial variation of the Meissner effect and presented different scenarios of the Meissner expulsion. Joshi et al. [Citation64] made careful analysis on the ODMR spectra to deduce the lower critical field They put a diamond plate on top of a superconducting sample for measuring the splitting in the ODMR spectrum at different temperatures. They defined the outermost peaks as ZL and the innermost peaks as ZS. Obviously, from the splitting, they can determine the Tc of different samples. Moreover, from the sudden change of the ZS, they defined the onset of the magnetic field penetration Hp (). This onset is directly related to the actual lower critical field
. As a result, the NV centre was successful in determining values associated with superconductivity. Moreover, dynamical magnetic responses were also studied by Xu et al. [Citation65]. They used diamond chips to reveal the ac Meissner effect of thin-film and bulk-like Bi2Sr2CaCu2O
(BSCCO-2212) flakes (). Most importantly, the unusual ac magnetic response of the thin film was likely to be the thermally excited vortex-antivortex diffusive motion in the film. This work demonstrated that the NV centre can work not only with bulk samples, but also with thin films. Meanwhile, direct current (dc) and ac magnetic responses can be measured via appropriate protocols.
Figure 9. (a) ZFC-W and FC-C measurements in LuNi2B2C probed at the sample centre. The splitting verse temperature showed the Meissner effect, where Tc is found to be 16.6 ± 0.1 K. The inset was the ODMR spectrum. (b) The spatial FC profile at 100 Oe. The sample was located at and the Meissner expulsion was visible near the edge. The inset was the Zeeman splitting with decreasing temperature. Reproduced from Nusran et al., New J. Phys. 20, 043010 (2018). Copyright 2018 Author(s), licensed under a Creative Commons Attribution (CC BY) license. (c) ZFC measurements of
of Ba(Fe
Cox)2As2 at 4.5 K. A, B, C, and D represented four different points near the edge and all the Zeeman splitting agreed well. The inset was the averaged signal of ZS. The
Oe was determined from the sudden change. Reproduced with permission from Joshi et al., Phys. Rev. Appl. 11, 014035 (2019). Copyright 2019 American Physical Society. (d) Left: Calculated magnetic field distribution on top of a superconducting circular disk at 40 K (red curve) and 70 K (blue curve). Left: PL image of the BSSCO film at 40 and 70 K. Reproduced from Xu et al., Nano Lett. 19, 5697 (2019). Copyright 2019 Author(s), licensed under a Creative Commons Attribution (CC BY) license.
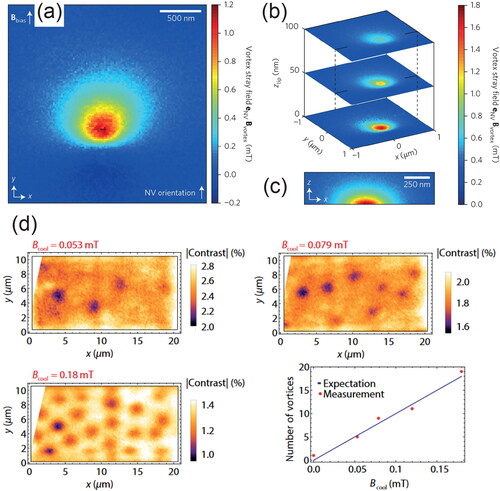
On the other hand, the vortex state is another exotic feature in superconductivity. Studying the vortex state provides valuable physics insight, especially on some fundamental length scales about superconductivity. Experimentally, the vortex can be imaged by using NV sensing. Several NV types of research works had already shown the capability of vortex imaging. Thiel et al. [Citation66] used scanning NV magnetometry, meaning that the NV centre is located at the apex of a nanopillar in a diamond cantilever, to probe vortex in nanoscale. They performed quantitative nanoscale magnetic imaging of a YBa2Cu3O (YBCO) sample. First, they cooled down the sample below the Tc with the presence of an applied magnetic field and measured the magnetic field of the sample. Thus, a 2 D mapping of the vortex was presented, as shown in . They then performed a 3 D scan of the vortex, showing the advantages of using scanning NV magnetometry to map the 3 D texture of the vortex, as shown in . From this result, they found that the underlying physics is closer to Pearl’s analytic model instead of the prevalent monopole approximation. The bulk penetration depth was determined to be
nm, which is consistent with previously reported value [Citation68, Citation69]. Moreover, Schlussel et al. [Citation67] performed wide-field imaging for studying vortex of a YBCO thin film. A diamond microslab was placed on top of a YBCO sample and the PL was collected by a CCD camera. The sample was field cooled below Tc and the 2 D map of the vortex was presented. They investigated the vortex formation under different applied magnetic fields. The number of vortex generated against applied magnetic field was verified by the equation
where
is the magnetic flux quantum,
is the applied magnetic field, and A is the investigated area (). Finally, the pinning effect due to disorder was observed. This pinning effect trapped magnetic flux even when the external fields were turned off, and the pinning was robust to maintain the same vortex patterns that were previously created.
Figure 10. (a) Image of the magnetic stray field from a single vortex obtained with the NV magnetometer. (b) 3 D reconstruction of the vortex obtained as in (a). (c) Vertical scan through the vortex stray field in the plane indicated in (b). Reproduced with permission from Thiel et al., Nat. Nanotechnol 11, 677 (2016). Copyright 2016 Springer Nature. (d) Three images of vortices that were taken for different magnetic fields presented during the cooling process. An increase in the number of vortices can be observed when the field is increased. The observed number of vortices agreed excellently with the expected number of vortices. Reproduced with permission from Schlussel et al., Phys. Rev. Appl. 10, 034032 (2018). Copyright 2018 American Physical Society.
Recent cutting-edge research works using the NV centre were focusing on quantum sensing under extreme conditions. These distinct techniques were developed to overcome several obstacles in high-pressure experiments. Three groups had shown different sensing protocols under extreme conditions for probing several interesting phenomena, including the Meissner effect, stress-field distribution, and magnetic phase transition [Citation9, Citation48, Citation54].
Yip et al. [Citation9] adopted diamond particles and confocal microscopy to probe the Meissner effect of a type II iron-based superconductor (BaFe2(AsP
)2). They spread 1 μm diamond particles over the sample and ODMR measurements were performed at different temperatures and pressures. From the vanishing of the sample’s diamagnetic response, the critical temperature Tc of the superconducting phase transition was extracted. As shown in , a T – P phase diagram was constructed and successfully benchmarked by cross-checking from the ac susceptibility of the sample, which was common for probing the bulk response [Citation70–72]. Moreover, they showed that an approximately 90-degree change of the magnetic field vector occurred right above the superconductor upon cooling below the Tc, picturizing the field expulsion from the superconductor. On the other hand, at each fixed pressure, they extracted the critical fields
and
construct the H – P phase diagram (), which is crucial for condensed matter physics. In particular,
is not trivial to be measured, so this work opened up a discussion of the superconducting gap function.
Figure 11. (a) The T – P phase diagram of the BaFe2(AsP
)2 sample measured by ac susceptibility and ODMR methods, showing good agreement between common method and the novel ODMR method. (b) The H – P phase diagram of the same sample measured by the ODMR method. This work opened up a discussion of the superconducting gap function. Reproduced withpermission from Yip et al., Science 366, 1355 (2019). Copyright 2019 American Association for the Advancement of Science. (c) The magnetization versus pressure of an iron bead sample. The expected hysteresis of the structural transition can be observed from the difference between increasing and decreasing pressure. (d) The evolution of the ODMR splitting versus temperature of a MgB2 sample. Reproduced with permission from Lesik et al., Science 366, 1359 (2019). Copyright 2019 American Association for the Advancement of Science. (e) Spatially resolved maps of the loading stress (left) and mean lateral stress (right), across the culet surface. A linecut along the white-dashed line of the two stresses is highlighted (bottom). These results agreed with the finite-element analysis. (f) Comparison of the full stress tensor along the dotted line at two different pressures. A noticeable pressure gradient was observed at higher pressure, meaning the pressure medium had entered the glassy phase. Reproduced with permission from Hsieh et al., Science 366, 1349 (2019). Copyright 2019 American Association for the Advancement of Science.
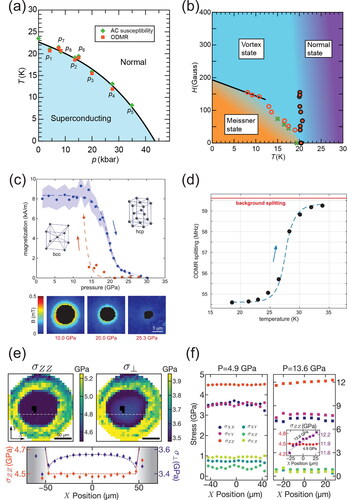
In contrast to using diamond particles and confocal microscopy, Lesik et al. [Citation54] performed, under high pressure, wide-field imaging using an implanted NV anvil. They probed the pressure-driven structural phase transition of iron (Fe) at room temperature. The hysteresis of this first-order transition was also demonstrated by measuring two different critical pressures upon compression and decompression of the DAC (). Besides, the Meissner effect in Magnesium diboride (MgB2) at low temperature was measured. Under a constant magnetic field of ∼ 1.8 mT, temperature-dependent of wide-field ODMR was measured upon warming up from 18 K to >30 K, and the Tc of the superconducting phase transition was extracted (). Their results were in good agreement with the previously reported data [Citation73].
Using a similar configuration, Hsieh et al. [Citation48] adopted an implanted NV anvil accompanied with a scanning confocal microscopy. They showcased the versatility of the NV centre by performing, under high pressure, NV sensing of stress and magnetic fields. Similar to Broadway et al. [Citation46], they first resolved the full stress tensor across the culet surface under pressure. They revealed that, after entering the glass transition, the emergence of a pressure gradient (). On the other hand, they revealed the magnetic transition, including the hysteresis of the structural transition, of Fe at room temperature. Furthermore, they constructed the magnetic P – T phase diagram of the rare-earth element Gd. These results showcased the versatility and robustness of the NV centre techniques. All these exciting developments provide powerful tools for research under high pressure.
5. Summary and outlook
In this review, we have discussed the principle of NV sensing, including sensing from the ESR spectrum, relaxometry, dynamic decoupling and noise spectroscopy. With these working principles in mind, we reviewed NV sensing in different working environments. In particular, we reviewed the applications on material research and novel techniques in the superconductivity research. These exciting research works reveal that the NV centre is one of the most powerful quantum sensors in modern research.
Besides so much progress, teams around the world are still developing new techniques, in sensing methods, sample processing and new applications. Recently, by fine-tuning the back-action from the weak measurements, it has been demonstrated the spectral resolution of single spin NMR can be as high as 3.8 Hz in ambient condition [Citation74, Citation75]. The low readout fidelity was a big problem for sensing with the NV centre. Recently, a robust readout scheme based on the spin selective charge state switching has been demonstrated with fidelity above 95% [Citation76, Citation77]. These two new methods pave new directions of using the NV centre as a sensor. For example, it was proposed that by using sequential weak measurement, one can detect a quantum object beyond the sensing limit of semi-classical methods [Citation78]. New devices have been designed to further enhance the field sensitivity. For example, ferrite flux concentrators were used to boost the magnetic field sensitivity to pico Tesla [Citation79, Citation80]. Recently, by coupling the NV centre with an AFM tip, electrical fields can be mapped out with high spatial resolution and field sensitivity [Citation81]. It can also manipulate the charge states of the NV centre for better quantum control. Besides condensed matter physics, with sensitivity enhanced, the NV centre can be used to detect exotic interactions and new particles, therefore make itself a tabletop high energy detection system [Citation82]. These advances will lead to a rich field of applications in quantum sensing.
Acknowledgments
K.O.H acknowledges financial support from the Hong Kong PhD Fellowship Scheme. S.Y. acknowledges financial supports from Hong Kong RGC (GRF/14304419), CUHK start-up grant and the Direct Grants.
Disclosure statement
No potential conflict of interest was reported by the author(s).
Additional information
Notes on contributors
Kin On Ho
Kin On Ho currently a PhD student in The Chinese University of Hong Kong, a recipient of Hong Kong PhD fellowship.
Yang Shen
Yang Shen currently a PhD student in The Chinese University of Hong Kong.
Yiu Yung Pang
Yiu Yung Pang currently a MPhil student in The Chinese University of Hong Kong.
Wai Kuen Leung
Wai Kuen Leung currently a bachelor student in The Chinese University of Hong Kong.
Nan Zhao
Nan Zhao currently an associate professor and division head in Beijing Computational Science Center.
Sen Yang
Sen Yang currently an assistant professor in The Chinese University of Hong Kong.
References
- Kasevich M, Chu S. Measurement of the gravitational acceleration of an atom with a light-pulse atom interferometer. Appl Phys B. 1992;54(5):321–332.
- Kominis I, Kornack T, Allred J, et al. A subfemtotesla multichannel atomic magnetometer. Nature. 2003;422(6932):596–599.
- Maiwald R, Leibfried D, Britton J, et al. Stylus ion trap for enhanced access and sensing. Nature Phys. 2009;5(8):551–554.
- Gleyzes S, Kuhr S, Guerlin C, et al. Quantum jumps of light recording the birth and death of a photon in a cavity. Nature. 2007;446(7133):297–300.
- Pfender M, Aslam N, Sumiya H, et al. Nonvolatile nuclear spin memory enables sensor-unlimited nanoscale spectroscopy of small spin clusters. Nat Commun. 2017;8(1):1.
- Horsley A, Appel P, Wolters J, et al. Microwave device characterization using a widefield diamond microscope. Phys Rev Appl. 2018;10(4):044039.
- Davis HC, Ramesh P, Bhatnagar A, et al. Mapping the microscale origins of magnetic resonance image contrast with subcellular diamond magnetometry. Nat Commun. 2018;9(1):1.
- Gruber A, Dräbenstedt A, Tietz C, et al. Scanning confocal optical microscopy and magnetic resonance on single defect centers. Science. 1997;276(5321):2012–2014. https://science.sciencemag.org/content/276/5321/2012.full.pdf.
- Yip KY, Ho KO, Yu KY, et al. Measuring magnetic field texture in correlated electron systems under extreme conditions. Science. 2019;366(6471):1355–1359. https://science.sciencemag.org/content/366/6471/1355.full.pdf.
- Dolde F, Fedder H, Doherty MW, et al. Electric-field sensing using single diamond spins. Nature Phys. 2011;7(6):459–463.
- Barson MSJ, Peddibhotla P, Ovartchaiyapong P, et al. Nanomechanical sensing using spins in diamond. Nano Lett. 2017;17(3):1496–1503. https://doi.org/10.1021/acs.nanolett.6b04544.
- Neumann P, Jakobi I, Dolde F, et al. High-Precision nanoscale temperature sensing using single defects in diamond. Nano Lett. 2013;13(6):2738–2742.
- Wang P, Chen S, Guo M, et al. Nanoscale magnetic imaging of ferritins in a single cell. Sci Adv. 2019;5(4):eaau8038. , https://advances.sciencemag.org/content/5/4/eaau8038.full.pdf.
- Doherty MW, Dolde F, Fedder H, et al. Theory of the ground-state spin of the NV − center in diamond. Phys Rev B. 2012;85(20):205203.
- Budker D, Romalis M. Optical magnetometry. Nature Phys. 2007;3(4):227–234.
- Taylor J, Cappellaro P, Childress L, et al. High-sensitivity diamond magnetometer with nanoscale resolution. Nature Phys. 2008;4(10):810–816.
- Wolf T, Neumann P, Nakamura K, et al. Subpicotesla diamond magnetometry. Phys Rev X. 2015;5(4):041001.
- Barry JF, Schloss JM, Bauch E, et al. Sensitivity optimization for NV-diamond magnetometry. Rev Mod Phys. 2020;92(1):015004.
- Shi F, Zhang Q, Wang P, et al. Single-protein spin resonance spectroscopy under ambient conditions. Science. 2015;347(6226):1135–1138.
- Van der Sar T, Casola F, Walsworth R, et al. Erratum: Nanometre-scale probing of spin waves using single electron spins. Nat Commun. 2015;6(1):1.
- Andrich P, Charles F, Liu X, et al. Long-range spin wave mediated control of defect qubits in nanodiamonds. Npj Quantum Inf. 2017;3(1):1.
- Viola L, Knill E, Lloyd S. Dynamical decoupling of open quantum systems. Phys Rev Lett. 1999;82(12):2417–2421.
- Yang W, Wang Z-Y, Liu R-B. Preserving qubit coherence by dynamical decoupling. Frontiers of Physics in China. 2011;6:2.
- Hahn EL. Spin echoes. Phys Rev. 1950;80(4):580–594.
- Childress L, Dutt MG, Taylor J, et al. Coherent dynamics of coupled electron and nuclear spin qubits in diamond. Science. 2006;314(5797):281–285.
- Schweiger A, Jeschke G. Principles of pulse electron paramagnetic resonance. UK: Oxford University Press on Demand, 2001.
- Naydenov B, Dolde F, Hall LT, et al. Dynamical decoupling of a single-electron spin at room temperature. Phys Rev B. 2011;83(8):081201.
- Souza AM, Álvarez GA, Suter D. Robust dynamical decoupling for quantum computing and quantum memory. Phys Rev Lett. 2011;106(24):240501.
- Zhao N, Hu J-L, Ho S-W, et al. Atomic-scale magnetometry of distant nuclear spin clusters via nitrogen-vacancy spin in diamond. Nature Nanotech. 2011;6(4):242–246.
- Zhao N, Honert J, Schmid B, et al. Sensing single remote nuclear spins. Nature Nanotech. 2012;7(10):657–662.
- Zhao N, Ho S-W, Liu R-B. Decoherence and dynamical decoupling control of nitrogen vacancy center electron spins in nuclear spin baths. Phys Rev B. 2012;85(11):115303.
- Steinert S, Ziem F, Hall L, et al. Magnetic spin imaging under ambient conditions with Sub-cellular resolution. Nat Commun. 2013;4(1):1607.
- Tetienne J-P, Hingant T, Rondin L, et al. Spin relaxometry of single nitrogen-vacancy defects in diamond nanocrystals for magnetic noise sensing. Phys Rev B. 2013;87(23):235436.
- Staudacher T, Shi F, Pezzagna S, et al. Nuclear magnetic resonance spectroscopy on a (5-Nanometer) 3 sample volume. Science. 2013;339(6119):561–563.
- Gaebel T, Domhan M, Popa I, et al. Room-temperature coherent coupling of single spins in diamond. Nature Phys. 2006;2(6):408–413.
- Kotler S, Akerman N, Glickman Y, et al. Single-ion quantum lock-in amplifier. Nature. 2011;473(7345):61–65.
- Cooper A, Magesan E, Yum H, et al. Time-resolved magnetic sensing with electronic spins in diamond. Nat Commun. 2014;5(1):1.
- Laraoui A, Dolde F, Burk C, et al. High-resolution correlation spectroscopy of 13C spins near a nitrogen-vacancy centre in diamond. Nat Commun. 2013;4(1):1651.
- Acosta VM, Bauch E, Ledbetter MP, et al. Diamonds with a high density of nitrogen-vacancy centers for magnetometry applications. Phys Rev B. 2009;80(11):115202.
- Balasubramanian G, Chan IY, Kolesov R, et al. Nanoscale imaging magnetometry with diamond spins under ambient conditions. Nature. 2008;455(7213):648–651.
- Maze JR, Stanwix PL, Hodges JS, et al. Nanoscale magnetic sensing with an individual electronic spin in diamond. Nature. 2008;455(7213):644–647.
- Mittiga T, Hsieh S, Zu C, et al. Imaging the local charge environment of Nitrogen-Vacancy centers in diamond. Phys Rev Lett. 2018;121(24):246402.
- Acosta VM, Bauch E, Ledbetter MP, et al. Temperature dependence of the Nitrogen-Vacancy magnetic resonance in diamond. Phys Rev Lett. 2010;104(7):070801.
- Chen X-D, Dong C-H, Sun F-W, et al. Temperature dependent energy level shifts of nitrogen-vacancy centers in diamond. Appl Phys Lett. 2011;99(16):161903. doi: 10.1063/1.3652910
- Doherty MW, Acosta VM, Jarmola A, et al. Temperature shifts of the resonances of the NV − center in diamond. Phys Rev B. 2014;90(4):041201.
- Broadway DA, Johnson BC, Barson MSJ, et al. Microscopic imaging of the stress tensor in diamond using in situ quantum sensors. Nano Lett. 2019;19(7):4543–4550. https://doi.org/10.1021/acs.nanolett.9b01402.
- Barfuss A, Kasperczyk M, Kölbl J, et al. Spin-stress and spin-strain coupling in diamond-based hybrid spin oscillator systems. Phys Rev B. 2019;99(17):174102.
- Hsieh S, Bhattacharyya P, Zu C, et al. Imaging stress and magnetism at high pressures using a nanoscale quantum sensor. Science. 2019;366(6471):1349–1354. https://science.sciencemag.org/content/366/6471/1349.full.pdf.
- Ho KO, Leung MY, Pang YY, et al. InSitu studies of stress environment in amorphous solids using negatively charged nitrogen vacancy (NV – ) centers in nanodiamond. ACS Appl Polym Mater. 2021;3(1):162–170. https://doi.org/10.1021/acsapm.0c00964.
- Ho KO, Leung MY, Jiang Y, et al. Probing local pressure environment in anvil cells with Nitrogen-Vacancy (N- V−) centers in diamond. Phys Rev Appl. 2020;13(2):024041.
- Doherty MW, Struzhkin VV, Simpson DA, et al. Electronic properties and metrology applications of the diamond NV − center under pressure. Phys Rev Lett. 2014;112(4):047601.
- Steele LG, Lawson M, Onyszczak M, et al. Optically detected magnetic resonance of nitrogen vacancies in a diamond anvil cell using designer diamond anvils. Appl Phys Lett. 2017;111(22):221903. https://doi.org/10.1063/1.5004153.
- Ivády V, Simon T, Maze JR, et al. Pressure and temperature dependence of the zero-field splitting in the ground state of NV centers in diamond: a first-principles study. Phys Rev B. 2014;90(23):235205.
- Lesik M, Plisson T, Toraille L, et al. Magnetic measurements on micrometer-sized samples under high pressure using designed NV centers. Science. 2019;366(6471):1359–1362. https://science.sciencemag.org/content/366/6471/1359.full.pdf.
- Bertelli I, Carmiggelt JJ, Yu T, et al. Magnetic resonance imaging of spin-wave transport and interference in a magnetic insulator. Sci Adv. 2020;6(46):eabd3556. , https://advances.sciencemag.org/content/6/46/eabd3556.full.pdf.
- Lee-Wong E, Xue R, Ye F, et al. Nanoscale detection of magnon excitations with variable wavevectors through a quantum spin sensor. Nano Lett. 2020;20(5):3284–3290. https://doi.org/10.1021/acs.nanolett.0c00085.
- Dubs C, Surzhenko O, Linke R, et al. Sub-micrometer yttrium iron garnet LPE films with low ferromagnetic resonance losses. J Phys D: Appl Phys. 2017; 50(20):204005.
- Zhou BB, Jerger PC, Lee K-H, et al. Spatiotemporal mapping of a photocurrent vortex in monolayer MoS2 using diamond quantum sensors. Phys Rev X. 2020;10(1):011003.
- Xia K, Liu C-F, Leong W-H, et al. Nanometer-precision non-local deformation reconstruction using nanodiamond sensing. Nat Commun. 2019;10(1):3259.
- Fujiwara M, Shikano Y, Tsukahara R, et al. Observation of the linewidth broadening of single spins in diamond nanoparticles in aqueous fluid and its relation to the rotational brownian motion. Sci Rep. 2018;8(1):14773.
- Bouchard L-S, Acosta VM, Bauch E, et al. Detection of the meissner effect with a diamond magnetometer. New J Phys. 2011;13(2):025017.
- Lim H-J, Byrne JG. Improvement of properties of BSCCO superconductor tapes with thermal processing. Metall and Materi Trans B. 1997;28(3):425–428.
- Nusran NM, Joshi KR, Cho K, et al. Spatially-resolved study of the meissner effect in superconductors using NV-centers-in-diamond optical magnetometry. New J Phys. 2018;20(4):043010.
- Joshi K, Nusran N, Tanatar M, et al. Measuring the lower critical field of superconductors using Nitrogen-Vacancy centers in diamond optical magnetometry. Phys Rev Appl. 2019;11(1):014035.
- Xu Y, Yu Y, Hui YY, et al. Mapping dynamical magnetic responses of ultrathin Micron-Size superconducting films using Nitrogen-Vacancy centers in diamond. Nano Lett. 2019;19(8):5697–5702. https://doi.org/10.1021/acs.nanolett.9b02298.
- Thiel L, Rohner D, Ganzhorn M, et al. Quantitative nanoscale vortex imaging using a cryogenic quantum magnetometer. Nature Nanotech. 2016;11(8):677–681.
- Schlussel Y, Lenz T, Rohner D, et al. Wide-Field imaging of superconductor vortices with electron spins in diamond. Phys Rev Appl. 2018;10(3):034032.
- Auslaender OM, Luan L, Straver EWJ, et al. Mechanics of individual isolated vortices in a cuprate superconductor. Nature Phys. 2009;5(1):35–39.
- Wölbing R, Schwarz T, Müller B, et al. Optimizing the spin sensitivity of grain boundary junction nanoSQUIDs—towards detection of small spin systems with single-spin resolution. Supercond Sci Technol. 2014;27(12):125007.
- Klintberg LE, K. Goh S, Kasahara S, et al. Chemical pressure and physical pressure in BaFe 2 (as 1- x P x ) 2. J Phys Soc Jpn. 2010;79(12):123706. https://doi.org/10.1143/JPSJ.79.123706.
- Yip KY, Chan YC, Niu Q, et al. Weakening of the diamagnetic shielding in FeSe1 − xSx at high pressures. Phys Rev B. 2017;96(2):020502.
- Alireza PL, Julian SR. Susceptibility measurements at high pressures using a microcoil system in an anvil cell. Rev Sci Instrum . 2003;74(11):4728–4731. https://doi.org/10.1063/1.1614861.
- Buzea C, Yamashita T. Review of the superconducting properties of MgB 2. Supercond Sci Technol. 2001;14(11):R115–R146.
- Pfender M, Wang P, Sumiya H, et al. High-resolution spectroscopy of single nuclear spins via sequential weak measurements. Nat Commun. 2019;10(1):594.
- Cujia KS, Boss JM, Herb K, et al. Tracking the precession of single nuclear spins by weak measurements. Nature. 2019;571(7764):230–233.
- Irber DM, Poggiali F, Kong F, et al. Robust all-optical single-shot readout of nitrogen-vacancy centers in diamond. Nat Commun. 2021;12(1):532.
- Zhang Q, Guo Y, Ji W, et al. High-fidelity single-shot readout of single electron spin in diamond with spin-to-charge conversion. Nat Commun. 2021; 12(1):1529.
- Wang P, Chen C, Liu R-B. Classical-Noise-Free sensing based on quantum correlation measurement*. Chinese Phys Lett. 2021;38(1):010301.
- Fescenko I, Jarmola A, Savukov I, et al. Diamond magnetometer enhanced by ferrite flux concentrators. Phys Rev Research. 2020;2(2):023394.
- Xie Y, Yu H, Zhu Y, et al. A hybrid magnetometer towards femtotesla sensitivity under ambient conditions. Science Bulletin. 2021;66(2):127–132.
- Bian K, Zheng W, Zeng X, et al. Nanoscale electric-field imaging based on a quantum sensor and its charge-state control under ambient condition. Nat Commun. 2021;12(1):2457.
- Rong X, Wang M, Geng J, et al. Searching for an exotic spin-dependent interaction with a single electron-spin quantum sensor. Nat Commun. 2018;9(1):739.