
 ?Mathematical formulae have been encoded as MathML and are displayed in this HTML version using MathJax in order to improve their display. Uncheck the box to turn MathJax off. This feature requires Javascript. Click on a formula to zoom.
Abstract
Ferri/ferro-cyanide ([Fe(CN)6]3−/4−) redox couple has been extensively used as a benchmark to assess electrocatalytic degradation capability of boron-doped diamond (BDD) electrodes. However, the [Fe(CN)6]3−/4− is far more sensitive to the surface terminal groups of BDD surface than the other factors (e.g. surface morphology and electrode configuration) that are closely related to electrocatalytic degradation properties. Thus, inconsistency exists while correlating the degradation properties of BDD with electrochemical properties determined from ferri/ferro-cyanide redox couple. Herein, an exemplar pollutant, reactive blue 19 (RB-19), was electrochemically degraded using various terminated BDD electrodes, including hydrogen-terminated (H-BDD), oxygen-terminated (O-BDD) and porous oxygen-terminated BDDs (OE-BDD), obtained via cathodic and anodic polarization as well as oxygen plasma etching, respectively. Surprisingly, OE-BDD with the lower heterogeneous electron transfer rate constant for [Fe(CN)6]3−/4− showed a better electrocatalytic degradation capability toward RB-19, indicating the inconsistency for qualitatively evaluating degradation properties according to the kinetic parameters extracted from [Fe(CN)6]3−/4− redox system.
1. Introduction
Conductive diamond showed diverse distinctive properties such as a wide potential window (4.6 V in organic solutions [Citation1]), high biocompatibility [Citation2], and exceptional electrochemical stability, due to the existence of saturated sp3-hybridized C–C bond in the diamond crystal lattice, which has been extensively used in electro-analysis, electro-catalytic oxidative degradation, and electrical energy storage [Citation1,Citation3–6]. The electrocatalytic degradation capability of diamond depend on many factors, such as the boron-doping concentration [Citation7,Citation8], the ratio of sp2/sp3 [Citation9], surface termination [Citation10], and micro/nanometer-sized surface structure of boron-doped diamond (BDD). The highly doped BDD thin films usually show better electrochemical activity than the lowly doped ones due to the increased electrical conductivity [Citation11], and so does the addition of the impurity sp2 phase (i.e. graphite phase). In addition, constructing porous morphology on the surface of BDD is beneficial to increasing its specific surface area, thereby increasing the number of reaction sites [Citation12].
The ferri/ferro-cyanide redox couple ([Fe(CN)6]3−/4−) has been widely used to assess electrochemical properties of BDD electrodes, including heterogeneous kinetic rate constant (k0), the reversibility/irreversibility behavior, the charge transfer resistance, and electrochemically active surface area (ECSA) if completely or nearly reversible [Citation13]. For instance, k0 can be extracted from the relation of the peak currents, the peak potential separation (ΔEp) and the scan rate according to the Nicholson method [Citation14]. Reversible redox reactions are characterized by high rates of charge transfer (i.e. k0 >10−1 cm s−1), and k0 for quasi-reversible reactions ranges between 10−1 and 10−5 cm s−1, and <10−5 cm s−1 for irreversible systems. Alternatively, for one-electron transfer reaction, the relative reversibility behavior can also be simply assessed by the ΔEp values in which the reaction is considered as reversible if ΔEp is around 59 mV at 25 °C, irreversible if larger than 200 mV, and quasi-reversible if between them [Citation13].
Owing to its easy access to abundant information with respect to electrochemical properties of the underlying electrode, the ferri/ferro-cyanide redox system was widely reported to characterize the electrochemical activity of BDD electrodes and tentatively establish the relation between activities and electrochemical degradation properties. A higher k0 usually corresponds to the faster electron transfer rate and a higher ECSA leads to the larger electroactive sites, thereby resulting in the better electrocatalytic performance, which is easy for granted to observe the better electrocatalytic degradation performance for the target organic compound of an interest. For instance, previous reports extracted the key electrochemical properties of different BDD electrodes from the ferri/ferro-cyanide redox system according to Randles-Sevcik equation in which the slope of a linear relation of peak currents versus scan rates yields the resulting ECSA. They attributed the improved electrocatalytic degradation performance to the increased ECSA of those BDD electrodes which could provide more electroactive sites to degrade the organic compound (e.g. reactive blue-19 and tetracycline) [Citation15,Citation16]. Recently, Li et al. utilized the similar redox system to pick up the optimal BDD electrodes grown on the Ta substrate to carry out electrocatalytic degradation of organic compounds.
However, the electrochemical behavior of [Fe(CN)6]3−/4− is far more sensitive to the surface functional groups of BDD surface than the other factors such as surface morphology, electrode configuration and charge transfer resistance, which are closely related to electrocatalytic degradation performance. Compared to the oxygen-terminated BDD (O-BDD), the hydrogen-terminated BDD (H-BDD) presents faster electron transfer kinetics of Fe(CN)64−/3− than the former [Citation17]. Indeed, when the O-BDD transferred to H-BDD via a cathodic pretreatment by applying a bias potential of −3.0 V for 30 min, the H-BDD showed the increased intensity of peak current accompanied by a narrowed peak potential separation [Citation18]. This change of BDD reactivity is closely related to surface functional groups since the oxygen-containing groups would repel negatively charged substances (i.e. Fe(CN)63−/4−) due to electrostatic repulsion and simultaneously, partially block adsorption sites and inhibit the transfer pathway of electrons, thereby reducing electrocatalytic properties [Citation19,Citation20]. Thus, a question arises whether or not the redox couple [Fe(CN)6]3−/4− is reliable to act as a standard to select the optimal electrodes which are anticipated to exhibit the optimal electrocatalytic degradation performance, owing to the fact that the redox couple [Fe(CN)6]3−/4− is sensitive to the surface functional groups. Herein, we designed three BDD films with equivalent geometric surface area and various surface functional groups via polarization treatment and oxygen plasma etching and investigated their electrochemical behaviors for the Fe(CN)63−/4− redox system as well as respective electrocatalytic degradation performance toward a typical dye pollutant (i.e. reactive blue 19 (RB-19)).
2. Experimental parameters
2.1 Chemical reagents
Potassium chloride, KCl (≥99.5%), sodium sulfate, Na2SO4 (≥99.0%) were purchased from Sinopharm Chemical Reagent Co., Ltd., and K3Fe(CN)6 (≥99.5%) was purchased from Tianjin Guangfu Fine Chemical Co. Acetone, H2SO4 (95%–98%) were purchased from Hengyang Kaixin Chemical Reagent Co., Ltd. Deionized water with a resistivity level of 18.25 MΩ·cm−1 was used throughout the experiments.
2.2 Characterization
The obtained samples were characterized by scanning electron microscope (Nova Nano SEM 230), Raman spectroscopy (LabRAM HR800), X-ray diffractometry (D/max 2550), Contact Angle Meter (SDC-100, China Shengding), X-ray photoelectron spectroscopy (XPS, Thermo ESCA LAB spectrometer), and Electrochemical workstation (CHI660E, Shanghai Chenhua). A three-electrode system was used for electrochemical measurement during which a BDD electrode acts as the working electrode, Pt sheet (30 × 30 × 1 mm3) as the counter electrode was, and Ag/AgCl (Gaoss Union, Wuhan Gaoss Union Technology) as the reference electrode.
2.3 Preparation of BDD electrodes with different surface functional groups
Hot-filament chemical vapor deposition (HF-CVD) was used to grow BDD films on Si substrate (20 × 25 × 1 mm3). The growth temperature was set as 800 °C and the pressure was maintained at 3 KPa with mixed gaseous flow ratios of H2:CH4:B2H6 being 98:3:0.6, similar to previous works [Citation21]. H-BDD electrode was obtained by cathodic polarization at a bias voltage of −3 V vs Ag/AgCl for 900 s in 0.5 M H2SO4 solution, while O-BDD electrode by anodic polarization at a bias voltage of +3 V Ag/AgCl. Oxygen plasma etching was used to etch the O-BDD to form the porous morphology, denoted as OE-BDD. The etching temperature levelled off at 800 °C and the time was set as 2 min, similar to our recent work [Citation21].
2.4 Water degradation experiment
Electrocatalytic degradation of 100 mg L−1 reactive blue 19 was conducted in a 500 mL container with 0.5 A direct-current power, using BDD electrodes (size of 20 × 25 × 1 mm3) as the anode and a stainless steel sheet (20 × 25 × 1 mm3) as the cathode. The distance between the two electrodes during the treatment was 1 cm. The supporting electrolyte was 0.1 mol/L Na2SO4 and the total degradation time was 120 min. The experiment was under constant stirring with a speed of 300 rpm/min.
2.5 Evaluation of water treatment
2.5.1 Chromaticity removal rate
The absorbance of RB-19 in the visible region at a maximum absorption wavelength of 595.5 nm was measured with an ultraviolet-visible spectrophotometer (UV-8000S, Metash), and the color removal of the solution (color removal) was calculated using the following equation [Citation22]:
(1)
(1)
Where t is the degradation time (s), A0 and At are the initial absorbance of RB-19 at the maximum wavelength in the visible region and the absorbance at the moment of degradation t (a.u.).
2.5.2 COD removal rate
The test solution was mixed with COD reference reagent and placed in DRB200 digestion reactor (HACH, USA) for high temperature digestion, and then the DR3900 (HACH) water quality detector/COD heavy metal tester was used to detect COD in the solution, and the following equation was used to calculate the removal rate of COD and the current efficiency [Citation22].
(2)
(2)
where COD0 is the initial COD value of organic matter (mg L−1), CODt is the COD value of organic matter at degradation t (mg L−1); ΔCOD is the change in COD of active blue 19 during degradation (mg L−1) [Citation23];
(3)
(3)
where F is Faraday’s constant (96,487C mol−1), Vs is the volume of solution (L), I is the applied current (A); 8 is the equivalent mass of oxygen (g/eq−1), and t is the electrolysis time (s).
2.5.3 Energy consumption of the degradation process EC
where EC is the energy consumption of the degradation process (kW·h·m−3), Ecell is the average value of the degradation voltage (V), I is the current value (A), and t is the degradation time (h) [Citation15].
3. Results and discussion
3.1 Morphology and structure characterization
The BDD electrodes were subjected to polarization and oxidation etching treatments, respectively, and the SEM images are shown in . The H-BDD and O-BDD electrodes present a uniform and compact polycrystalline structure with the size of the crystal grains of around 2–4 µm with clear grain boundaries, and the grain shape of the diamond almost remains intact (). The surface morphology of the O-BDD and H-BDD was similar to that of the as-deposited BDD film sample (see Figure S1), indicating that the polarization treatment did not change the electrode morphology. In contrast, the surface morphology of OE-BDD changed significantly with dense etched pits while the edges of BDD remain clear (), formed by the reaction between oxygen and C–C bonding during oxygen plasma etching [Citation24,Citation25]. The porous surface morphology of BDD is consistent with this work by Liu et al. [Citation21], during which the BDD films after oxidation etched presented porous micrography and a larger specific surface area than the unetched sample.
Figure 1. Characterization of the surface morphology and phase composition of BDD films. SEM images of H-BDD (a), O-BDD (b), OE-BDD (c), and the enlarged partial enlarged drawing of OE-BDD(d). The XRD (e) and Raman spectra (f) of electrodes.
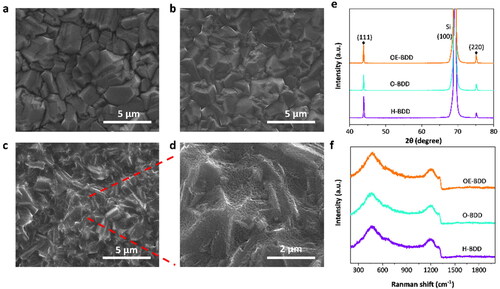
shows the XRD patterns of the three BDD electrodes. There is an apparent diffraction peak of diamond (111) and weak peaks of (220) crystal planes at 2θ = 43.8° and 76°, indicating the BDD samples are mainly (111) oriented. Considering the important effect of B-doping concentration on the catalytic properties of diamond, we characterized the Raman spectra of OE-BDD, O-BDD, and H-BDD. The characteristic peak of diamond appearing around 1332 cm−1 was observed on the three BDD thin films (), and there are no obvious graphite peaks around 1350 and 1580 cm−1 [Citation26], reflecting that all electrodes have good diamond quality. This is because oxygen plasma etching rate is faster for sp2 carbon than sp3 phase and therefore the former is removed during the oxygen plasma process. We calculated the density of doped boron ([B]) of BDD films from the peak wavenumber at around 400–600 cm−1 using the formula [Citation27], [B] = 8.44 × 1030 × exp (−0.048 W) (cm−3), in which W is the peak wavenumber of the characteristic peak of B in cm−1. The peak wavenumber of OE-BDD, O-BDD, and H-BDD were 460.18, 461.38, and 459.51 cm−1, respectively, found by a Lorentzian fitting line, as shown in Figure S2. Thus, [B] of three BDD electrodes was calculated to be 2.15 × 10²¹, 2.03 × 10²¹, and 2.22 × 1021 cm−3, respectively. The results above show that the BDD electrodes both had metal conductivity and a similar ratio of sp2/sp3.
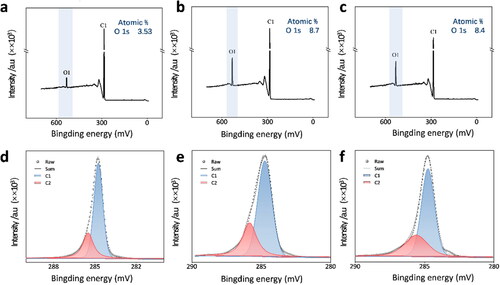
To obtain information about the abundance of C–O bonds on BDD surface, XPS measurements were performed on BDD electrodes. show the O atom% of H-BDD (3.53%) is far less than O-BDD (8.7%). That is because the abundance of C–H bonds would increase and that of C–O bonds decreases with greater negative potential (−3 V) [Citation28]. The mechanism for the hydrogenation of BDD thin films by cathodic polarization treatment was proposed by Einaga [Citation28]. The process of cathodic polarization could generate hydrogen atoms to abstracted the C–O bonds, resulting in the creation of dangling bonds on the BDD surface, and the dangling bonds would react with the hydrogen to generate new C–H bonds [Citation28]. The O atom% of OE-BDD (8.4%) is similar to that of O-BDD (8.7%), that because the as-deposited BDD surface covered with C–H bonds can be oxygenated by atomic oxygen during the oxygen plasma etching process. illustrates the XPS spectra of C1s peak of three BDD samples. Two main peak components, C1 peak at 284.7 eV, and C2 peak at 285.5 eV are observed, which are attributed to sp3 C–C bond from BDD [Citation29,Citation30], C–O bonds at the grain boundaries on the electrode surface [Citation31], respectively. As show in the , there are more C–O bonds on OE-BDD and O-BDD than on H-BDD.
Figure 2. XPS spectra of (a) H-BDD, (b) O-BDD, and (c) OE-BDD. C 1s peak of XPS spectra of the (d) H-BDD, (e) O-BDD, and (f) OE-BDD.
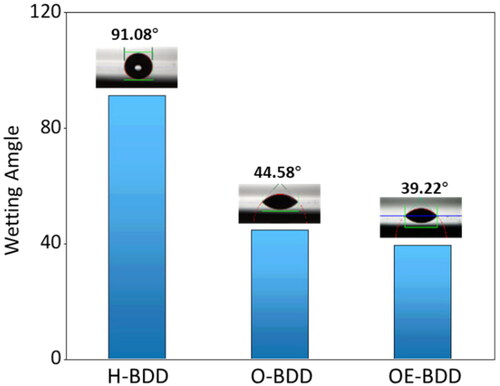
The O-terminal can interact with the hydroxide bond in the water molecule to increase the surface energy, thus making the surface tends to be hydrophilic [Citation32,Citation33]. The wettability of the BDD films was compared to further characterize surface C-O coverage. It was found that the H-BDD was hydrophilic and had a wetting Angle (WA) of 91.03°, while WA of the BDD films after anodization and oxygen plasma etching were 44.57° and 39.22°, respectively (). The results indirectly demonstrated the abundance of C − O bonds increases under high anodic polarization current density and oxygen plasma treatment.
Figure 3. Histogram of the wetting angle of (a) H-BDD, (b) O-BDD, and (c) OE-BDD.
3.2 Electrochemical characterization
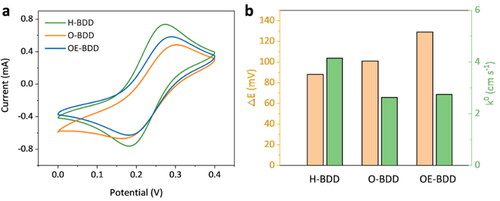
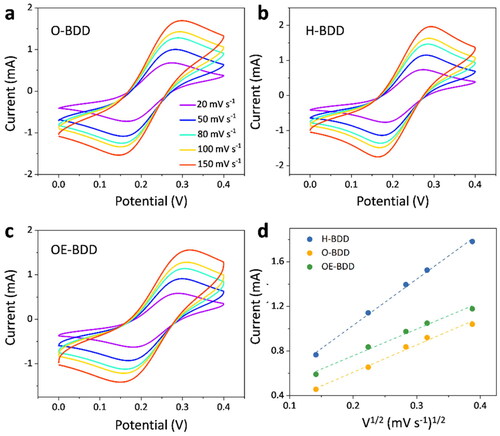
The cyclic voltammogram (CV) curves are commonly used to investigate the electrochemical performance of the electrodes in the [Fe(CN)6]3−/4− redox couple [Citation34]. Compare the CV of three BDD electrodes at 20 mV s−1 in a solution containing 1 mM K3Fe(CN)6 (), the anodic peak potential of H-BDD is more negative than O-BDD and OE-BDD, which indicates that the electron transfer of K3Fe(CN)6 at O-terminated BDD electrodes required larger driving force. Besides, the H-BDD has the largest oxidation peak intensity of 0.74 mA, 1.53 times the OE-BDD (0.48 mA) and 1.26 times the O-BDD (0.59 mA) (), showing that the H-BDD films had higher electrochemical activity than the other two in the ferri/ferro-cyanide system. The peak potential separation (ΔEp) of redox reactions observed at the OE-BDD is 41 mV larger than that H-BDD (), indicating the poor reversibility of the O-terminated BDD electrode [Citation35].
Figure 4. (a) CV curves of different BDD electrodes in 1 mM K3Fe(CN)6 + 0.1 M KCl solution at a scan rate of 20 mV s−1; (b) the column diagram of three electrodes to compare their kinetic parameters.
shows the CV from three modified BDD electrodes in 1 mM K3Fe(CN)6 with 0.1 M KCl solution as the supporting electrolyte at various scan rates. As the scan rate increases, the oxidation peak potential of three electrodes moves in the positive potential (). Meanwhile, the peak currents are linearly proportional to the square root of scan rate.
Figure 5. (a–c) CV diagram of electrodes in 1 mM K3Fe(CN)6 + 0.1 M KCl solution at different scan rates. (d) The relation between the oxidative peak current of three respective electrodes and the square root of scan rate, v1/2.
Then, we quantitatively calculate the heterogeneous kinetic constant (k0) of O-BDD, H-BDD, and O-BDD films according to the Nicholson method [Citation14], using EquationEquations (5(5)
(5) , Equation6)
(6)
(6) .
(5)
(5)
(6)
(6)
where Ψ is Nicholson’s kinetic parameter dependent on ΔEp in mV (EquationEquation (6))
(6)
(6) [Citation36]. n is the number of electrons transferred in the oxidation/reduction process (here, n = 1), R is the universal gas constant and T is the temperature. According to the plot of Ψ and
, the H-BDD had the fastest electron transfer among these electrodes due to its maximum slope (see ). According to the linear calibration relations (Ψ = 0.0041 ×
- 0.044 (R2 = 0.994)), the k0 values for ferri/ferro-cyanide at H-BDD was 4.1 × 10⁻³ cm s−1. While k0 at O-BDD (Ψ = 0.0026 ×
− 0.001 (R2 = 0.994)) and OE-BDD (Ψ = 0.0027 ×
− 0.07 (R2 = 0.998)) has lower values of 2.6 × 10⁻³ and 2.7 × 10⁻³ cm s−1, respectively (). The decreased k0 found at O-BDD and OE-BDD might be because oxygenated surface exhibited thicker depletion layer than hydrogenated surface [Citation37] and O sites had electrostatic repulsion to the Fe(CN)63−/4−, preventing it from adsorbing on the electrode surface [Citation20], and thus inhibiting the electron transfer between the redox group and BDD surface.
Figure 6. The plot of Ψ Versus [πDmvF/RT]1/2 for the reduction of 1 mmol K3Fe(CN)6 in 0.1 M KCl solution with three BDD electrodes.
![Figure 6. The plot of Ψ Versus [πDmvF/RT]1/2 for the reduction of 1 mmol K3Fe(CN)6 in 0.1 M KCl solution with three BDD electrodes.](/cms/asset/e5c6429a-09e3-4341-a4b0-850e51c41a36/tfdi_a_2078168_f0006_c.jpg)
3.3 Electrocatalytic degradation of organic wastewater
From the above discussion, one can know that H-BDD exhibits better electrical activity in potassium ferricyanide system compared to O-BDD and OE-BDD. To compare the catalytic activity of the three electrodes in real wastewater degradation, we used RB-19 as a simulated dye to test the electrocatalytic performance of the three BDD electrodes. shows the UV–Vis test results of electrochemical oxidation of RB-19 with H-BDD, O-BDD, and OE-BDD electrodes, respectively. There are three characteristic peaks of UV–Vis spectrum from original Reactive Blue 19. The maximum characteristic peak (λM = 596 nm) shows the conjugated chromogenic group of RB-19, which can quantitatively reflect the decolorization of RB-19 [Citation36]. From , the characteristic peaks of Reactive Blue 19 decrease with the prolongation of degradation time, which presents that the characteristic structure of the Reactive Blue 19 molecule is gradually destroyed in the degradation process. The removal of RB-19 H-BDD, O-BDD, and OE-BDD electrodes reached 31.68%, 54.89%, and 87.95%, respectively, after 30 min of degradation (). Compared with the UV–Vis spectra of H-BDD and O-BDD electrodes for degradation of RB-19, the removal rate of RB-19 on the OE-BDD electrode was the fastest. That means the OE-BDD had the best catalyst performance for RB-19 oxidation among the three electrodes.
Figure 7. (a–c) The UV-Vis spectra of the three BDD electrodes for degradation of reactive blue 19 at different times. The degradation of RB-19 by the three BDD electrodes: (d) chromaticity removal rate with time, (e) energy consumption versus COD removal rate, and (f) COD removal rate plot versus current efficiency plot for the degradation of RB-19 by three BDD electrodes.
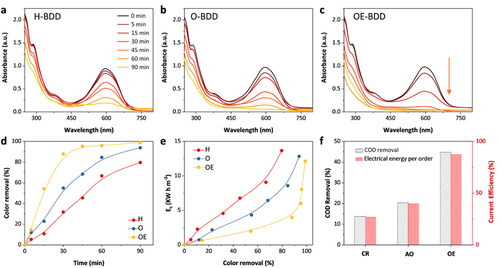
To further confirm the electrocatalytic activity of three BDD electrodes, we compared the chemical oxygen demand (COD) removal rate of the electrodes. shows a plot of energy consumption versus COD removal rate. The COD removal of H-BDD, O-BDD, and OE-BDD within 90 min were 13.75%, 20.62%, and 44.7%, respectively. The total COD removal rate of the OE-BDD electrode was increased by 3.25 times and the current efficiency was increased by 1.78 times compared to the H-BDD electrode. Besides, the OE-BDD electrode required the lowest energy consumption at the same COD removal rate (see in ). The results above indicated the OE-BDD had the best electrocatalytic activity, followed by O-BDD, and finally H-BDD. OE-BDD electrodes are treated by oxygen plasma etching. The best degradation performance of OE-BDD is due to the increased specific surface area after oxygen etched. During the etching process, a large number of chemically active oxygen atoms in the oxygen plasma occupy the dangling bonds of carbon atoms and react with them to form CO or CO2 [Citation38], thus forming a hole structure (as shown in ). Although, as shown in , the electrochemical polarization treatment does not change the surface morphology of the BDD electrode. So the OE-BDD has a larger specific surface area compared to the O-BDD, H-BDD electrodes, increasing the contact area between wastewater and electrode, providing more sites to generate hydroxyl radicals (•OH) for RB-19 degradation. Compared to H-BDD, O-BDD had better degradation performance, possibly attributed to its hydrophilic surface. The organic degradation relies on the extent of •OH production via water discharge on the surface of the electrode [Citation39], and the hydrophilic of surface is beneficial to the adsorption of water molecules on the electrode surface
It is noteworthy that H-BDD had the worst electrocatalytic oxidation performance, while one exhibited largest electrical activity in Fe(CN)63−/4− system compared to O-BDD and OE-BDD, which contradicts each other. This is because the Fe(CN)63−/4− redox probe is extremely sensitive to the surface chemistry, and the O end group can inhibit its electron transfer, thus shielding the effect of the micro-nano structure on the electrochemical properties of the BDD electrode. Therefore, it is vitally important when measuring electrochemical performance to carefully assess the surface chemical property.
4. Conclusion
Ferri/ferro-cyanide redox couple has been widely used as a benchmark to evaluate the degradation ability of BDD electrodes. Since the [Fe(CN)6]3−/4− is far more sensitive to the surface terminal groups of BDD surface than the other factors (e.g. surface morphology and electrode configuration) relevant to electrocatalytic degradation properties, there exists inconsistency while correlating the degradation properties of BDD with electrochemical properties determined from ferri/ferro-cyanide redox couple. The experimental results herein demonstrated that the OE-BDD with the slower heterogeneous kinetic rate constant (2.7 × 10⁻³ versus 4.1 × 10⁻³ cm s−1 for the H-BDD) showed the better electrocatalytic degradation capabilities toward RB-19. The total COD removal rate of the OE-BDD electrode was increased by 3.25 times that of the H-BDD electrode and the current efficiency was increased by 1.78 times. Our results indicate that ferri/ferro-cyanide redox couple could not be the only determining factor to assess the electrocatalytic degradation capabilities of electrodes in wastewater treatment. More redox systems, such as ruthenium hexamine, is suggested to be considered as the assessment criterion.
Funding
We gratefully acknowledge the National Key Research and Development Program of China (No. 2021YFB3701800, No. 2016YFB0301400), the National Natural Science Foundation of China (No. 52071345, No. 51874370), the Province Key Research and Development Program of Guangdong (No. 2020B010185001). Dr Hangyu Long acknowledges the funding from Guangdong Provincial Basic and Applied Basic Research Foundation of China (Grant No. 2019A1515110934), Guangdong Provincial Key Laboratory of Modern Surface Engineering Technology (Grant No. 2020B1212060049).
Disclosure statement
No potential conflict of interest was reported by the authors.
References
- Yang N, Yu S, Macpherson JV, et al. Conductive diamond: synthesis, properties, and electrochemical applications. Chem Soc Rev. 2019;48(1):157–204. doi:10.1039/c7cs00757d
- Chen X, Zhang W. Diamond nanostructures for drug delivery, bioimaging, and biosensing. Chem Soc Rev. 2017;46(3):734–760. doi:10.1039/c6cs00109b
- Baluchová S, Daňhel A, Dejmková H, et al. Recent progress in the applications of boron doped diamond electrodes in electroanalysis of organic compounds and biomolecules: a review. Anal Chim Acta. 2019;1077:30–66. doi:10.1016/j.aca.2019.05.041
- Deng Z, Long H, Wang Y, et al. Template-free synthesis of millimeter-scale carbon nanorod arrays on boron-doped diamond with superior glucose sensing performance. Appl Surf Sci. 2022;572:151468. doi:10.1016/j.apsusc.2021.151468
- Li H, Zhou K, Cao J, et al. A novel modification to boron-doped diamond electrode for enhanced, selective detection of dopamine in human serum. Carbon. 2021;171:16–28. doi:10.1016/j.carbon.2020.08.019
- Deng Z, Long H, Wei Q, et al. High-performance non-enzymatic glucose sensor based on nickel-microcrystalline graphite-boron doped diamond complex electrode. Sens Actuat BChem. 2017;242:825–834. doi:10.1016/j.snb.2016.09.176
- Baluchova S, Taylor A, Mortet V, et al. Porous boron doped diamond for dopamine sensing: effect of boron doping level on morphology and electrochemical performance. Electrochim Acta. 2019;327:135025. doi:10.1016/j.electacta.2019.135025
- Holt KB, Bard AJ, Show Y, et al. Scanning electrochemical microscopy and conductive probe atomic force microscopy studies of hydrogen-terminated boron-doped diamond electrodes with different doping levels. J Phys Chem B. 2004;108(39):15117–15127. doi:10.1021/jp048222x
- Garcia-Segura S, Vieira dos Santos E, Martínez-Huitle CA. Role of sp(3)/sp(2) ratio on the electrocatalytic properties of boron-doped diamond electrodes: a mini review. Electrochem Commun. 2015;59:52–55. doi:10.1016/j.elecom.2015.07.002
- Chaplin BP. Critical review of electrochemical advanced oxidation processes for water treatment applications. Environ Sci Process Impacts. 2014;16(6):1182–1203. doi:10.1039/c3em00679d
- Liu Z, Li H, Li M, et al. Preparation of polycrystalline BDD/ta electrodes for electrochemical oxidation of organic matter. Electrochim Acta. 2018;290:109–117. doi:10.1016/j.electacta.2018.09.058
- Li X, Li H, Li M, et al. Preparation of a porous boron-doped diamond/ta electrode for the electrocatalytic degradation of organic pollutants. Carbon. 2018;129:543–551. doi:10.1016/j.carbon.2017.12.052
- Wang H, Sayed SY, Luber EJ, et al. Redox flow batteries: how to determine electrochemical kinetic parameters. ACS Nano. 2020;14(3):2575–2584. doi:10.1021/acsnano.0c01281
- Lavagnini I, Antiochia R, Magno F. An extended method for the practical evaluation of the standard rate constant from cyclic voltammetric data. Electroanalysis. 2004;16(6):505–506. doi:10.1002/elan.200302851
- Miao D, Liu T, Yu Y, et al. Study on degradation performance and stability of high temperature etching boron-doped diamond electrode. Appl Surf Sci. 2020;514:146091. doi:10.1016/j.apsusc.2020.146091
- Mei R, Wei Q, Zhu C, et al. 3D macroporous boron-doped diamond electrode with interconnected liquid flow channels: a high-efficiency electrochemical degradation of RB-19 dye wastewater under low current. Appl Catal B Environ. 2019;245:420–427. doi:10.1016/j.apcatb.2018.12.074
- Hutton LA, Iacobini JG, Bitziou E, et al. Examination of the factors affecting the electrochemical performance of oxygen-terminated polycrystalline boron-doped diamond electrodes. Anal Chem. 2013;85(15):7230–7240. doi:10.1021/ac401042t
- Salazar-Banda GR, Andrade LS, Nascente PAP, et al. On the changing electrochemical behaviour of boron-doped diamond surfaces with time after cathodic pre-treatments. Electrochim Acta. 2006;51(22):4612–4619. doi:10.1016/j.electacta.2005.12.039
- Macpherson JV. A practical guide to using boron doped diamond in electrochemical research. Phys Chem Chem Phys. 2015;17(5):2935–2949. doi:10.1039/c4cp04022h
- Kamoshida N, Kasahara S, Ikemiya N, et al. In situ ATR-IR study of Fe(CN)(6)(3-)/Fe(CN)(6)(4-) redox system on boron-doped diamond electrode. Diamond Relat Mater. 2019;93:50–53. doi:10.1016/j.diamond.2019.01.021
- Liu F, Deng Z, Miao D, et al. A highly stable microporous boron-doped diamond electrode etched by oxygen plasma for enhanced electrochemical ozone generation. J Environ Chem Eng. 2021;9(6):106369. doi:10.1016/j.jece.2021.106369
- Mei R, Zhu C, Wei Q, et al. The dependence of oxidation parameters and dyes’ molecular structures on microstructure of boron-doped diamond in electrochemical oxidation process of dye wastewater. J Electrochem Soc. 2018;165(7):H324–H332. doi:10.1149/2.0221807jes
- Zhou B, Yu Z, Wei Q, et al. Electrochemical oxidation of biological pretreated and membrane separated landfill leachate concentrates on boron doped diamond anode. Appl Surf Sci. 2016;377:406–415. doi:10.1016/j.apsusc.2016.03.045
- Kang X, Zhang Z, Gou L. Improvement in electrical conductivity of boron-doped diamond films after hydrogen plasma and vacuum heat treatment. Appl Surf Sci. 2020;526:146738. doi:10.1016/j.apsusc.2020.146738
- Liu D, Gou L, Xu J, et al. Investigations on etching resistance of undoped and boron doped polycrystalline diamond films by oxygen plasma etching. Vacuum. 2016;128:80–84. doi:10.1016/j.vacuum.2016.03.012
- Li H, Guo Y, Zeng S, et al. High-sensitivity, selective determination of dopamine using bimetallic nanoparticles modified boron-doped diamond electrode with anodic polarization treatment. J Mater Sci. 2021;56(7):4700–4715. doi:10.1007/s10853-020-05577-4
- May PW, Ludlow WJ, Hannaway M, et al. Raman and conductivity studies of boron-doped microcrystalline diamond, facetted nanocrystalline diamond and cauliflower diamond films. Diamond Relat Mater. 2008;17(2):105–117. doi:10.1016/j.diamond.2007.11.005
- Kasahara S, Natsui K, Watanabe T, et al. Surface hydrogenation of boron-doped diamond electrodes by cathodic reduction. Anal Chem. 2017;89(21):11341–11347. doi:10.1021/acs.analchem.7b02129
- Campos-Roldán CA, Ramos-Sánchez G, Gonzalez-Huerta RG, et al. Influence of sp3–sp2 carbon nanodomains on metal/support interaction, catalyst durability, and catalytic activity for the oxygen reduction reaction. ACS Appl Mater Interfaces. 2016;8(35):23260–23269. doi:10.1021/acsami.6b06886
- Ayres ZJ, Borrill AJ, Newland JC, et al. Controlled sp2 functionalization of boron doped diamond as a route for the fabrication of robust and nernstian pH electrodes. Anal Chem. 2016;88(1):974–980. doi:10.1021/acs.analchem.5b03732
- Ryl J, Burczyk L, Bogdanowicz R, et al. Study on surface termination of boron-doped diamond electrodes under anodic polarization in H2SO4 by means of dynamic impedance technique. Carbon. 2016;96:1093–1105. doi:10.1016/j.carbon.2015.10.064
- Yagi I, Notsu H, Kondo T, et al. Electrochemical selectivity for redox systems at oxygen-terminated diamond electrodes. J Electroanal Chem. 1999;473(1-2):173–178. doi:10.1016/s0022-0728(99)00027-3
- Ostrovskaya L, Perevertailo V, Ralchenko V, et al. Wettability and surface energy of oxidized and hydrogen plasma-treated diamond films. Diamond Relat Mater. 2002;11(3-6):845–850. doi:10.1016/s0925-9635(01)00636-7
- Fan J, Shi H, Xiao H, et al. Double-layer 3D macro–mesoporous metal oxide modified boron-doped diamond with enhanced photoelectrochemical performance. ACS Appl Mater Interfaces. 2016;8(42):28306–28315. doi:10.1021/acsami.6b01929
- Li H, Yang W, Ma L, et al. 3D-printed highly ordered Ti networks-based boron-doped diamond: an unprecedented robust electrochemical oxidation anode for decomposition of refractory organics. Chem Eng J. 2021;426:131479. doi:10.1016/j.cej.2021.131479
- Randviir EP. A cross examination of electron transfer rate constants for carbon screen-printed electrodes using electrochemical impedance spectroscopy and cyclic voltammetry. Electrochim Acta. 2018;286:179–186. doi:10.1016/j.electacta.2018.08.021
- Futera Z, Watanabe T, Einaga Y, et al. First principles calculation study on surfaces and water interfaces of boron-doped diamond. J Phys Chem C. 2014;118(38):22040–22052. DOI:10.1021/jp506046m
- Lombardi EB. Boron–hydrogen complexes in diamond and their vibrational properties. Diamond Relat Mater. 2009;18(5-8):835–838. doi:10.1016/j.diamond.2009.01.022
- Chen C, Nurhayati E, Juang Y, et al. Electrochemical decolorization of dye wastewater by surface-activated boron-doped nanocrystalline diamond electrode. J Environ Sci. 2016;45:100–107. doi:10.1016/j.jes.2016.01.004