
Abstract
High pressure has traditionally been considered essential for the transformation of graphite into diamond. However, reducing the transition pressure required for this graphite-to-diamond (G2D) conversion holds significant appeal in both scientific research and engineering applications. In this study, we conducted large-scale molecular dynamics (MD) simulations using an environment-dependent interaction potential (EDIP) to examine the shear deformation of nanocrystalline graphite (n-graphite) with a grain size of approximately 6.5 nm. We discovered that the G2D transition pressure in n-graphite can be reduced to 2–3 GPa, significantly lower than the ∼90 GPa uniaxial stress required in crystalline graphite. This reduction is primarily due to concentrated local shear stresses at grain boundaries (GBs), which induce substantial rotations of graphite layers. These rotations facilitate the initial formation of diamond bonds at sites of pre-existing imperfections at the GBs, assisted by shear. Once initiated at the GBs, the G2D transition rapidly propagates within grains aligned parallel to the shear components, resulting in the formation of nanocrystalline diamond. Our findings underscore the critical roles of GBs and shear stress in enabling the G2D transition in n-graphite.
1. Introduction
Carbon exhibits versatility and diversity in structures and phases from finite cluster such as fullerene to two-dimensional graphene, and three-dimensional diamond because of its capability of hybridizing orbitals when forming covalent bonds. These various carbon phases open up numerous possibilities for substantial industrial applications and greatly enrich modern physics and scientific research [Citation1]. In particular, diamond is highly valued for its unmatched hardness and thermal conductivity among natural materials. However, the layered graphite is the ground state phase of carbon at ambient conditions [Citation2] and high pressure is considered necessary for the formation of other carbon phases from graphite [Citation3–5]. For example, graphite remains stable below 15 GPa at room temperature but transforms into the metastable graphitic or amorphous phases under higher pressure [Citation6]. Carbon onion formation was observed following the plastic deformation of graphite under approximately 50 GPa [Citation4]. However, understanding the phase transition mechanism from graphite to other phases remains a challenge due to the interplay of complex microstructures, extreme environments, and significant changes in chemical bonding during the transition [Citation7].
The graphite-to-diamond (G2D) transition involves transforming from a highly anisotropic graphite structure with strong sp2 bonds (where each carbon atom forms three sigma bonds in a plane with 120° angles) within layers and weak Van der Waals forces between layers to a super-hard diamond structure with uniform sp3 covalent bonds (where each carbon atom forms four sigma bonds in a tetrahedral geometry with 109.5° angles). This transition process requires a high activation energy barrier, necessitating high pressure and high temperature to initiate it [Citation7]. For example, at hydrostatic conditions, G2D transition occurs as the pressure increases to 70 GPa [Citation8]. In contrast, this transition was observed at much lower pressure up to 25 GPa at non-hydrostatic conditions [Citation9]. Recent studies have shown that high temperatures (e.g. 2000 °C) decrease the transition pressure of G2D to 12 GPa in the processes from graphite to nano-polycrystalline diamond and from onion carbon to nanotwinned diamond [Citation10,Citation11]. With the application of a catalyst, the G2D transition occurs at an even lower pressure of ∼5 GPa, yet at a still high temperature of 1500 K [Citation12]. In theory, many reactions paths and nucleation mechanisms have been proposed to explain the graphite to diamond transition under high pressure. Particularly, graphite may transform directly into diamond via the appropriate sliding and buckling of graphitic planes upon compression or shock, including transformation pathways from rhombohedral graphite to cubic diamond, and from orthorhombic graphite to hexagonal diamond [Citation13–15]. However, the current theories were challenged by several recent studies of G2D transition under the combination of compressive and shear stress [Citation9,Citation16]. Gao et al. observed the shear-driven formation of nano-diamonds at sub-gigapascals, originating from strong local stress concentrations at the tip of plastic strain-induced defects [Citation16]. Dong et al. proposed that under high pressure with significant shear, graphite transforms into ultra-strong sp3 phases which can further evolve into either diamond or graphite depending on the degree of shear stress [Citation9]. Thus, it was suggested that the simultaneous application of shear with pressure dramatically changes the transformation pathways [Citation9]. However, the underlying microscopic mechanisms remain unclear, particularly the effects of microstructure on the G2D phase transition.
Grain boundaries (GBs) play a crucial role in numerous material properties and processes. Recently, many models based on various theories have been proposed to describe the mechanical behaviors of nanocrystalline metals. For example, Sun et al. developed an atomistic-to-continuum method in which ledges are characterized by discontinuities in the elastic rotation and dilatation fields to simulate a polycrystalline copper system [Citation17,Citation18]. Feng et al. developed a grain size-dependent model to describe the effects of rotational deformation and dislocations near crack tip on the fracture toughness of nanocrystalline metals [Citation19]. These studies are greatly helpful in understanding the underlying mechanisms of polycrystalline metals in GB engineering. However, few studies have been conducted on polycrystalline carbon solids because various phase transitions that initiate at GBs significantly impact the phase transitions and properties of the entire systems. For example, our recent study demonstrated that the sintered grain growth in n-SiC at low temperatures is controlled by the presence of a nano-layered carbon phase at the GBs [Citation20]. During indentation, with the help of pre-existing defects such as vacancies, voids or cavities, the phase transformation from graphitic carbon to amorphous carbon at GBs is effective in enhancing toughness, strength, and plasticity of the n-SiC. Moreover, our quantum mechanics dynamics (QMD) simulations indicated that SiC might facilitate strain-induced transformations from graphite to diamond because the interactions between carbon atoms from graphite and SiC readily promote the formation of sp3 bonds at the interface. Thus, we expect that the GBs might play an important role in G2D transition, but the underlying atomistic mechanisms remain not fully understood. In addition, GBs play an important role in determining the mechanical properties of the nanocrystalline superhard ceramics because of various deformation mechanisms such as GB sliding, GB diffusion and GB rotation [Citation20–25].
In this study, to illustrate the influences of GBs on the G2D transition, we conducted molecular dynamics (MD) simulations of finite shear deformation for the n-graphite system and compared it with the laminar graphite crystal system under various compressive stress conditions. We found that in the crystalline graphite system, the G2D transition occurs at a very high external uniaxial stress of ∼90 GPa. However, the external pressure required for the G2D transition decreases significantly to a few gigapascals because the displacement of atoms in GB regions facilitates the initiation of G2D phase transformation which further develops rapidly into the specific graphite grain, leading to the formation of diamond nanograin. Our results show the significance of nanostructure in the G2D transition.
2. Simulation methods
2.1. Simulation models
The first system examined herein is the GB model of n-graphite, featuring a grain size of 6.51 nm and containing 214,224 atoms. The structure was constructed by the Voronoi construction approach [Citation26]: initially, seeds associated with various rotation matrices were inserted into the supercell; subsequently, each grain surrounding a seed was delineated by Voronoi polygons; ultimately, 16 randomly oriented grains were assembled into a body centered cubuc (BCC) lattice to form the polycrystalline model shown in . To achieve an equilibrated GB system, we first optimized the geometry by minimizing the potential energy at 0 K. Then, we performed a 100 ps isothermal–isobaric (NPT) MD simulation at 300 K until the internal stresses were relaxed to zero. The equilibrium density of n-graphite under ambient condition is ρ0 = 2.18 g·cm−3.
Figure 1. (a) The simulation model of nanocrystalline graphite featuring a 6.51 nm grain size and containing 214,224 atoms, with 16 randomly oriented grains arranged in a BCC lattice. The dotted golden lines indicate the grain boundaries. The simulation models of laminar perfect graphite containing 216,000 atoms, with (b) 30%, (c) 25% uniaxial pre-compression, and (d) no compression. The dashed blue rectangle represents the initial structure.
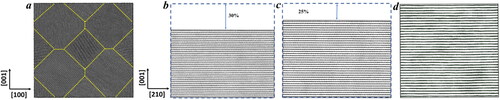
To understand the role of GBs in the G2D transition, in addition to the GB model, we constructed a comparable laminar crystalline graphite model containing 216,000 atoms. We sheared it along the same slip system where the G2D transformation initiates in the GB model. The structure was equilibrated using the same approach as the GB model, where the geometry was first optimized at 0 K, followed by a 10 ps NPT MD simulation under ambient conditions, leading to a density of ρ0 = 2.24 g/cm3. This density is very close to its theoretical experimental density of 2.26 g/cm³, demonstrating the reliability of the simulation method. The density of the GB model is slightly lower than that of the crystalline graphite model due to the defective structures within the GB regions. According to previous density functional theory (DFT) simulations [Citation16], the G2D transition in a perfect crystal occurs at a significantly larger uniaxial compression, which requires a 30% lattice decrease perpendicular to the layer plane (along the z-axis in this study). Thus, we first compressed the supercell along z axis by 30% within 10 ps using the NVT ensemble (constant volume, constant temperature, and constant number of atoms) to avoid the bond breaking or formation, leading to a high final uniaxial stress of ∼100 GPa, as shown in . Then, superposed shear was applied along the specific slip system suggested by the GB simulations. A 25% uniaxially compressed model was also constructed and sheared using the same procedure to illustrate the effect of pressure, as shown in . Moreover, to evaluate the thermal effect on the G2D transition, we uniaxially compressed our initial laminar crystalline graphite model () at a compression rate of 3.5% per second until a phase transition occurred at a constant temperature of 950 K.
2.2. Molecular dynamics simulation settings
The atomic interactions among carbon atoms were described by the environment-dependent interaction potential (EDIP) [Citation27,Citation28] which is incorporated into the large-scale atomic/molecular massively parallel simulator (LAMMPS) software [Citation29]. Carbon EDIP, developed from an earlier silicon EDIP [Citation30], includes a more sophisticated a spherical coordination counting term. It is challenging to use a single force field to describe different carbon hybridizations due to their distinct bonding characteristics and structures. Nonetheless, previous extensive work has demonstrated that EDIP is a suitable choice for studying the G2D transition. It has been successfully applied to investigate numerous phenomena across various carbon structures, including carbon onions [Citation31,Citation32], glassy carbon [Citation32,Citation33], peapods [Citation34], nanotubes [Citation35], and nanodiamond [Citation36]. Overall, these studies involve the transitions between sp, sp2, and sp3 carbon atomic structures to varying extents, which sufficiently demonstrates the capability of Carbon EDIP to handle the phase transition of polycrystalline graphite to diamond. Recently, Tomas et al. systematically evaluated the performance of 14 carbon potentials and determined that this carbon EDIP offers good all-around performance at a reasonable computational cost [Citation37,Citation38]. The only noted limitation is the absence of long-range attraction, causing interlayer spacing to increase at very low densities. This limitation, however, does not affect our study of high-pressure phase transitions in graphite.
For all three constructed structures, geometries were first optimized by adjusting atomic positions and cell parameters until the potential energy reached a minimum. Then, we conducted MD simulations to achieve an equilibrated state under ambient conditions using the NPT ensemble with the Nose–Hoover thermostat and barostat. The damping constants for temperature and pressure are 100 and 1000 fs, respectively, to control the deviations of temperature and pressure in dynamic simulations. Periodic boundary conditions were applied in all three directions to avoid possible surface effects, and the time step for integrating the equations of motion was set to 0.1 fs. Next, for the perfect laminar graphite supercell, we compressed it using the NVT ensemble with a Nose–Hoover thermostat and a damping constant of 100 fs. The system is compressed to different compression ratios of 25% and 30% with the uniaxial stress of ∼67 and ∼100 GPa, respectively. For the GB model, we performed hydrostatic compression via NPT MD simulations over 10 ps, achieving a low pressure of 5 GPa. Finally, we applied finite shear deformation to these systems to examine the physical and chemical responses of graphite with superposed shear coupled with compression. We sheared the systems along the x-z plane at constant shear rates of 0.001/ps and 0.1/ps using the canonical ensemble (NVE), as suggested in previous studies [Citation9]. To evaluate the thermal effects on the G2D transition, we uniaxially compressed the uncompressed crystalline graphite until a phase transition occurred at 950 K using the NVT ensemble.
3. Results and discussion
3.1. G2D transition in GB model
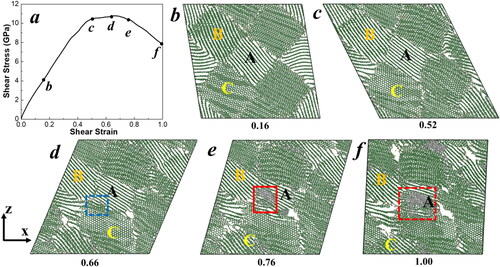
To illustrate the GB effects in the G2D transition, we examined the shear deformation of n-graphite. We initially performed the shear deformation simulation at a strain rate of 0.001/ps, as shown in . shows the shear stress-shear strain relationships of the GB model during shear deformation. In order to illustrate the detailed deformation mechanism during the shear process, we plotted several critical snapshots. At first, the shear stress increases continuously from initial 0 GPa to the yield stress of 10.79 GPa with the shear strain increasing from 0 to 0.66, as shown in . Since graphite is highly anisotropic and the Van der Waals forces among layers are much weaker than the strong covalent bonds within layers, the layers slide past each other, a mechanism that dominates the deformation modes during early-stage shear, especially in grains (e.g. grain A) whose layers are parallel to the shear direction component. In grains where graphite sheets are tilted relative to the shear slip plane, the layers bend due to the high flexibility of graphite layers, as shown in grains B and C in . Thus, the sliding and buckling of graphite layers are prevalent deformation mechanisms during shear process of nanocrystalline graphite (n-graphite) and the GBs block the graphite layers from easy sliding in some grains. In addition, we found that with the help of grain rotation and shear deformation, bent graphite layers in grain B gradually turn their orientation parallel to the shear direction, relaxing and stretching the flectional layers, as shown in . The maximum shear stress reaches 10.79 GPa at a shear strain of 0.66, indicating that most grains have reached their maximum elastic deformation. After that, the total shear stress begins to decrease because some portions of grains near GBs change their orientations, shifting the deformation mode from intralayer buckling to interlayer sliding. For example, before a 0.52 shear strain as shown in , the graphite layers in grain C are perpendicular to those in grain A and become greatly distorted during the shear process. However, four layers in grain C near the GB region begin to rotate, aligning parallel to the layers of grain A at a 0.66 shear strain (). Subsequently, continuous shearing leads to extensive sliding within these newly aligned parallel graphite layers, initiating the formation of interlayer sp3 covalent bonds starting at a 0.68 shear strain (). Once the sp2 to sp3 bond conversion begins, both interlayer and intralayer diamond structures rapidly develop and propagate within grain A, resulting in the formation of nano-diamond grains, as shown in . Therefore, the atom interactions at GB facilitate the activation of graphite to diamond transformation within the grain. The temperature and total pressure changes during the shear deformation are displayed in Figure S1 of Supplementary Material (SM). The temperature evolution shows that the G2D transition occurs at approximately 950 K, which is significantly lower than the melting temperatures of both graphite and diamond. The relationship between total pressure and shear strain during shear deformation reveals that the transient external pressure in the G2D transition is only about 2.3 GPa. Therefore, our results show that GB plays an important role in diamond nanograins formation. Our simulation agrees well with the previous experimental results that diamond nanograins are formed in compressed n-graphite at sub-gigapascal with the application of shear stress [Citation16].
Figure 2. (a) The shear-stress − shear-strain relationship of the GB model during finite shear deformation at a strain rate of 0.001/ps. (b-f) Atomic configurations of GB models at various shear strains. Grains A, B, and C represent three representative grains. The color coding is based on the bond structures of atoms: grey for sp3 bonds, green for sp2 bonds, and tan for sp bonds. The blue dashed square indicates the rotation of graphite layers near the GB in grain C. The red solid square marks the initiation of the graphite to diamond transition, and the red dashed square represents the growth of diamond structures in grain A. Only one atomic layer along the y-axis is displayed for clearer illustration.
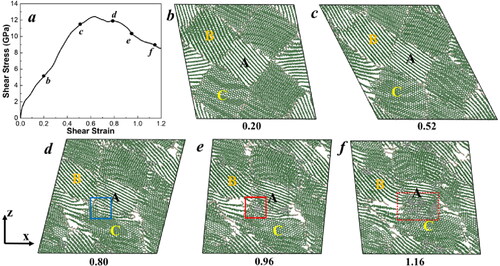
In addition, a faster shear deformation simulation with a strain rate of 0.1/ps was also conducted to better understand the effects of strain rate, as shown in . The evolution of temperature and total pressure during the shear deformation is displayed in Figure S2 of the SM. Compared to a low strain rate of 0.001/ps, the deformation processes at a high strain rate of 0.1/ps are similar: an elastic deformation is initially observed with extensive sliding and buckling of graphite layers, followed by a plastic deformation where diamond structure initiation and formation occur. However, the sp2 to sp3 bond reaction starts at a higher strain of 0.80, a higher temperature of 1200 K, and a higher external pressure of 3.0 GPa. Thus, the G2D transition initiates more readily at lower shear rates. This explains the phenomenon of diamond nanograin formation under sub-gigapascal external pressures with the application of shear stress [Citation16].
Figure 3. (a) The shear-stress − shear-strain relationship of the GB model during finite shear deformation at a strain rate of 0.1/ps. (b–f) Atomic configurations of GB models at various shear strains. Grains A, B, and C represent three representative grains. The color coding is based on the bond structures of atoms: grey for sp3 bonds, green for sp2 bonds, and tan for sp bonds. The blue solid square indicates the rotation of graphite layers near the GB in grain C. The red solid square marks the initiation of the graphite to diamond transition, and the red dashed square represents the growth of diamond structures in grain A. Only one atomic layer along the y-axis is displayed for clearer illustration.
To verify the stability of the local nanograin diamond structures, we conducted additional NPT simulations using the trajectories from the last timestep of two shear simulations at different shear rates. The external pressure was gradually released to 1 atm, and the temperature was decreased to 300 K. Stable nanograin diamond structures were obtained under ambient conditions, as shown in Figure S3 in the Supporting Information. Additionally, the G2D transition was widely observed in the GB model during shear, as shown in Figure S4 in the Supporting Information. The transition occurs in most of the GB regions, indicating that the GBs facilitate diamond formation. However, nanograin diamond was only observed in the graphite sheets that are parallel to the shear direction component.
3.2. Local deformation mechanism of diamond formation
The G2D transition in the GB model occurs near GBs, which are greatly bent and distorted during the shear process. Local stress plays an important role in the G2D transition. Since the G2D transition initiates at the triple junction of grains A, B, and C, we analyzed the atom trajectories during the 0.001/ps strain simulation and computed the local shear stress as a function of shear strain by selecting a 1 nm × 1 nm × 1 nm cube to analyze the essential local state evolution. Moreover, the local shear stress-shear strain for the 0.1/ps strain simulation and corresponding critical snapshots are shown in Figure S5 in the Supporting Information. The detailed snapshots of this cube are presented in –f) and are discussed below.
Figure 4. (a) Shear-stress–shear-strain relationship of the 1 nm × 1 nm × 1 nm cube in the diamond formation region (indicated by a red square). (b–f) snapshots of the triple junction region of grains A, B, and C. (g) Magnified structure showing the diamond structure from (f). Only one atomic layer is displayed for clearer illustration. The color coding of the atoms is based on their bond states: grey for sp3 bonds, green for sp2 bonds, and tan for sp bonds. The color coding of the diamond formation in the cube, inserted at the upper right corner, is identified by the diamond structure identification tool [Citation39] in the OVITO visualization package [Citation40]: blue for cubic diamond, light blue for the nearest neighbor of cubic diamond, orange for hexagonal diamond, and yellow for the nearest neighbor of hexagonal diamond.
![Figure 4. (a) Shear-stress–shear-strain relationship of the 1 nm × 1 nm × 1 nm cube in the diamond formation region (indicated by a red square). (b–f) snapshots of the triple junction region of grains A, B, and C. (g) Magnified structure showing the diamond structure from (f). Only one atomic layer is displayed for clearer illustration. The color coding of the atoms is based on their bond states: grey for sp3 bonds, green for sp2 bonds, and tan for sp bonds. The color coding of the diamond formation in the cube, inserted at the upper right corner, is identified by the diamond structure identification tool [Citation39] in the OVITO visualization package [Citation40]: blue for cubic diamond, light blue for the nearest neighbor of cubic diamond, orange for hexagonal diamond, and yellow for the nearest neighbor of hexagonal diamond.](/cms/asset/335590b6-1849-42db-be17-98d6046c5d5b/tfdi_a_2366807_f0004_c.jpg)
Initially, the shear stress τ increases continuously from the initial structure to a 0.38 shear strain, illustrating the gradual accumulation of stress in this local region. Since the sliding of graphite layers is the dominant deformation mode during the initial shear stage, it is widely observed in grain A, whose layers are parallel to the shear component. Graphite sheets in grain B, which are slightly tilted relative to the shear plane, rotate until they align parallel to those in grain A, thereby relaxing the local stresses (). However, the layers in grain C near the GB are heavily compressed by the surrounding material, resulting in a severely distorted region with highly concentrated localized stresses. The local shear stress reaches a peak value of 20.56 GPa, exceeding the maximum shear strength of the entire system.
A sharp drop in shear stress from the maximum value to 4.3 GPa results from the rotation of layers near the GB in grain C, as shown in . During this period, four layers in grain C rotate until they are perpendicular to the shear plane but remain parallel to each other, demonstrating coherent motion of adjacent graphite layers (). At a 0.58 shear strain, these layers in grain C finally rotate 90° to align with those in grain A, resulting in a low local shear stress of 4.31 GPa.
Since sliding of the graphite layers is preferred under these conditions, we expected the local shear stress to remain very low. Surprisingly, however, the shear stress began to increase again. This increase is attributed to the rotation causing the upper layer in grain C to shift very close to the bottom layer in grain A, as shown in . With the aid of the shear, some atoms from these two layers began bonding, initiating local sp3 bond formation. Here, the G2D transition begins after the layers in grain C have completely rotated to align parallel with those in grain A under low local shear stress, rather than during the rotation process with high stresses. This suggests that diamond formation may occur through structural transitions during the decompression process and that shear stress along layers plays a crucial role in interlayer bonding. Our simulation results align well with previous studies [Citation9].
The local shear stress continuously increases to above 40 GPa. During this process, diamond formation extends into both grain A and grain C, as shown in . The magnified view in displays the transformed diamond structure.
Thus, our results suggest that GBs significantly facilitate the initiation of the transition from graphite to diamond under an external pressure as low as ∼5 GPa, which is much lower than those observed in previous quantum mechanics shear simulations of perfect graphite [Citation9,Citation16]. This occurs because stress localization in GB regions leads to the rotation of graphite layers, with pre-existing defects at GBs initiating the transitions during shear. Once initiated, the transition both between and within layers spreads rapidly in the specified grains. A similar process is observed in the simulation at a strain rate of 0.1/ps, as shown in Figure S5.
3.3. Phase transition along (001) <210> slip system
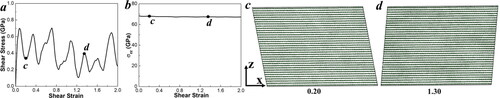
Here, our MD simulations on GBs indicated that the phase transformation in grain A could occur along the (001)<210> slip system under low hydrostatic pressure conditions. To verify the importance of GBs in the G2D transition, we constructed an equally sized perfect graphite supercell for comparison. For computational convenience, the structure was rotated so that the x-z plane is the (001) slip plane, and the x-axis aligns with the <210> slip direction in a Cartesian coordinate system. The system was compressed uniaxially by 25% along the z-axis, resulting in a high compressive stress of 68 GPa, and then sheared along the (001)<210> slip system at a strain rate of 0.1/ps, as shown in . We did not observe any structural changes up to a shear strain of 2.0, as shown in . The pressure along the z-direction remained constant at approximately 67 GPa. The shear stress fluctuates because changes in the relative positions of carbon atoms lead to variations in the Van der Waals forces. The relationships of temperature-shear-strain and total-pressure-shear-strain are illustrated in Figure S6 in the Supporting Information.
Figure 5. Relationships of (a) shear stress–strain, (b) σzz-strain, and (c, d) snapshots for a pre-compression rate of 25% in the z-axis graphite model sheared along the (001)<210> slip system at a strain rate of 0.1/ps, illustrating layer sliding. The green color coding of the atoms represents the sp2 bond state.
We then further compressed the system uniaxially to 30% strain along the z-axis, resulting in a higher compressive stress of approximately 100 GPa, and subsequently sheared it along the (001)<210> slip system at a strain rate of 0.1/ps, as shown in .
Figure 6. Relationships of (a) shear stress-strain, (b) σzz-strain, and (c-h) snapshots for a pre-compression rate of 30% in the z-axis graphite model sheared along the (001)<210> slip system at a strain rate of 0.1/ps, depicting the successive processes of (c) layer sliding, (d) atoms shifting along the z-axis, (e) initiation of graphite to diamond transition, and (f-g-h) diamond spreading. In each snapshot, the xz plane and layer a in the xy plane, where the initial spot of graphite-to-diamond transition occurs (indicated by red arrows), are displayed to clearly illustrate the process. The color coding of the atoms reflects their bond states: grey for sp3 bonds and green for sp2 bonds.
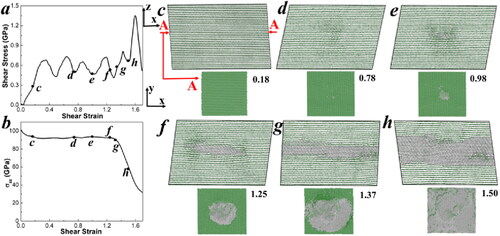
The following phenomena are observed during the deformation process:
Initially, shearing along the (001)<210> slip system causes no obvious structural changes, but sliding of the graphite layers dominates until a 0.78 shear strain is reached, as shown in . The shear stress initially increases from 0 to 0.64 GPa and then fluctuates, forming an oscillation curve around an equilibrium value of approximately 0.51 GPa, due to the Van der Waals forces between layers and the relative positional changes of carbon atoms during shear. The pressure along the z-axis relaxes to approximately 90 GPa due to the effect of temperature. This is consistent with previous DFT simulations [Citation16].
As the shear strain continuously increases to 0.78, carbon atoms in several stacking layers begin to shift slightly along the z-axis, resulting in out-of-plane deformation. This deformation further leads to a transition from some sp2 bonds to sp3 bonds, as shown in . At this moment, the shear stress reaches the wave trough of the oscillation curve, registering at 0.78 GPa. This suggests that diamond formation may occur through structural transitions during the decompression process as graphite is subjected to shear stress.
Once the localized diamond forms, both interlayer and intralayer sp3 bonds begin to spread simultaneously. For instance, diamond bonds extend across four layers, forming a circle with a radius of approximately 2.5 nm in plane A at a 1.00 shear strain, as shown in . At a 1.25 shear strain, as shown in , they expand to seven layers and form a circle with a radius of approximately 6.0 nm in plane A.
The sp3 bonds first reach the edge of plane A along the x-axis at a 1.37 shear strain (), leading to a slight drop in pressure along the z-axis. The entire graphite structure transforms into diamond at a 1.45 shear strain in plane A (). As more graphite layers transform into a rigid diamond structure, σzz decreases rapidly, yet the shear stress reaches a maximum value of 1.35 GPa at a 1.60 shear strain. Subsequently, the local stresses on the diamond transfer to laminar graphite, relaxing the shear stress and preventing the diamond structure from undergoing plastic deformation or initiating further cracks.
Thus, our perfect graphite shear simulation aligns well with previous DFT simulations, which show that a large uniaxial pre-strain of 30% is required to induce a phase transition in crystalline graphite, while no phenomena occur at a 20% strain [Citation16]. The relationships of temperature-shear-strain and total-pressure-shear-strain are illustrated in Figure S7 in the Supporting Information. The phase transition initiates at a total pressure of 60.6 GPa. Compared to the external pressure required in the crystalline graphite model, the phase transition in the GB model is significantly facilitated, requiring only 2–3 GPa of external pressure.
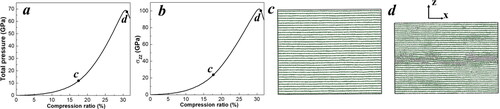
In addition, to directly compare the phase transition under shear and compression loading conditions, we uniaxially compressed our single-crystal graphite along the [001] direction until the G2D phase transition occurred at 950 K, as shown in . The total pressure increased monotonically from 0 to 69 GPa as the compression ratio increased from 0% to 31%. Similarly, σzz increased from 0 to 102 GPa. No other significant structural changes occurred during this process, except that the graphite layers moved closer together. The phase transition was initiated, leading to a decrease in total pressure and σzz as the compression ratio reached 31%. Thus, compared to an external pressure of 69 GPa, the phase transition occurs at a significantly lower external pressure of approximately 2.3 GPa in the GB model.
Figure 7. Relationships of (a) total pressure to compression ratio, (b) σzz-compression ratio, and (c, d) snapshots for compression rates of 17.5% and 31.5% in the z-axis graphite model. The color coding of the atoms is green for sp2 bonds and grey for sp3 bonds.
4. Conclusions
In summary, our MD simulations reveal a detailed atomic mechanism demonstrating the critical role of GBs in the G2D transition in n-graphite under a low external pressure of a few gigapascals, facilitated by shear. Our major findings are:
The sliding and buckling of graphite layers are the prevalent deformation mechanisms in n-graphite during the initial shear stage before the G2D transition. Graphite layers might reorient to become parallel to the shear force, thereby relaxing localized stresses.
Highly accumulated local shear stress at GBs during shear deformation leads to seriously distorted structures within grains and dramatic rotations of parts of these graphite layers until they are perpendicular to the shear plane. Local sp3 bond formation begins between pre-existing imperfection layers at GBs, facilitated by shear. Diamond formation might occur through structural transitions during the decompression process within the (001)<210> slip system, leading to the formation of nano-diamond grains.
In the specific (001)<210> slip system of the perfect crystal, interlayer carbon atom shifting, followed by G2D bond formation, begins at a high uniaxial stress of approximately 90 GPa with the application of shear. Once the sp2 to sp3 bond conversion initiates, both interlayer and intralayer diamond structures propagate quickly and simultaneously. The local stresses on diamond may transfer to laminar graphite during shear, thereby relaxing the shear stress and preventing the diamond structure from undergoing plastic deformation or initiating further cracks.
Thus, our results emphasize that shear stress plays a crucial role in the G2D transformation. More importantly, GB significantly facilitates the G2D transition at much lower external pressures. Our results may provide valuable insights for GB engineering aimed at controlling the G2D phase transition, potentially reducing the required pressure for diamond formation.
It should be noted that the deformation behavior in nanocrystalline materials is complex, involving factors such as grain size, GBs, defects, and deformation rates. Thus, our findings can only qualitatively indicate that more GBs provide additional potential nucleation sites, facilitating the G2D transition. Therefore, in practical applications, it is beneficial to introduce as many GBs as possible, even though they undoubtedly compromise the mechanical integrity and performance of the material. Nonetheless, this does not affect the practical applications of these materials, which have potential uses in tribology, drug delivery, bioimaging, tissue engineering, and as fillers for nanocomposites [Citation41,Citation42].
Supplemental Material
Download MS Word (28.9 MB)Acknowledgments
Part of the simulations was performed on the HPC cluster (Pronghorn) at the University of Nevada, Reno.
Disclosure statement
The authors declare no competing financial interests.
Additional information
Funding
Notes on contributors
Dezhou Guo
Dezhou Guo received his bachelor’s degree from the Beijing Institute of Technology in 2011, and his Ph.D degree in the University of Nevada, Reno in 2020. He is now the professor at the Beijing Institute of Technology. His research focuses on superhard materials, energetic materials, and surface chemistry using first-principles and molecular dynamics simulations.
Kun Luo
Kun Luo received his bachelor’s degree from Wuhan University of Science and Technology in 2010 and his Ph.D. from Yanshan University in 2017. He is now a postdoctoral fellow at Iowa State University. His research centers on investigating the atomic mechanisms of structural changes in materials to comprehend their novel properties.
Qi An
Qi An received his bachelor’s degree from the University of Science and Technology of China in 2002, and his Ph.D degree from Caltech in 2012. He is an Associate Professor in the Department of Materials Science and Engineering at the Iowa State University. His research focuses on quantum mechanical data-based computational materials science. He is particularly interested in machine learning force field, molecular dynamics simulations, quantum mechanics simulations, reactive force field, and applying these methods in advanced materials design.
References
- Sundqvist B. Carbon under pressure. Phys Rep. 2021;909:1–73. https://doi.org/10.1016/j.physrep.2020.12.007.
- Fedosayev DV, Deryagin BV, Varasavskaja IG. The crystallization of diamond. Surf Coat. Technol. 1989;38(1–2):1–122. https://doi.org/10.1016/0257-8972(89)90127-8.
- Mao WL, Mao H, Eng PJ, et al. Bonding changes in compressed superhard graphite. Science (80). 2003;302(5644):425–427. https://doi.org/10.1126/science.1089713.
- Blank VD, Denisov VN, Kirichenko AN, et al. High pressure transformation of single-crystal graphite to form molecular carbon-onions. Nanotechnology. 2007;18(34):345601. https://doi.org/10.1088/0957-4484/18/34/345601.
- Luo K, Liu B, Hu W, et al. Coherent interfaces govern direct transformation from graphite to diamond. Nature. 2022;607(7919):486–491. https://doi.org/10.1038/s41586-022-04863-2.
- Bundy FP, Bassett WA, Weathers MS, et al. The pressure-temperature phase and transformation diagram for carbon; updated through 1994. Carbon NY. 1996;34(2):141–153. https://doi.org/10.1016/0008-6223(96)00170-4.
- Guillou CL, Brunet F, Irifune T, et al. Nanodiamond nucleation below 2273 K at 15 GPa from carbons with different structural organizations. Carbon NY. 2007;45(3):636–648. https://doi.org/10.1016/j.carbon.2006.10.005.
- Schindler TL, Vohra YK. A micro-Raman investigation of high-pressure quenched graphite. J Phys Condens Matter. 1995;7(47):L637–L642. https://doi.org/10.1088/0953-8984/7/47/001.
- Dong J, Yao Z, Yao M, et al. Decompression-induced diamond formation from graphite sheared under pressure. Phys Rev Lett. 2020;124(6):065701. https://doi.org/10.1103/PhysRevLett.124.065701.
- Irifune T, Kurio A, Sakamoto S, et al. Formation of pure polycrystalline diamond by direct conversion of graphite at high pressure and high temperature. Phys Earth Planet Int. 2004;143-144(1–2):593–600. https://doi.org/10.1016/j.pepi.2003.06.004.
- Huang Q, Yu D, Xu B, et al. Nanotwinned diamond with unprecedented hardness and stability. Nature. 2014;510(7504):250–253. https://doi.org/10.1038/nature13381.
- Bundy FP, Hall HT, Strong HM, et al. Man-made diamonds. Nature. 1955;176(4471):51–55. https://doi.org/10.1038/176051a0.
- Fahy S, Louie SG, Cohen ML. Theoretical total-energy study of the transformation of graphite into hexagonal diamond. Phys Rev B. 1987;35(14):7623–7626. https://doi.org/10.1103/PhysRevB.35.7623.
- Scandolo S, Bernasconi M, Chiarotti GL, et al. Pressure-induced transformation path of graphite to diamond. Phys Rev Lett. 1995;74(20):4015–4018. https://doi.org/10.1103/PhysRevLett.74.4015.
- Khaliullin RZ, Eshet H, Kühne TD, et al. Nucleation mechanism for the direct graphite-to-diamond phase transition. Nat Mater. 2011;10(9):693–697. https://doi.org/10.1038/nmat3078.
- Gao Y, Ma Y, An Q, et al. Shear driven formation of nano-diamonds at sub-gigapascals and 300 K. Carbon NY. 2019;146:364–368.
- Sun XY, Fressengeas C, Taupin V, et al. Disconnections, dislocations and generalized disclinations in grain boundary ledges. Int J Plast. 2018;104:134–146. https://doi.org/10.1016/j.ijplas.2018.02.003.
- Sun XY, Taupin V, Fressengeas C, et al. Continuous description of the atomic structure of grain boundaries using dislocation and generalized-disclination density fields. Int J Plast. 2016;77:75–89. https://doi.org/10.1016/j.ijplas.2015.10.003.
- Feng H, Fang QH, Zhang LC, et al. Special rotational deformation and grain size effect on fracture toughness of nanocrystalline materials. Int J Plast. 2013;42:50–64. https://doi.org/10.1016/j.ijplas.2012.09.015.
- Madhav Reddy K, Guo D, Lahkar S, et al. Graphite interface mediated grain-boundary sliding leads to enhanced mechanical properties of nanocrystalline silicon carbide. Materialia. 2019;7:100394. https://doi.org/10.1016/j.mtla.2019.100394.
- Guo D, Song S, Luo R, et al. Grain boundary sliding and amorphization are responsible for the reverse hall-petch relation in superhard nanocrystalline boron carbide. Phys Rev Lett. 2018;121(14):145504. https://doi.org/10.1103/PhysRevLett.121.145504.
- Ryou H, Drazin JW, Wahl KJ, et al. Below the hall–petch limit in nanocrystalline ceramics. ACS Nano. 2018;12(4):3083–3094. https://doi.org/10.1021/acsnano.7b07380.
- Guo D, An Q. Transgranular amorphous shear band formation in polycrystalline boron carbide. Int J Plast. 2019;121:218–226. https://doi.org/10.1016/j.ijplas.2019.06.004.
- Yano K. Mesomechanics of the α–ɛ transition in iron. Int J Plast. 2002;18(11):1427–1446. https://doi.org/10.1016/S0749-6419(02)00024-4.
- Wulfinghoff S, Bayerschen E, Böhlke T. A gradient plasticity grain boundary yield theory. Int J Plast. 2013;51:33–46. https://doi.org/10.1016/j.ijplas.2013.07.001.
- Li J. AtomEye: an efficient atomistic configuration viewer. Model Simul Mater Sci Eng. 2003;11(2):173–177. https://doi.org/10.1088/0965-0393/11/2/305.
- Marks NA. Generalizing the environment-dependent interaction potential for carbon. Phys Rev B. 2000;63(3):035401. https://doi.org/10.1103/PhysRevB.63.035401.
- Marks N. Modelling diamond-like carbon with the environment-dependent interaction potential. J Phys Condens Matter. 2002;14:2901–2927.
- Thompson AP, Aktulga HM, Berger R, et al. LAMMPS - a flexible simulation tool for particle-based materials modeling at the atomic, meso, and continuum scales. Comput Phys Commun. 2022;271:108171. https://doi.org/10.1016/j.cpc.2021.108171.
- Justo JF, Bazant MZ, Kaxiras E, et al. Interatomic potential for silicon defects and disordered phases. Phys Rev B. 1998;58(5):2539–2550. https://doi.org/10.1103/PhysRevB.58.2539.
- Lau DWM, McCulloch DG, Marks NA, et al. High-temperature formation of concentric fullerene-like structures within foam-like carbon: experiment and molecular dynamics simulation. Phys Rev B. 2007;75(23):233408. https://doi.org/10.1103/PhysRevB.75.233408.
- Powles RC, Marks NA, Lau DWM. Self-assembly of Sp2-bonded carbon nanostructures from amorphous precursors. Phys Rev B. 2009;79(7):075430. https://doi.org/10.1103/PhysRevB.79.075430.
- Suarez-Martinez I, Marks NA. Effect of microstructure on the thermal conductivity of disordered carbon. Appl Phys Lett. 2011;99(3):033101. https://doi.org/10.1063/1.3607872.
- Suarez-Martinez I, Higginbottom PJ, Marks NA. Molecular dynamics simulations of the transformation of carbon peapods into double-walled carbon nanotubes. Carbon NY. 2010;48(12):3592–3598. https://doi.org/10.1016/j.carbon.2010.06.004.
- Suarez-Martinez I, Marks NA. Amorphous carbon nanorods as a precursor for carbon nanotubes. Carbon NY. 2012;50(15):5441–5449. https://doi.org/10.1016/j.carbon.2012.07.030.
- Marks NA, Lattemann M, McKenzie DR. Nonequilibrium route to nanodiamond with astrophysical implications. Phys Rev Lett. 2012;108(7):075503. https://doi.org/10.1103/PhysRevLett.108.075503.
- de Tomas C, Suarez-Martinez I, Marks NA. Graphitization of amorphous carbons: a comparative study of interatomic potentials. Carbon NY. 2016;109:681–693. https://doi.org/10.1016/j.carbon.2016.08.024.
- de Tomas C, Aghajamali A, Jones JL, et al. Transferability in interatomic potentials for carbon. Carbon NY. 2019;155:624–634. https://doi.org/10.1016/j.carbon.2019.07.074.
- Maras E, Trushin O, Stukowski A, et al. Global transition path search for dislocation formation in Ge on Si(001). Comput Phys Commun. 2016;205:13–21. https://doi.org/10.1016/j.cpc.2016.04.001.
- Stukowski A. Visualization and analysis of atomistic simulation data with OVITO–the open visualization tool. Model Simul Mater Sci Eng. 2010;18(1):015012. https://doi.org/10.1088/0965-0393/18/1/015012.
- Mochalin VN, Shenderova O, Ho D, et al. The properties and applications of nanodiamonds. Nat Nanotech. 2012;7(1):11–23. https://doi.org/10.1038/nnano.2011.209.
- Schrand AM, Hens SAC, Shenderova OA. Nanodiamond particles: properties and perspectives for bioapplications. Crit Rev Solid State Mater Sci. 2009;34(1–2):18–74. https://doi.org/10.1080/10408430902831987.