 ?Mathematical formulae have been encoded as MathML and are displayed in this HTML version using MathJax in order to improve their display. Uncheck the box to turn MathJax off. This feature requires Javascript. Click on a formula to zoom.
Abstract
Natural resource degradation resulting from inappropriate land use and subsequent hydrological change is one of the key problems threatening environmental welfare and sustainable development. This study investigates the changes in the hydrological process in response to the land use and land cover (LULC) dynamics of the Keleta watershed, Awash River basin, Ethiopia using the Soil and Water Assessment Tool (SWAT) model. The model was calibrated and validated using monthly observed stream flow data for the baseline year (1985) and performed well (NSE ≥ 0.74, RMS ≤ 0.51, and PBIAS ≤ 15.3). An overall increase in the amount of surface runoff and base flow (10.4%) and (0.6%) and a decline in groundwater flow (3.5%) were observed in 2010 compared with the baseline year (1985). The trend of increasing surface runoff and declining groundwater flow due to LULC changes has wider implications for environmental and water resource development. This is expected to exert a substantial adverse impact on ecosystems, hydraulic structures such as dams, reservoirs, and irrigation canals, and rural livelihoods unless appropriate integrated landscape management is implemented.
1. Introduction
Drastic changes in land use and land cover (LULC) patterns in river catchments have taken place on a global scale due to the continuous expansion of human development (G. Wang et al., Citation2007). Intense expansion and intensification of agriculture, the growth of urban areas and industries, and the extraction of timber and other natural resources are believed to accelerate the change in the global environment (DeFries & Eshleman, Citation2004; Lambin & Meyfroidt, Citation2011; Mensah et al., Citation2020). For instance, an estimated 420 million ha of forest has been lost worldwide through deforestation since 1990, each year 10 million hectares of forest lands are also deforested worldwide (FAO, Citation2020).
Several studies have shown that there were significant effects of LULC changes on hydrological processes in different parts of the world (Baker & Miller, Citation2013; Liu et al., Citation2014; Tran & O’Neill, Citation2013; Wagner et al., Citation2013; Welde & Gebremariam, Citation2017; Yan et al., Citation2013). Most of these studies pointed out that LULC changes were the principal causes of a considerable increase in runoff. For instance, Gessesse et al. (Citation2015) revealed that the expansion of bare, cultivated, and urban lands and the reduction of natural vegetation covers can be triggers for the generation of substantial runoff in the Modjo watershed, Ethiopia. Wijesekara et al. (Citation2012) reported that due to the expansion of built-up and agriculture and the reduction of the net capacity of water retention on the surface as a result, the total surface runoff to the river increases creating less infiltration in the Elbow River watershed, southern Alberta, Canada. However, Niehoff et al. (Citation2002) and Hu et al. (Citation2020) suggested that the impact of LULCs change on storm runoff generation is marginal or decline in different watershed.
It is recognized that LULC changes are one of the important factors affecting hydrological processes. However, little is known about the quantitative relation and spatial–temporal variations (Li et al., Citation2018; G. Wang et al., Citation2007). The impacts of LULC variations on hydrological processes in some typical watersheds have proven that such impacts vary widely from place to place owing to regional differences and site-specific factors (Abere et al., Citation2020; Bewket & Sterk, Citation2005; W. Wang et al., Citation2013). Such a lack of unanimity in the conclusion reached in different watersheds requires more investigations under different hydrologic regimes for a comprehensive explanation of the impact of LULC on the hydrological processes.
Understanding the impact of LULC change on the hydrological process in Ethiopia is far from complete. In particular, scenario analysis of LULC change impact on the hydrological process in the Awash River basin is limited. Tibebe and Bewket (Citation2011) evaluated surface runoff generation by applying the SWAT model in the Keleta watershed. However, the impacts of long-term LULC change on hydrological processes at the Keleta watershed have not been addressed. The study of hydrologic processes regarding to LULC dynamics enables assessment of the sustainability of LULC systems because the hydrological processes are reflections of the ecological state of the entire watershed. Information from the study can also forecast the likely effects of any potential changes in LULC on water resource systems. Hence, such a study has practical application for devising strategies and policies for sustainable land and water use (Leh et al., Citation2011; Obeidat et al., Citation2019).
The Keleta river watershed in central Ethiopia is one notable example where no information exists regarding LULC dynamics and its impact on hydrological processes. The aim of this paper is, therefore, to evaluate the impact of LULC dynamics on the hydrological processes of the Keleta River watershed, a major tributary to the Awash River basin.
2. Materials and methods
2.1 Description of the study watershed
The Keleta watershed is located within the Hitosa district, Arsi administrative zone of the Oromia Regional State. The watershed area covers 850 km2. It lies within 7° 53ʹ 49ʹ’ to 8° 17ʹ 01ʹ’ N and 39° 14ʹ 34ʹ’ to 39° 32ʹ 40ʹ’ E in the Awash River basin (). The watershed is characterized by diverse topographic conditions. The altitude of the watershed ranges from 1583 m above sea level (North of Huruta town) to 4199 m above sea level around Chilalo Mountain.
Figure 1. Location map of the Keleta watershed
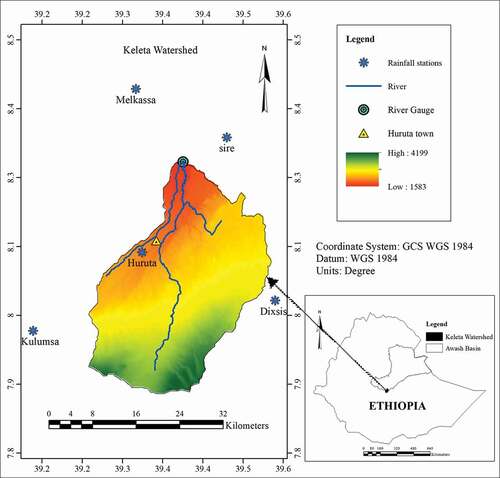
The watershed has a flatland on the valley bottom. However, the surrounding mountains have very steep slopes. Dystric Regosols on steep mountainous slopes, Eutric Nitosols, and Haplic Xerosols on flat and gentler slopes are the dominant soils of the Keleta watershed according to FAO/UNESCO (Citation1995). The downstream part is characterized as dry semi-arid while the upstream part is wet sub-humid climatic condition. Mean annual rainfall, maximum and minimum temperature at Huruta Station (2044 m above sea level) is around 890 mm, 23.8°C, and 8.6°C, respectively. The maximum surface runoff and sediment loss of the study area were also estimated at 135.8 mm and 17.7 t/ha, respectively (Tibebe & Bewket, Citation2011).
2.2 Description of the SWAT model
This study used the Soil and Water Assessment Tool (SWAT) version 2012. It is a physically based distributed parameter model. In large complex watersheds with varying soils, land use, and management conditions over long periods, SWAT predict the impact of land management practices on water, sediment, and agricultural chemical yields (Neitsch et al., Citation2009). Weather, soil, topography, vegetation, and land management practices information about the watershed is required. SWAT is a continuous time scale model, capable of simulating long-term effects of change in LULC. However, the model is not designed to simulate detailed, single event flood routing (Arnold et al., Citation1998). The model handles differences in evapotranspiration for various crops and soils through subdivision of the watershed. Each hydrological response unit (HRU) separately predicts the runoff and the total runoff of the watershed obtained through route. It gives a much better physical description of the hydrologic process by increasing accuracy (Neitsch et al., Citation2009).
The land phase of the hydrologic cycle is simulated by the SWAT model based on the following water balance equation as developed by Neitsch et al. (Citation2009):
where, SW is the final soil water content (mm), SWo is the initial soil water content on a day i (mm), t is time (days), Rday is the amount of precipitation on a day i (mm), Qsurf is the amount of surface runoff on a day i (mm), Ea is the amount of evaporation on a day i (mm), Wseep is the amount of percolation and bypass flow exiting the soil profile bottom on a day i (mm), and Qgw is the amount of return flow on a day i (mm).
2.3 Model inputs
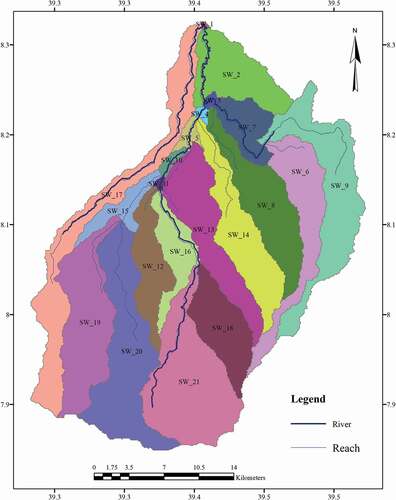
The digital elevation model (DEM) of the Keleta watershed was extracted from Shuttle Radar Topography Mission (SRTM) 30-m resolution data. This was used to define a watershed boundary, sub-watersheds (SWs), hydrological response units (HRUs). Since SWAT works on a sub-watershed basis, the watershed was additional separated into 21 sub-watersheds (SWs), then considering LULC, soil, and slope the sub-watershed again more separated into 475 HRUs. Land use threshold (10%), soil threshold (5%), and slope threshold (10%) were fixed to create the HRUs (Winchell et al., Citation2010). Comprehensive simulation of various hydrological processes using the SWAT model achieved thought segregation of the watershed ().
Figure 2. Sub-watersheds of the Keleta Watershed
Landsat TM (Thematic Mapper) images on 2 January 1985, and 10 January 2011, Worldwide Reference System (WRS) Path 168, Row 54 was used to extract two LULCs layers. The two images were classified into six LULC classes using a supervised image classification method coupled with the ‘maximum likelihood classification algorithm’ (Campbell & Wynne, Citation2011; Lillesand et al., Citation2004). The LULC classes are degraded land (the land surface which is mainly covered by bare soil and exposed rocks over gentle and steep mountain slopes), farmland and settlement (areas allotted to rainfed crop cultivation both annuals and perennials, mostly of cereals in subsistence farming and the scattered rural settlements), forest (areas covered by trees forming closed or nearly closed canopies), grassland (land dominated by grass), shrub lands (land covered by small trees, bushes, and shrubs, sometimes mixed with grasses; less dense than forests) and water bodies (area covered by a small dammed lake fed by rainfall and small streams) (Garedew et al., Citation2009; Haregeweyn et al., Citation2015; Mayaux et al., Citation2004).
Field study data, the Ethiopian Mapping Agency (EMA) 1975 topo sheet of 1:50,000 scale, and Google Earth were used for classification training, reference sample data, and accuracy assessments (Lillesand et al., Citation2004). Reference samples at each LULC category were used for the computation of the error matrices to assess the accuracy of the classification. Bekele et al. (Bekele et al., Citation2019a) presented the detailed method of the LULC dynamics study in the study area. The two LULC layers were reclassified into five SWAT LULC compatible formats and used as inputs in the model. LULC map produced for the year 1985 was used as a baseline. Therefore, these two LULC maps could be used as model inputs to assess hydrology processes. The processing was done using ArcGIS 10.2 software packages.
Detailed soil information is required for the SWAT model to determine the hydrologic parameters of each HRU (Hydrologic Response Unit). Physical and hydrological properties of soils such as texture, available water content, hydraulic conductivity, bulk density, and organic carbon content for different layers of each soil type are considered for the SWAT model analysis. Food and Agriculture Organization of the United Nations (FAO) (FAO/UNESCO, Citation1995) and Harmonized World Soil Database (HWSD) (FAO et al., Citation2011) soil layers were used for the analysis. Site-specific soil survey information around the study area was used to verify soil properties generated from the FAO database (Abayneh et al., Citation2005).
SWAT requires rainfall, minimum and maximum temperatures, wind speed, solar radiation, and relative humidity as climate input data. Melkassa, Kulumsa, Huruta, Sire, and Dixsis daily precipitation and temperature recording stations data from 1985 to 2010 got from the Ethiopian Institute of Agricultural Research (EIAR) and Ethiopian Meteorological Agency (EMA) were used for the analysis. The model warm-up period used weather data from 1 January 1985, to 31 December 1987. This data was excluded from the subsequent analysis. The missing data were produced using an ArcSWAT weather generator (WGNMarker4).
Daily stream flow data of the Keleta river, at the outlet of the watershed (08° 16ʹ 36ʹ’ N and 39° 23ʹ 50ʹ’ E), for the period 1985 to 2010 were collected from the Ministry of Water, Irrigation and Electricity of Ethiopia (). Model calibration was done for the period from 1988 to 1993, whereas validation was made for the period from 2005 to 2008. Base flow separation analysis was performed using an automated baseflow separation and recession tool established by Arnold and Allen (Citation1999). It is used to determine the runoff base flow fraction in stream flow and the base flow alpha-factor required in SWAT.
2.4 Model calibration and validation
Model calibration and validation were undertaken automatically using SWAT-CUP (Calibration and Uncertainty Programs). SUFI-2 (Sequential Uncertainty Fitting) calibration and uncertainty algorithm, which is one algorithm in the SWAT-CUP, were used to carry out sensitivity analysis, calibration, uncertainty analysis, and validation of the SWAT model output. As recommended by Winchell et al. (Citation2010), At the early stage of calibration the Latin hypercube sampling intervals and one-factor-at-a-time value parameter change method were used to conduct local sensitivity analysis for 22 parameters governing flows in ArcSWAT. Global sensitivity analysis was used using SUFI-2 for further parameter sensitivities. The sensitivity of each parameter was identified using a t-test (larger in absolute values are more sensitive), and p-values were used to determine the significance of the sensitivity (a value close to zero has more significance) (Abbaspour, Citation2012).
The P factor is used to quantify model uncertainties. It is the percentage inclusion of measured value by 95% prediction uncertainty (95PPU). The strength of a calibration or uncertainty analysis is the R-factor. It is the 95PPU average thickness divided by the standard deviation of the measurement. The P-factor approach to 100%, and the R-factor to one shows the goodness of calibration and prediction uncertainty (Abbaspour, Citation2012). Statistical indices such as Nash Sutcliff efficiency (NSE), the ratio of the root-mean-square error to the standard deviation of measured data (RSR), and percentage bias (PBIAS) were used to evaluate the performance of calibration parameters recommended by Moriasi et al. (Citation2007) and (Santhi et al., Citation2001). NSE, PBIAS and, RSR are computed using Equationequation 2(2)
(2) , Equation3
(3)
(3) , and Equation4
(4)
(4) , respectively:
Where Oi is the ith observed value for the streamflow (m3/s), and Pi is the ith predicted value for the streamflow (m3/s), is the mean of observed streamflow for the entire evaluation time period (m3/s), and
is the mean of model predicted streamflow for the entire evaluation time period (m3/s), and n is the total number of observations.
3. Results and discussion
3.1 LULC dynamics
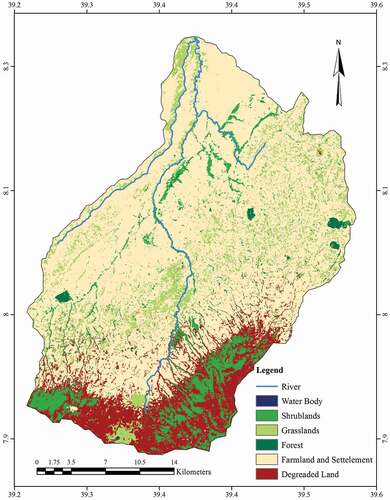
LULC change of Keleta watershed shows that farmlands and settlement areas have substantially expanded from 1985 to 2010 (). In 1985, about 49.7% of the watershed area was under farmlands and settlement, but in 2010 this increased to 67.5%. This resulted in the conversion of 15,073 ha land at an average rate of 580 ha per year from 1985 to 2010. The grasslands cover in the watershed progressively declined. In 1985, 25,000 ha (29.6%) of the total land area was under grassland but this shrunk to 8,960 ha (10.6%) in 2010, resulting in the conversion of 16,040 ha land from 1985 to 2010. However, degraded land expanded from 7170 ha (8.5%) to 10,428 ha (12.3%). Forests and water bodies showed a slight increment. Forest cover increase may be attributed because of the afforestation program of the government in the watershed. The overall accuracies got from the images were higher than the 85% minimum threshold set by Anderson et al. (Citation1976) and Thomlinson et al. (Citation1999) for effective LULC change analysis. Bekele et al. (Citation2019a) presented a detailed study of LULC dynamics in the study area ( and ).
Table 1. LULC change in Keleta watershed, from 1985 to 2010
Figure 3. Land use and land cover in 1985
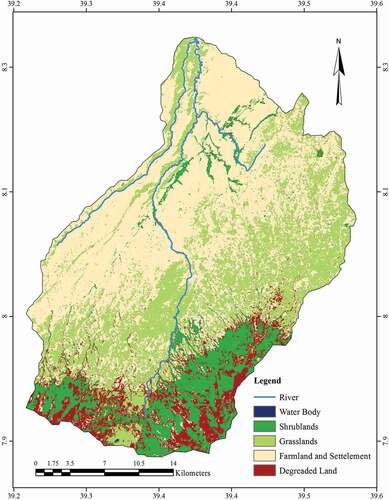
Figure 4. Land use and land cover in 2010
The LULC transition matrix shows the greatest expansion of farmlands and settlement took place in the watershed, mainly at the expense of grassland (29.5%). Shrub land cover was transformed into farmland and settlement 19.5%, degraded land 16.3%, and grassland 5.8%. The major land use transitions to degrade land between 1985 and 2010 were mostly from shrub land (44.4%) followed by grassland (9%) and farmland and settlement (6.5%) (). Farmland and settlement expansion at the expense of grasslands mainly due to rapid population increase and their demand for diverse products and soil fertility deterioration (Desalegn et al., Citation2014). Asmamaw et al. (Citation2011) also suggested that growing population pressure is one factor that contributes to the destruction of natural vegetation.
Table 2. LULC transition matrix area in ha and percent from 1985 to 2010
3.2 Sensitivity analysis
Nine parameters were sensitive, with the p-value between 0 and 0.23 and t-stat value ranging from −16.5 to 1.20, respectively (). Six parameters mainly affect the surface runoff (CN2, CANMX, CH_K2, ESCO, SOL_AWC, and SOL_BD) and the remaining three affect the base flow generation. Among these, the most sensitive parameters (P < 0.01) were Curve number II (CN2) and Maximum canopy storage (CANMAX) (Abbaspour, Citation2012).
Table 3. Streamflow parameters, ranges and rank from the global sensitivity for final calibration and uncertainty analysis
3.3 Model uncertainty, calibration and validation
The percentage of observations bracketed by the 95% prediction uncertainty (95PPU) was 73% for calibration and 75% for validation during the baseline scenarios (1985). The R-factor, which is the average thickness of the 95PPU band divided by the standard deviation of the measured data, was 1.03 for calibration and 1.55 for validation (). Abbaspour (Citation2012) suggested a P‐factor value greater than 70% for discharge, R‐factor of around 1 as acceptable ().
Figure 5. Monthly average observed and simulated flow
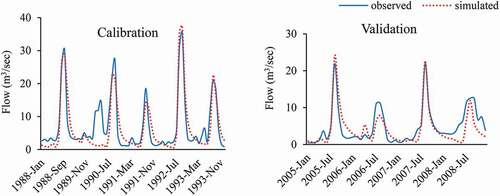
Calibration and validation of the SWAT model performed well for the monthly period (NSE = 0 · 74 and RSR ≤ 0.51; ). A good agreement between simulated and measured stream flow, along with reasonable accuracy of the model results, ensured the higher values of NSE and lower values of RSR. Despite its overall good agreement, the value in 1990 deviated from the simulated may be attributed to data quality problems owing to political turmoil in 1990/91. PBIAS were also satisfactory (≤13.2%), which is within the range of recommendation (−25 to +25%). The models slightly underestimated stream flow (Gupta et al., Citation1999). According to Moriasi et al. (Citation2007), the following performance rating of statistics for stream flow monthly time step is satisfactory: RSR <0.70, NSE >0.5 (Santhi et al., Citation2001)
Table 4. Summary statistics of calibration and uncertainty analysis of streamflow for the baseline (1985)
3.4 Effects of LULC change on hydrological processes
The hydrological processes of the Keleta watershed for both the LULC scenario are shown in . About 575 mm (66.1%) of the 869 mm mean annual precipitation that occurs in watershed returns to the atmosphere through evaporations. The number further increased to 581.9 (66.9%) for the 2010 scenario. The annual surface runoff, groundwater flow, and water yield were estimated at 59.8, 41.3, and 206.9 mm, respectively, for the 1985 scenario. This number changed to 61.6, 34.2 and 208.2 mm, respectively, for the 2010 scenario. The result has shown that an increased runoff and water yield amount by 10.4% and 0.58%, respectively, and decreasing base flow by 3.48% ().
Table 5. Average annual water balances simulated for both scenario
Table 6. Runoff, base flow and water yield of both simulation and percentage change of each sub-watershed at Keleta Watershed
An increased mean annual evaporation resulted from temperature change in the study watershed (Bekele et al., Citation2019b). A significant LULC transformation as expansion of subsistence cultivation and degraded areas and shrinkage of natural vegetation covers such as shrub and grasslands has been observed since 1985 (). These LULC conversion patterns had considerable effects for a significant change in surface runoff and base flow. According to Haregeweyn et al. (Citation2015) relatively high runoff rate on degraded and cultivable land is attributed to decrease surface roughness, which increases flow velocity and reduces infiltration. Gessesse et al. (Citation2015) also suggested that the expansion of cultivated land has a high potential for surface runoff generation because, like degraded lands, cultivated land is uncovered at the commencement of the rainy season. Hundecha and Bardossy (Citation2004) similarly concluded that an increase of both the peak runoff and the total runoff volume resulted from intensified deforestation and land degradation. Ultimately, it reduces water availability, increases the incidence of flooding, and affects the quality of the water (Aredehey et al., Citation2020; Gashaw et al., Citation2019).
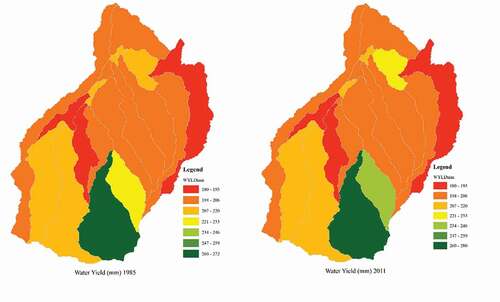
With 1985 LULC scenario, the maximum discharge was 82 mm and observed at one sub-watershed on the southern part of the watershed (). In 2010, runoff for this watershed increased to 100 mm. Most sub-watersheds showed an increasing trend of mean runoff amount. The overall mean annual base flow in the watershed decreased from 89.2 mm in 1985 to 86.2 mm in 2010, which showed a 3.5% decline. The maximum base flow change was also observed in the southern part of the watershed (). Water yield shows a slight increment for the 2010 LULC scenario, which was also observed in the southern and northern parts of the basin ().
Figure 6. Spatial distribution of runoff for 1985 and 2010 LULC scenario
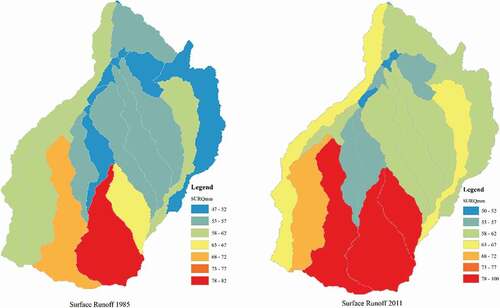
Figure 7. Spatial distribution of baseflow for 1985 and 2010 LULC scenario
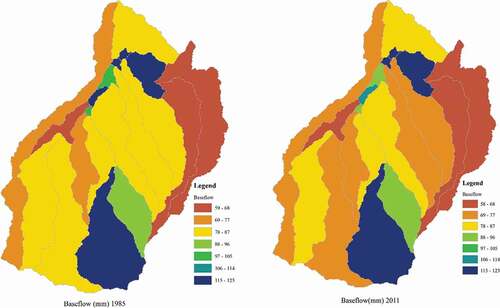
Figure 8. Spatial distribution of water yield for 1985 and 2010 LULC scenario
The result revealed that most the runoff and base flow generated from the southern part of the watershed and which is mainly the highest altitude and slope (). This area also seriously affected LULC change, specifically declining vegetation cover and as a result change of the hydrological processes (Bekele et al., Citation2019a; Woldesenbet et al., Citation2017). The results verified hydrological processes altered because of landscape management in the watershed (Akale et al., Citation2019; Tebebu et al., Citation2015).
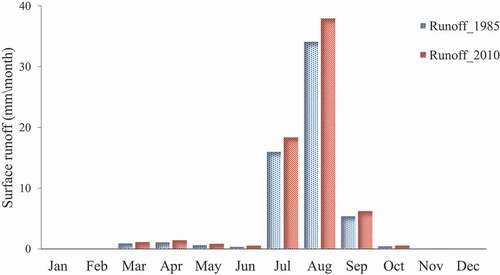
The Maximum value of mean monthly surface runoff was observed during the main rainy season (July, August, and September) subsequently the short season (March, April, and May) (). The maximum runoff observed during these seasons related to the significant amount and distribution of rainfall in the rainy season (Bekele et al., Citation2017; Kassie et al., Citation2013). Precipitation is the dominant factor affecting the hydrologic system and any trends in precipitation will affect trends in the hydrologic processes (Huang & Zhang, Citation2004).
Figure 9. Average monthly runoff distribution for both LULC model simulation
4. Conclusions and recommendations
Inappropriate landscape conversion and subsequent hydrological circumstance is one of the key problems threatening environmental welfare and sustainable development. Analyses of Landsat images from 1985 to 2010 showed that the Keleta watershed has undergone a major LULC transformation. SWAT model analysis revealed that these LULC transformations caused a decline in the annual mean base flow of 3.5%, 10.4%, and 0.6% rise in the annual mean surface runoff and water yield over the same study period, respectively. The result revealed that most of the runoff and base flow generated from the southern part of the basin and reach maximum value during the main rainy season (July, August, and September) followed by the short season (March, April, and May). The trend of increasing surface runoff and declining groundwater flow due to LULC changes has wider implications for environmental and water resource development. Sedimentation and siltation of water resource structure coupled with flooding and falling of the groundwater level will hamper the socio-economic development of the country. Thus, the appropriate LULC plan and management for those areas are decisive.
Competing interests
The authors declares no competing interests.
PUBLIC INTEREST STATEMENT
The watershed has undergone a major land use and land cover transformation. Ultimately, a decline in base flow and rise in peak runoff has been observed. The trend of increasing surface runoff and declining groundwater flow due to LULC changes has wider implications for environmental and water resource development. This is expected to exert a substantial adverse impact on ecosystem, hydraulic structures such as dams, reservoirs, and irrigation canals, and rural livelihoods unless appropriately integrated landscape management implemented.
Acknowledgements
Open Access funding provided by the Qatar National Library.
Disclosure statement
No potential conflict of interest was reported by the author(s).
Additional information
Funding
Notes on contributors
Daniel Bekele
Daniel Bekele (PhD) is a senior researcher of watershed management at the Ethiopian Institute of Agricultural Research (EIAR). His research interests are agricultural water management, soil and water conservation, hydrology modeling related to climate change and landscape transformation, and watershed management.
References
- Abayneh, E., Demeke, T., & Ashenafi, A. (2005). Soils of Melkassa research center and its testing sites. Ethiopian Agricultural Research Organization (EARO).
- Abbaspour, K. C. (2012). SWAT- CUP: SWAT calibration and uncertainty programs - user manual. Swiss Federal Institute of Aquatic Science and Technology.
- Abere, T., Adgo, E., Afework, S., & Li, F. (2020). Trends of land use/cover change in Kecha-Laguna paired micro watersheds, Northwestern Ethiopia. Cogent Environmental Science, 6(1), 1801219. https://doi.org/https://doi.org/10.1080/23311843.2020.1801219
- Akale, A. T., Dagnew, D. C., Moges, M. A., Tilahun, S. A., & Steenhuis, T. S. (2019). The effect of landscape interventions on groundwater flow and surface runoff in a watershed in the upper reaches of the Blue Nile. Water, 11(10), 1–14. https://doi.org/https://doi.org/10.3390/w11102188
- Anderson, J. R., Hardy, E. E., Roach, J. T., & Witmer, R. E. (1976). A land use and land cover classification system for use with remote sensor data. USGS professional paper 964. US Geological Survey. Washington, USA
- Aredehey, G., Mezgebu, A., Girma, A., & Li, F. (2020). The effects of land use land cover change on hydrological flow in Giba catchment, Tigray, Ethiopia. Cogent Environmental Science, 6(1), 1785780. https://doi.org/https://doi.org/10.1080/23311843.2020.1785780
- Arnold, J. G., & Allen, M. P. (1999). Automated methods for estimating baseflow and ground water recharge from streamflow records. Journal of the American Water Resources Association, 35(2), 411–424. https://doi.org/https://doi.org/10.1111/j.1752-1688.1999.tb03599.x
- Arnold, J. G., Srinivasan, R., Muttiah, R. S., & Williams, J. R. (1998). Large area hydrologic modeling and assessment part I: Model development. Journal of the American Water Resources Association, 34(1), 73–89. https://doi.org/https://doi.org/10.1111/j.1752-1688.1998.tb05961.x
- Asmamaw, L. B., Mohammed, A. A., & Lulseged, T. D. (2011). Land use/cover dynamics and their effects in the Gerado catchment, northeastern Ethiopia. International Journal of Environment, 68(6), 883–900. https://doi.org/https://doi.org/10.1080/00207233.2011.637701
- Baker, T. J., & Miller, S. N. (2013). Using the Soil and Water Assessment Tool (SWAT) to assess land use impact on water resources in an East African watershed. Journal of Hydrology, 486, 100–111. https://doi.org/https://doi.org/10.1016/j.jhydrol.2013.01.041
- Bekele, D., Alamirew, T., Kebede, A., Zeleke, G., & Assefa, M. (2019a). Land use and land cover dynamics in the Keleta watershed, Awash River basin, Ethiopia. Environmental Hazards, 18(3), 246–265. https://doi.org/https://doi.org/10.1080/17477891.2018.1561407
- Bekele, D., Alamirew, T., Kebede, A., Zeleke, G., & Melese, A. M. (2017). Analysis of rainfall trend and variability for agricultural water management in Awash River Basin, Ethiopia. Journal of Water and Climate Change, 8(1), 127–141. https://doi.org/https://doi.org/10.2166/wcc.2016.044
- Bekele, D., Alamirew, T., Kebede, A., Zeleke, G., Melesse, M., & A. (2019b). Modeling climate change impact on the hydrology of Keleta watershed in the Awash River Basin, Ethiopia. Environmental Modeling & Assessment, 24(1), 95–107. https://doi.org/https://doi.org/10.1007/s10666-018-9619-1
- Bewket, W., & Sterk, G. (2005). Dynamics in land cover and its effect on stream flow in the Chemoga watershed, Blue Nile basin, Ethiopia. Hydrological Processes, 19(2), 445–458. https://doi.org/https://doi.org/10.1002/hyp.5542
- Campbell, J. B., & Wynne, R. H. (2011). Introduction to remote sensing (5th ed.). The Guilford Press.
- DeFries, R., & Eshleman, K. N. (2004). Land-use change and hydrologic processes: A major focus for the future. Hydrological Processes, 18(11), 2183–2186. https://doi.org/https://doi.org/10.1002/hyp.5584
- Desalegn, T., Cruz, F., Kindu, M., Turrión, M. B., & Gonzalo, J. (2014). Land-use/land-cover (LULC) change and socioeconomic conditions of local community in the central highlands of Ethiopia. International Journal of Sustainable Development & World Ecology, 21(5), 406–413. https://doi.org/https://doi.org/10.1080/13504509.2014.961181
- FAO. (2020). Global forest assessment resources 2020 (No.163). Forestry Paper. Rome, Italy.
- FAO, IIASA, ISRIC, ISS-CAS, JRC. (2011). Harmonized world soil database. FAO, Rome, Italy and IIASA.
- FAO/UNESCO. (1995). The digital soil map of the world, food and agriculture organization of the United Nations. Food and Agriculture Organization of the United Nations.
- Garedew, E., Sandewall, M., Söderberg, U., & Campbell, B. M. (2009). Land-use and land-cover dynamics in the central rift valley of Ethiopia. Environmental Management, 44(4), 683–694. https://doi.org/https://doi.org/10.1007/s00267-009-9355-z
- Gashaw, T., Tulu, T., Argaw, M., & Worqlul, A. W. (2019). Modeling the impacts of land use–land cover changes on soil erosion and sediment yield in the Andassa watershed, upper Blue Nile basin, Ethiopia. Environmental Earth Sciences, 78(24), 679. https://doi.org/https://doi.org/10.1007/s12665-019-8726–x
- Gessesse, B., Bewket, W., & Bräuning, A. (2015). Model based characterization and monitoring of runoff and soil erosion in response to land use/land cover changes in the Modjo watershed, Ethiopia. Land Degradation & Development, 26(7), 711–724. https://doi.org/https://doi.org/10.1002/ldr.2276
- Gupta, H. V., Sorooshian, S., & Yapo, P. O. (1999). Status of Automatic Calibration for Hydrologic Models: Comparison with Multilevel Expert Calibration. Journal of Hydrologic Engineering, 4(2), 135–143. https://doi.org/http://doi.org/10.1061/1084-0699
- Haregeweyn, N., Tesfaye, S., Tsunekawa, A., Tsubo, M., Tsegaye Meshesha, D., Adgo, E., & Elias, A. (2015). Dynamics of land use and land cover and its effects on hydrologic responses: Case study of the Gilgel Tekeze catchment in the highlands of Northern Ethiopia. Environmental Monitoring and Assessment, 187(1), 2–14. https://doi.org/https://doi.org/10.1007/s10661-014-4090-1
- Hu, C., Zhang, L., Wu, Q., Soomro, S. E. H., & Jian, S. (2020). Response of LUCC on runoff generation process in middle yellow river basin: The Gushanchuan basin. Water 2020, 12(5), 1237. https://doi.org/https://doi.org/10.3390/w12051237
- Huang, M., & Zhang, L. (2004). Hydrological responses to conservation practices in a catchment of the Loess Plateau, China. Hydrological Processes, 18(10), 1885–1898. https://doi.org/https://doi.org/10.1002/hyp.1454
- Hundecha, Y., & Bardossy, A. (2004). Modeling of the effect of land use changes on the runoff generation of a river basin through parameter regionalization of a watershed model. Journal of Hydrology, 292(1–4), 281–295. https://doi.org/https://doi.org/10.1016/j.jhydrol.2004.01.002
- Kassie, B. T., Rötter, R. P., Hengsdijk, H., Asseng, S., Van Ittersum, M. K., Kahiluoto, H., & Van Keulen, H. (2013). Climate variability and change in the Central Rift Valley of Ethiopia: Challenges for rainfed crop production. The Journal of Agricultural Science, 152(1), 58–74. https://doi.org/https://doi.org/10.1017/S0021859612000986
- Lambin, E. F., & Meyfroidt, P. (2011). Global land use change, economic globalization, and the looming land scarcity. Proceedings of the National Academy of Sciences, 108(9), 3465–3472. https://doi.org/https://doi.org/10.1073/pnas.1100480108
- Leh, M., Bajwa, S., & Chaubey, I. (2011). Impact of land use change on erosion risk: An integrated remote sensing, geographic information system and modeling methodology. Land Degradation & Development, 24(5), 409–421. https://doi.org/https://doi.org/10.1002/ldr.1137
- Li, S., Yang, H., Lacayo, M., Liu, J., & Lei, G. (2018). Impacts of land-use and land-cover changes on water yield: A case study in Jing-Jin-Ji, China. Sustain, 10(4), 960. https://doi.org/https://doi.org/10.3390/su10040960
- Lillesand, T. M., Kiefer, R. W., & Chipman, J. W. (2004). Remote sensing and image interpretation (5th ed.). John Wiley & Sons, Inc.
- Liu, Y., Huang, W., & Liu, G. (2014). Land use and climate changes and their impacts on Runoff in the Yarlung Zangbo River Basin, China. Land Degradation & Development, 25(3), 203–215. https://doi.org/https://doi.org/10.1002/ldr.1159
- Mayaux, P., Bartholome, E., Fritz, S., & Belward, A. (2004). A new land cover map of Africa for the year 2000. Journal of Biogeography, 31(6), 861–877. https://doi.org/https://doi.org/10.1111/j.1365-2699.2004.01073.x
- Mensah, C., Atayi, J., Kabo-Bah, A. T., Švik, M., Acheampong, D., Kyere-Boateng, R., Prempeh, N. A., Marek, M. V., & Li, F. (2020). Impact of urban land cover change on the garden city status and land surface temperature of Kumasi. Cogent Environmental Science, 6(1), 1787738. https://doi.org/https://doi.org/10.1080/23311843.2020.1787738
- Moriasi, D. N., Arnold, J. G., Liew, M. W., Van, Bingner, R. L., Harmel, R. D., & Veith, T. L. (2007). Model evaluation guidelines for systematic quantification of accuracy in watershed simulations. American Society of Agricultural and Biological Engineers, 50(3), 885–900. https://doi.org/http://doi.org/10.13031/2013.23153
- Neitsch, S. L., Arnold, J. G., Kiniry, J. R., & Williams, J. R. (2009). Soil & water assessment tool theoretical documentation version 2009. Agricultural Research Service and Texas A&M University
- Niehoff, D., Fritsch, U., & Bronstert, A. (2002). Land-use impacts on storm-runoff generation: Scenarios of land-use change and simulation of hydrological response in a meso-scale catchment in SW-Germany. Journal of Hydrology, 267(1–2), 80–93. https://doi.org/https://doi.org/10.1016/S0022-1694(02)00142-7
- Obeidat, M., Awawdeh, M., & Lababneh, A. (2019). Assessment of land use/land cover change and its environmental impacts using remote sensing and GIS techniques, Yarmouk River Basin, north Jordan. Arabian Journal of Geosciences, 12(22), 685. https://doi.org/https://doi.org/10.1007/s12517-019-4905–z
- Santhi, S., Arnold, J. G., Williams, J. R., Dugas, W. A., Srinivasan, R., & Hauck, L. M. (2001). Validation of the SWAT model on a large river basin with point and non point sources. Journal of the American Water Resources Association, 37(5), 1169–1188. https://doi.org/https://doi.org/10.1111/j.1752-1688.2001.tb03630.x
- Tebebu, T. Y., Steenhuis, T. S., Dagnew, D. C., & Guzman, C. D. (2015). Improving efficacy of landscape interventions in the (sub) humid Ethiopian highlands by improved understanding of runoff processes. Frontiers in Earth Science, 49(3), 1–13. https://doi.org/https://doi.org/10.3389/feart.2015.00049
- Thomlinson, J. R., Bolstad, P. V., & Cohen, W. B. (1999). Coordinating methodologies for scaling landcover classifications from site-specific to global : Steps toward validating global map products. Remote Sensing of Environment, 70(1), 16–28. https://doi.org/https://doi.org/10.1016/S0034-4257(99)00055-3
- Tibebe, D., & Bewket, W. (2011). Surface runoff and soil erosion estimation using the SWAT model in the Keleta watershed, Ethiopia. Land Degradation & Development, 22(6), 551–564. https://doi.org/https://doi.org/10.1002/ldr.1034
- Tran, L. T., & O’Neill, R. V. (2013). Detecting the effects of land use/land cover on mean annual streamflow in the Upper Mississippi River Basin, USA. Journal of Hydrology, 499(2013), 82–90. https://doi.org/https://doi.org/10.1016/j.jhydrol.2013.06.041
- Wagner, P. D., Kumar, S., & Schneider, K. (2013). An assessment of land use change impacts on the water resources of the Mula and Mutha Rivers catchment upstream of Pune, India. Hydrology and Earth System Sciences, 17(6), 2233–2246. https://doi.org/https://doi.org/10.5194/hess-17-2233-2013
- Wang, G., Liu, J., Kubota, J., & Chen, L. (2007). Effects of land-use changes on hydrological processes in the middle basin of the Heihe River, northwest China. Hydrological Processes, 21(10), 1370–1382. https://doi.org/https://doi.org/10.1002/hyp.6308
- Wang, W., Shao, Q., Yang, T., Peng, S., Xing, W., Sun, F., & Luo, Y. (2013). Quantitative assessment of the impact of climate variability and human activities on runoff changes : A case study in four catchments of the Haihe River basin, China. Hydrological Processes, 27(8), 1158–1174. https://doi.org/https://doi.org/10.1002/hyp.9299
- Welde, K., & Gebremariam, B. (2017). Effect of land use land cover dynamics on hydrological response of watershed: Case study of Tekeze Dam watershed, northern Ethiopia. International Soil and Water Conservation Research, 5(1), 1–16. https://doi.org/https://doi.org/10.1016/j.iswcr.2017.03.002
- Wijesekara, G. N., Gupta, A., Valeo, C., Hasbani, J. G., Qiao, Y., Delaney, P., & Marceau, D. J. (2012). Assessing the impact of future land-use changes on hydrological processes in the Elbow River watershed in southern Alberta, Canada. Journal of Hydrology, 412-413(2012), 220–232. https://doi.org/https://doi.org/10.1016/j.jhydrol.2011.04.018
- Winchell, M., Srinivasan, R., Di Luzio, M., & Arnold, J. (2010). ArcSWAT interface for SWAT 2009: User’s guide. USDA Agricultural Research Service
- Woldesenbet, T. A., Elagib, N. A., Ribbe, L., & Heinrich, J. (2017). Hydrological responses to land use/cover changes in the source region of the Upper Blue Nile Basin, Ethiopia. Science of the Total Environment, 575(2016), 724–741. https://doi.org/https://doi.org/10.1016/j.scitotenv.2016.09.124
- Yan, B., Fang, N. F., Zhang, P. C., & Shi, Z. H. (2013). Impacts of land use change on watershed streamflow and sediment yield: An assessment using hydrologic modelling and partial least squares regression. Journal of Hydrology, 484(2013), 26–37. https://doi.org/https://doi.org/10.1016/j.jhydrol.2013.01.008