 ?Mathematical formulae have been encoded as MathML and are displayed in this HTML version using MathJax in order to improve their display. Uncheck the box to turn MathJax off. This feature requires Javascript. Click on a formula to zoom.
ABSRACT
The current boom in the industrial sector of the country is arise scientific concern about environmental contamination by heavy metals such as chromium. The objective of this project is to fabricate a sensitive and selective electrode for differential pulse voltammetric determination of Cr (VI) in water samples and demonstrate its applicability in complex matrices such as tannery effluent. The drop casting method is use for electrode development. Experimental variables that can influence the DPV response of the developed electrode for Cr (VI) including strength of supporting electrolytes, pH of the solution, and concentration parameters were optimized. The figures of merit of the developed electrode were evaluated and the applicability was demonstrated through determination of Cr (VI) in tannery effluent water. The developed electrode was detected a very low level of Cr (VI) in acetate buffer at pH 5 with limit of detection and limit of quantification 0.0885 and 0.2950 μmol L−1, respectively. The linear calibration plot is R2 value of 0.999 suggesting a very good correlation between DPV current response and concentration of Cr (VI). The current electrode was simple to develop and can successfully be applied for the determination of Cr (VI) in wastewater samples.
1. Introduction
Chromium is the 21st most abundant mineral in the earth’s crust. Louis Nicolas Vauquelin, a French chemist, discovered it in 1797. It was given the name chromium because of the numerous diverse colors of its compounds (the Greek word “chroma” means “color”) (N. Rai & Rai, Citation2008). Chromium is commonly used in metallurgical, refractory and chemical sectors, as in production of pigment and paint, galvanization, plating, wood, and especially in the tanning industry. Determination of trace chromium and its speciation is important because of its environmental hazards that depend critically on its oxidation state (Shrivastava et al., Citation2002; Μolla et al., Citation2017). Chromium exhibits several oxidation states, trivalent (Cr (III)) and hexavalent (Cr (VI)) chromium being the most common, which dictate its chemical reactivity and, therefore, its environmental and biological significance (Mulushewa et al., Citation2021; Stasicka & Kota´, Citation2000; Tagesse & Haile, Citation2021). Cr (VI) is acidic and is the most environmentally important state of chromium. In this form, chromium is highly soluble in water and, therefore, mobile, whereas the reduced Cr(III) form is almost insoluble in water and thus immobile (Apte et al., Citation2005). All Cr (VI) compounds are strong oxidizing agents, corrosive to flesh, and considered toxic and potentially carcinogenic (MansouriMajd et al., Citation2013). Intake of large amounts of Cr (VI) can cause kidney and liver damage and skin contact is known to lead to skin ulcers.
Generally, two approaches have been proposed for Cr speciation in environmental samples: in the first the determination of the specific forms are carried out independently whereas the second approach, the concentration of one of the forms is determined following the determination of the total concentration and the second component is determined from the difference. The latter approach is based on the fact that the +3 and +6 forms are the dominant species in the environmental samples. Many methods for detecting Cr have been developed so far, including inductively coupled plasma mass spectrometry (Bini et al., Citation2008; Washe et al., Citation2013), colorimetric (Homa et al., Citation2016), fluorescence resonance, energy transfer assay (Stepniewska et al., Citation2004), UV-vis spectroscopy (SG Zhou et al., Citation2006), high-performance liquid chromatography (HPLC) (Fu & Su, Citation2010), and atomic absorption spectroscopy (Zhang et al., Citation2008) are available for the determination and speciation of Cr(III) and Cr(VI) either in off-line or on-line methods (Zhao et al., Citation2012).
Despite promising research advances, Cr speciation has remained a major scientific concern due to the limitations of the methods reported thus far. The limitations of these methods include time-consuming procedures, tedious sample preparation, chemical speciation is dependent on the efficiency of precipitation, and extraction, detection and sensitivity limits. (Liu et al., Citation2013).
Electrochemical methods have been recognized as one of the most attractive routes for trace Cr analysis, benefiting from its advantages of very low limit of detection, simplicity, high sensitivity and selectivity, and potential application for onsite monitoring (Jin et al., Citation2014; Khalilzadeh et al., Citation2020; Somayeh Tajik et al., Citation2021; Tajik, Orooji, Karimi et al., Citation2021). The choice of electrode materials and its surface modification are, however, key considerations in the application of electrochemical methods. Nickel Hexacyanoferrate (NiHCF) is the open framework structure and its analogs offers several advantages, including greater durability and faster kinetics. In the NiHCF material studied, Ni2+ occupies the nitrogen lattice sites (Orooji et al., Citation2021; Tajik, Orooji, Karimi et al., Citation2021b). Therefore, NiHCF is used as electrode surface modifier in this paper. The current study is present the first differential pulse voltammetric determination of hexavalent chromium using electro-catalytically modified using NiHCF glassy carbon electrode for determination of Cr(VI) in environmental samples collected around tanning and steel manufacturing areas in Akaki-Kaliti sub-city of Addis Ababa, Ethiopia.
2. Materials and methods
2.1. Chemicals and instruments
2.1.1. Chemical reagents
The chemical reagents used in this experiment were of analytical graded purchased from Aldrich (Sigma-Aldrich, USA). Standard solution of Cr(VI) was prepared by dissolving adequate amount of K2Cr2O7 in 0.1 M acetate buffer solution (ABS). For bare electrode characterization, serial dilutions of K3[Fe(CN)6] in 1 M KNO3 were prepared. Different pH levels pH 9.1 borate buffer solutions (BBS), pH 4.8 acetate buffer solution (ABS), and pH 2.8 phosphate buffer solution (PBS) were prepared. Nickel chloride (NiCl2) was used for electrode modification.
2.1.2. Apparatus
The electrochemical experiments were carried out in a three-electrode system containing Ag/AgCl as a reference electrode, platinum wire as a counter electrode and glassy carbon electrode (GCE) as a working electrode. The experiment and data processing were carried out with the help of a CV—50 W voltammetric analyzer. The pH of the buffer solution was measured with a 353 ATC digital pH meter with combination glass electrode.
2.2. Study methodology
The research was laid by the application of different voltammetric techniques. The electrochemical performance of studies of the target electrode (GCEs) was carried out by the application of cyclic voltammetry in the potentiostat by using ferri/ferro solution. The ability of the modified Glassy Carbon Electrode (GCE) by NiHCF/GCE including selectivity, sensitivity, limit of detection, and stability, for chromium determination was studied by Differential Pulse Voltammetry (DPV). (Sohail et al., Citation2019)
2.3. Sample collection
Industrial wastewater (tannery effluent) was collected from disposal point and the river around tanning area directly into washed polyethylene container and the collected sample was filtered through a Watmann N.42 filter paper and then the filtrate wastewater sample was stored in refrigerator at +4°C in cleaned sample bottle. Statistical methods were used to collect industrial wastewater samples containing chromium (VI) from the river near the tanning and manufacturing areas of A.A’s Akaki-Kality sub-city:
2.4. Electrode characterization
The characterization of electrode behavior is the process of identifying the behavior of working electrode (GCE), which is used to compare the character of electrode with its character after pretreatment or modification. The electrochemical characteristics including charge transfer kinetics and reversibility in the solvent treated electrodes using cyclic voltammetry were investigated.
2.4.1. Preparation of solutions for electrode characterization
First, 500 mL stock solution of 1 M KNO3 was prepared from stock of standard potassium nitrate by dissolving 50.55 g of solid KNO3. Then, 100 ml of 100 mM K3[Fe(CN)6] in 1 M KNO3 was prepared by measuring 3.2925 g of solid K3[Fe(CN)6] and dissolving it in to the solvent (solution of 1 M KNO3). Finally, serial dilutions from 100 mM K3[Fe(CN)6] in 100 mL solutions of 0.001 mM, 0.01 mM, 0.1 mM, 1 mM, 10 mM, and 100 mM of K3[Fe(CN)6] within 1 M KNO3 were performed (Chuanchuan et al., Citation2021).
Acetate buffer solution 0.1 M (ABS) pH 4.8 was prepared by dissolving 6.8 g of CH3COONa and 2.87 mL of glacial acetic in distilled water of 1 Liter volume flask. 0.1 M phosphate buffer solution (PBS) pH 2.8 was prepared by adding 6.24 g of NaH2PO4.2H2O and 0.6 mL of H3PO4 in distilled water of 1 Liter volume flask. 0.1 M borate buffer solution (BBS) pH 9.1 was prepared by dissolving 6.18 g of boric acid and 2 g of sodium hydroxide in distilled water of 1 Liter volume flask. All the prepared buffer solutions were adjusted its pH value, by dropping 0.1 M NaOH or 0.1 M HCl to the buffer. The standard solution of 0.1 M K2Cr2O7 for determination of Cr(VI) in the sample was prepared as by dissolving 2.9418 g of K2Cr2O7 in 100 mL volume buffer solutions in three of each ABS, PBS, and BBS and then measure in CV technique. (Bishop et al., Citation2020)
2.4.2. Electrode preparation
The glassy carbon electrode was characterized by adjusted cyclic voltammetry technique using ferri/ferro solution as follows; The glassy carbon electrode working electrode (WE), the Ag/AgCl reference electrode (RE), and the platinum wire counter electrode (CE) connected to the instrument were placed. The working glassy carbon electrode was made by softly polishing the electrode surface on a flat polishing plate with tiny particles of alumina slurry (0.05 mm). To eliminate any alumina, the electrode was gently cleaned with distilled water. The electrode was then immersed in concentrated HNO3 for a minute before being sonicated. Finally, the electrode was removed and cleaned with distilled water before being touched with clean tissue paper at the edges of the tip (Bishop et al., Citation2020)
2.4.3. Characterization of bare glassy carbon electrode after polishing
The polished electrodes were connected and serial solutions of K3[Fe(CN)6] were introduced to the cell. Different concentrations of K3[Fe(CN)6] (0.001 mM, 0.01 mM, 0.1 mM, 1 mM, 10 mM, and 100 mM) were measured at a constant scan rate of 50 mV/s. Each data set was measured and recorded at a different scan rate (25, 50, 75, and 100 mV/s) with constant concentration (10 mM K3[Fe(CN)6] at potential difference between −4 and 1 V.
2.4.4. Activating and characterization of bare glassy carbon electrode after activating
The electrode was activated by adding 0.1 M NaOH in to the cell and adjusts CV technique with segment = 10, the potential between 0 and 1 V and the scan rate of 50 mV/s automatically then the activation result was recorded. After activation of electrode, each of serial solutions (0.001 mM, 0.01 mM, 0.1 mM, 1 mM, 10 mM, and 100 mM of K3[Fe(CN)6]) was added to the cell and the electrodes were connected. The different concentration of K3[Fe(CN)6] with constant scan rate 50 mV/s was measured. Different scan rate (25, 50, 75, and 100 mV/s) with constant concentration (10 mM K3[Fe(CN)6]) was measured and recorded each data. (Bishop et al., Citation2020)
2.5. Determination of Cr (VI) in real sample by using bare GCE and modified NiHCF/GCE
The determination of Cr (VI) in the sample was achieved by using acetate buffer solution as a background solution. The sample with higher chromium concentration was diluted to maintain concentration in the linearity region. The 50 mL of water sample was diluted with 50 mL of 0.1 M ABS in 100 ml volumetric flask. (Posta et al., Citation1996)
The differential pulse voltammogram was recorded in the potential range between −800 and 0 mV Vs Ag/AgCl at a scan rate 50 mV/s. The concentration of chromium (VI) in the sample was determined from the calibration curve. Chromium (VI) in the real sample was determined without spiking the sample and also on spiking with known concentrations of standard chromium (VI) in the samples. Sensitivity, limit of detection, and limit of quantification of the current electrode was analyzed by comparing the different types of voltammograms like sweeping, cyclic, anodic stripping, and the selectivity was studied by applying some interfering species.
2.6. Modification of glassy carbon electrode by using Nickel Hexa-cyanoferrate
A Nickel Hexacyanoferrate thin film was coated on glassy carbon electrode (GCE) surfaces. This was occurred by drop casting the precipitate of Nickel Hexacyanoferrate on the polished and heated glassy carbon electrode.
2.6.1. Preparing the solution of modifier NiHCF for the GCE
In 500 mL volumetric flask, 10 mM NiCl2 and 10 mM K3Fe(CN)6 were prepared with 0.2 M NaNO3. To make the solution, the chemicals were weighed and dissolved in distilled water. In 500 mL of distilled water, 8.5 g of NaNO3, 1.2 g of NiCl2, and 1.65 g of K3Fe(CN)6 were dissolved. An electromagnetic stirrer was used to speed up the dissolution, and the precipitate was formed when it settled.
2.6.2. Analysis of background Solution with DPV using modified NiHCF/GCE
All this measurements was carried out in an ambient temperature of 25 2
. The background solution of acetate buffer solution was analyzed by DPV to study the effect of background solution on the electrochemical peaks of Cr (VI) by differential pulse voltammograms. Then the peaks were recorded.
2.6.3. Determination of Cr(VI) in standard solution using modified NiHCF/GCE
The modified electrode was rinsed by distilled water slowly and adjusts CV technique with segment = 10 and the scan rate of 50 mV/s automatically the activation results were recorded. The concentration of different K2Cr2O7 at constant scan rate 50 mV/s was measured. The different scan rate (15 mV/s, 25 mV/s, 50 mV/s, 75 mV/s, and 100 mV/s) with constant concentration (10 mM K3[Fe(CN)6]) were measured and each data was recorded. (Posta et al., Citation1996)
2.6.4. Characterization of electroactive area of the bare and modified GCEs
There are several methods to characterize the surface area of working part of the electrode but in this study, CV was study the electroactive area of the electrode. For bare electrode, the CV was recorded in 10 mM K3[Fe(CN)6] solution by varying the scan rates from 20 to 100 mV/s. The resulting peak current against the square root of scan rate was plotted. The electroactive area of the bare electrode was calculated by applying Randless-Sevcik equation: (Gardner & Comber, Citation2002)
Where ip = peak current A = area of the electrode D = diffusion coefficient
C = concentration of analyte n = number of charge transferred V = scan rat
Since n, D, C and V are constants, and then was give straight line for both modified and unmodified electrodes.
3. Results and discussion
3.1. Effect of electrode surface pretreatment
The effect of polishing on the rate of electron transfer process on the electrode’s surface was characterized qualitatively by examining the separation of the peak potentials (ΔEp) and improvement in the height of peak currents in a cyclic voltammogram recorded at scan rate of 50 mV/s in a 10 mM solution of fast charge transfer probes [Fe(CN)6]3-/4- in 1 M KNO3. As shown in pair of well-defined and nearly reversible redox peaks was observed at the CVs of polished GCE compared to unpolished GCE. The ΔEp was changed from the value characteristic of irreversible process corresponding to unpolished (ΔEp = 236 mV) to that of a nearly reversible process corresponding to polished (ΔEp = 61 mV) GCE. The observed anodic and cathodic peak current of polished GCE as shown in was larger than that of unpolished GCE shown in . The peak currents were increased by a factor of 10. These data assure that the performance of the polished glassy carbon electrode is significantly improved by mechanical polishing. (Jyothi et al., Citation2013)
Figure 1. Cyclic voltammogram of 10 mM [Fe(CN)6]3-/4− in 1 M KNO3 using unpolished GCE (A) and a1 is polished GCE(B) at scan rate of 50 mV/s and a2 correspond to unpolished GCE(B) at scan rate of 50 mV/s
![Figure 1. Cyclic voltammogram of 10 mM [Fe(CN)6]3-/4− in 1 M KNO3 using unpolished GCE (A) and a1 is polished GCE(B) at scan rate of 50 mV/s and a2 correspond to unpolished GCE(B) at scan rate of 50 mV/s](/cms/asset/8d1b2730-ef6a-4e94-88db-e9d90b0dc911/oaes_a_1978633_f0001_oc.jpg)
3.2. Electrochemical Activation of GCE
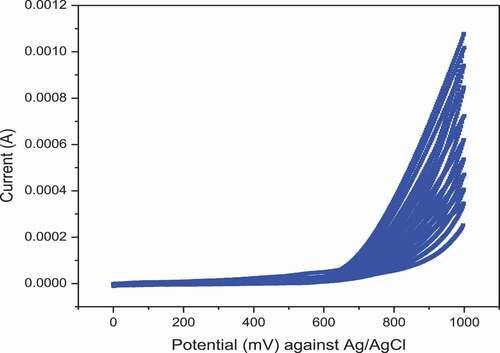
In this study, the previously polished GCE was further electro-activated by cycling (10 cycles) the potential between 0 and 1 V in a solution of 1 M NaOH in accordance with previous reports (Y. Zhou et al., Citation2013). As the cycling continues, the current peaks at extreme potential (> 0.5 V) are progressively increasing as shown in . Such progressive increase in the current should be attributed to progressive activation of electron exchange sites on the surface of the electrodes. This indicates further improvement of charge transfer kinetics on the surface of the electrode though needs to be verified. (Bishop et al., Citation2020)
Figure 2. Electrochemical activation of polished GCE by cycling the potential between 0 and 1 V in 1 M NaOH at scan rate of 50 mV/s
3.3. Comparison of enhancement of electroactive area by pretreatment methods
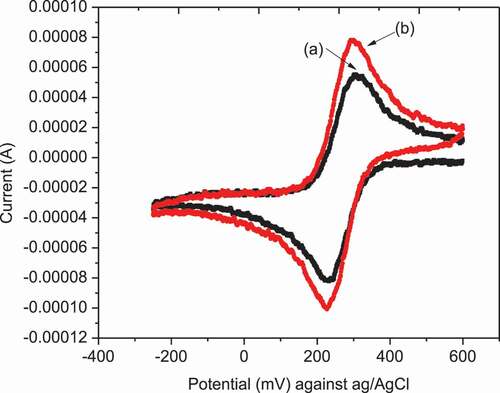
Both providing more electron exchange sites as well as introducing catalytic groups could increase electroactive area of electrodes as shown in the .
Figure 3. Voltammograms of 10 mM Fe+3 in 1 M KNO3 using (a) polished GCE and (b) Electrochemically activated after polishing GCE at scan rate of 25 mV/s
3.4. Characterization of electrocatalytic modification of GCE with NiHCF
In this case, modification of the electrode’s surface with materials having catalytic properties in the charge transfer process at the interface is important. The modification was characterized by recording CV as shown in . The appearance of peaks characteristic of Fe+3/Fe+2 redox reactions in the region 200–600 mV served as a proof of presence of the NiHCF film on electrode’s surface. (Chuanchuan et al., Citation2021)
Figure 4. Electrochemical Characterization of GCE modified NiHCF/GCE by cycling potential between 0 and 1 V in 1 M KNO3solution at scan rate of 50 mV/s
3.5. Characterization of NiHCF-GCE electrode using area determination
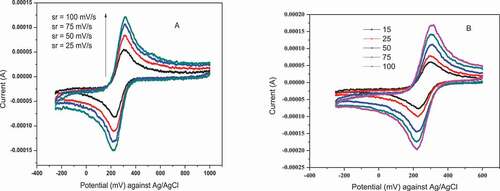
In order to compare the sensitivity of activated GCE and NiHCF-GCE, determination of Aeff was carried out by using cyclic voltammetric technique with 10 mM [Fe(CN)6]3-/4- solution at different scan rate for both activated as shown in and NiHCF modified GCE as shown in . Their corresponding peak heights were recorded. Then the corresponding plots were performed by applying peak height (current) vs square of the scan rate for each of the electrode and their modified electroactive surface areas were calculated according to the Randles–Sevcik equation.
The [Fe(CN)6]3-/4-redox system used in this work is one of the most extensively studied redox couples in electrochemistry (Y. Zhou et al., Citation2013) and exhibits a heterogeneous one electron transfer (n = 1). According to the Randles–Sevcik equation, plot of peak current against square root of scan rate should give a straight line with slope m, where m = 2.69 x 10⁵ AD1/2n3/2C. The A is determined as slope divided by 2.69 × 10⁵ D1/2n3/2C.
The area of the electroactive part of the NiHCF modified GCE was increased by a factor 2 as compared to unmodified GCE. From the graphs and plot of ip vs square root of scan rate, it was observed that NiHCF-GCE shown good performance than the just polished one. In general, the electrode modifications have great effects on the electrocatalytic activity of GCE. A higher peak current value also illustrated an increase in the electroactive surface area for the NiHCF-GCE, mainly due to the deposition of NiHCF on the surface of GCE, which increased the large local rates of mass transport to the NiHCF-GCE (Jg. & Li, Citation2012). This result in the determination of the electroactive area is consistent with the results from cyclic Voltammetric study by Pifferi et al. (Y. Zhou et al., Citation2013). Due to high electrochemical performance of NiHCF-GCE, as described in the above, further experiments were carried out by using it as a working electrode for the determination of Cr(VI) in DPV as follows.
Figure 5. Cyclic voltammograms of using electrochemically activated GCE (A) and NiHCF modified GCE at different scan rates (B)
3.6. DPV determination of Cr (VI) using NiHCF modified GCE
Differential pulse voltammetry was performed in order to certify the electro-catalytic role of the modifier from the enhanced current signals of the analytes on NiHCF-GCE in comparison to unmodified GCE. It can be seen from the differential pulse voltammograms shown in that the peak height of 5 µM Cr6+ solution at NiHCF-GCE is higher than unmodified GCE. Therefore to obtain better resolution and analytical sensitivity, DPV was used for the determination of Cr(VI) using modified NiHCF-GCE electrode. DPV method allows for an enhanced analytical signal by eliminating the non-Faradic current and permitting a low limit of detection, high sensitivity, high selectivity better resolution etc. compared to other techniques. The measurement was performed in presence and absence of Cr (VI) at scan rate of 50 mV/s for both bare GCE and NiHCF-GCE. No analytical signal was observed when the measurement was carried out without Cr(VI) in both unmodified GCE and NiHCF modified GCE. But in the case of measurement with 5 µM Cr(VI), the signal was observed in both modified and unmodified electrode. (Wei et al., Citation2007)
Figure 6. DPV of unmodified GCE (b) and NiHCF modified (c) GCE in presence (b and c) and absence (a) of 5 µM Cr(VI) in 0.1 M ABS (pH = 5) at a scan rate of 10 mV/s, pulse amplitude of 240 mV, and pulse period of 100 ms
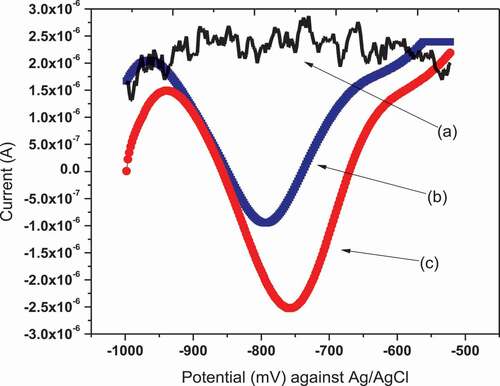
Even though the peak was observed in both GCE and NiHCF-GCE, a well-defined peak takes 37% peak height enhancement over the GCE electrode was also observed when NiHCF-GCE was used, as shown in .The observed peak around −750 mV vs Ag/AgCl in acetate buffer solution, can be attributed to the reduction of Cr(VI) to Cr(III) (Y. Zhou et al., Citation2013).
3.7. Optimization of modified GCEs by DPV
The differential pulse voltammetric conditions such as, scan rate, variation of concentration of Cr(VI), variation of supporting electrolyte and effect of pH are studied to examined the significance of the new sensor electrode.
3.7.1. Effect of concentration on voltammetric responses of the electrode
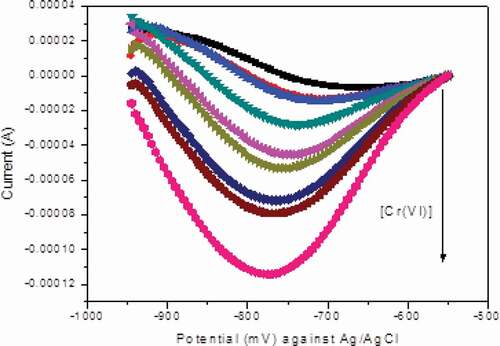
The effect of concentration on the peak values of the differential pulse voltammogram was studied by varying the concentration of Cr (VI) at the same experimental conditions. The experiment was performed by using each prepared solution with NiHCF/GCE modified glassy carbon electrode starting from the lowest concentration. The result is shown in . A progressive increase in the level of peak current is observed with increasing concentration of Cr (VI). Therefore, the observed dependence of peak current on the concentration of Cr(VI) was used to establish calibration curve and analyze real sample.
Figure 7. Effect of Cr(VI) concentration for (0.1 µM, 1µ M, 10 µM, 50 µM, 100 µM, 0.5 mM, 1 mM, and 10 mM) in 0.1 M of pH 5 acetate buffer solution with DPV detection conditions: scan rate of 10 mV/s, pulse period 100 ms, pulse amplitude 100 mV
3.7.2. Effect of pH of the supporting electrolyte
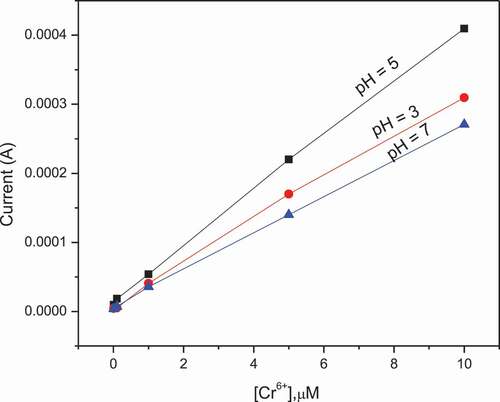
The effect of pH of the supporting electrolyte (buffer solution) on voltammetric response of the developed electrode was successfully studied by varying the pH of the buffer solution. The examined supporting electrolytes were phosphate, acetate, and borate buffer. The concentration of each supporting electrolyte was 0.1 M and prepared by dissolving adequate amount of each solute in distilled water. Then peak currents were recorded using different concentrations of Cr (VI) in each of the supporting electrolyte. After that the DPV measurement was performed for each solution and the strong sharp peak current was observed in acetic acid-sodium acetate buffer solution (0.1 M, pH 5) compared with the phosphate buffer solution (0.1 M, pH 7) and boric acid (sodium) buffer solution (0.1 M, pH 3). The plot of recorded peak current vs concentration of Cr(VI) is shown in . It was found that Cr(VI) gave the highest reduction peak current in 0.1 M acetate buffer, therefore acetate buffer was selected for further studies. As can be seen from the , the three curves display different sensitivities which are related to slope of the curves. Most sensitive detection (the slope at pH 3 is 3.07713E-5, at pH 5 is 3.9929E-5 and at pH 7 is 2.66178E-5) highest slopes at pH 5 were observed. Sensitivity is as the response of curve slope, the maximum peak current was obtained at pH value of 5 and decrease at high pH. The cause is the existence of different form of chromium in water at different pH values. In aqueous solution hydrolysis of Cr2O72- takes place, Cr2O72— + H2O2HCrO4— to from HCrO4−. At low pH, the electrode surface became positively charged due to protonation with H+ and this further promotes the binding of negatively charged HCrO4− ions. In general, more sensitive detection is observed in acid range. (Jg. & Li, Citation2012; Tagesse & Haile, Citation2021)
Figure 8. Illustrations of the effect of pH values of 0.1 M of ABS pH 5, 0.1 M PBS pH 7, and 0.1 M BBS pH 3
3.7.3. Calibration curve and limit of detection
The validation of the current electrode was evaluated by determining hexavalent chromium from tannery river water samples with and without spiking known concentration of standard Cr(VI) and by developing the resulting calibration curve. Series of standard solutions were prepared in 0.1 M ABS at pH 5.0 to develop calibration curve of the method, to determine the Cr(VI) in tannery effluent and river water sample quantitatively and to determine figures of merits of the electrode process. The differential pulse voltammetric peak current for each of serial concentrations (0.01 to 10 µM) were recorded at scan rate of 10 mV/s and pulse amplitude of 240 mV. Then the corresponding plot of peak current against analyte concentration was established.
As can be seen in the plot of peak current vs. concentration, the plot of differential pulse voltammetric peak current versus concentrations of Cr(VI) has been found to be linear in the range of 0.01 to 10 µM with regression equation y = 3.993x10⁻⁵ × + 1.361 × 10⁻⁵ with R2 value of 0.999. From the plot we can see that the regression correlation coefficient of 0.999 shows that peak current is linearly related with concentration of the analyte in the linear dynamic range (0.01 to 10 µM). In order to determine the amount of the hexavalent chromium in tannery wastewater sample, calibration curve was used for the detection of Cr(VI) on the NiHCF-GCE and it was achieved by DPV under optimum conditions. The voltammetric performance and calibration curve for different concentrations of Cr(VI) at scan rate 10 mV/s and pulse amplitude 100 mV with NiHCF-GCE.(Jyothi et al., Citation2013)
3.8. Determination of accuracy and quality control
The validity of the proposed modified electrode for the determination of Cr(VI) using differential pulse voltammetry was proved on quantification of Cr(VI) in the samples, collected from Akaki-Kality sub-city of A.A without spiking these samples and also on spiking these with one known concentration of standard Cr+6 in the real sample. The recovery results of Cr+6 obtained by using DPV technique with present electrode for all spiked and non-spiked samples have been presented in as follows.
Table 1. Accuracy of Cr (VI) detection with the developed sensor evaluated through determination of percent recovery
It can be seen that the percentage of recovered quantity of Cr(VI) 89%, indicating that the method developed is suitable for determination of chromium hexavalent in the tannery effluent and river water sample. These observations from the table showed that the proposed method is suitable for determination of chromium hexavalent using NiHCF modified Glassy Carbon Electrode and its utilization can be exploited for testing of Cr(VI) in the country side area laboratories as well as in tannery industries and small cities, for the welfare of humanity.
3.9. Application NiHCF-GCE for real sample analysis
The application of the developed sensor to real sample was demonstrated through determination Cr (VI) in tannery effluent sample with optimized conditions. The voltammogram indicates that the larger peak is for the sample of tannery effluent which higher concentrated of Cr(VI), the next is at first the disposer mixed to river and the last one is from faraway of the tannery factory. The concentration of the Cr(VI) decrease with the increasing of distances from the factory. This is because of the dissolved Cr(VI) may stays on the valleys of the river and to the soil. (Gardner & Comber, Citation2002)
3.10. Interferences
For the analytical applications of the proposed method, the effect of potential interferences that are likely to be in tannery waste water river samples were evaluated under the optimum experimental conditions. Differential-pulse voltammetric experiments were carried out for 10 µM Cr(VI) in the presence of 10 µM of each of the interferents. Copper is selected as potential coexisting major ion in tannery effluent and its effect of DPV response of the NiHCF modified GCE for Cr(VI) was tested. The DPV peak of Cu(II) in presence of Acetic acid buffer medium was noticed around −0.55 V, which is well-separated from that of Cr(VI) which is observed between −700 and −800 mV. It has been showed that copper did not interfere with the voltammetric signal of Cr(VI). Therefore, the proposed method can be used as a selective method.
4. Conclusions and recommendation
4.1. Conclusions
A simple and low cost electrode based on NiHCF modified glassy carbon electrodes have been successfully applied for sensitive and selective detection of hexavalent chromium in environmental and effluent samples. A simple surface pretreatment by involving just mechanical polishing showed a dramatic improvement in the thermodynamic reversibility and charge transfer kinetics of GCEs. Drop casting of NiHCF precipitate on the surface of the GCE showed effective electro-catalytic effect on the differential pulse voltammetric determination of Cr(VI). The NiHCF modified electrode exhibited improved sensitivity and selectivity for the detection of Cr(VI) real samples in a acetate buffer solution at pH 5. Increasing in the electroactive area of the electrode after modification with NiHCF could be recorded in comparison with the unmodified one. The developed electrode could discriminate Cr(VI) from other potentially interfering species including copper (II) and display well separated and discerned peaks for the potential interference (Copper) with a selectivity coefficient of 1.6. The electrode was successfully applied for the detection of very low level of Cr+6 in tannery and surrounding samples in an acetate buffer solution at pH 5. In conclusion, the proposed electrode can be easily used in determination of hexavalent chromium and speciation of chromium in environmental sample with good precision and stable responses as well as excellent recovery.
4.2. Recommendations
In this study it was examined that the amount of Cr(VI) discharging to the waste water was high as compared to its permissible level. This easiest, cheap reliable but effective sensitive and selective modification method must not decide only at laboratory but it develop to be fabricate industrial level for regulation of the consumption of chromium in tannery and other resemblance industries.
PUBLIC INTEREST STATEMENT
In Ethiopia, the wastewater generated from tanning and steel industries is often directly discharged to the river due to ignorance and lack of monitoring policy implementation. Hexavalent chromium is one of the most common wastes removed from those industries. These results in an alarming rise in concentrations of toxic pollutants effects on humans, animals, and the water body. There is an urgent need to safeguard the ecology and wellbeing of society. Electrochemical methods have been recognized as one of the most attractive routes for trace Cr analysis, benefiting from its advantages of very low limit of detection, simplicity, high sensitivity and selectivity, and potential application for onsite monitoring. Hence this research is focused on the pollutant determination capacities of differential pulse voltammetric determination of hexavalent chromium using electro-catalytically modified glassy carbon electrode in environmental samples.
Credit author statement
All of the authors collaborated on this project. The study was designated by authors WT and AP, who also handled the literature searches and generated the initial draft, as well as the extensive available literature and revisions that resulted in the final draft. Author WC created the protocol and analyzed the data, managed and searched the literature, produced the first draft, and anchored the laboratory investigation, acquired the initial data, and performed preliminary data analysis based on the findings available literature.
Acknowledgments
The authors are very thankful to office of the vice president for research and technology transfer of Dilla University (DU) for financial support for postgraduate fellowship program.
Disclosure statement
No potential conflict of interest was reported by the author(s).
Additional information
Funding
Notes on contributors

Wendimagegn T. Dinbore
Wendimagegn T. Dinbore is currently a staff member of Chemistry Department and University-industry linkage coordinator at Dilla University, Ethiopia. His specialization is in Chemistry (Physical Chemistry). He worked on material synthesis, surface chemistry, environmental analysis, and the wastewater management and control mechanism. Mr. Dinbore has been working research on the application of the current technologies for the determination, prevention, and remediation of environmental pollution where the focus areas are surface chemistry and waste/wastewater treatment technology. Part of his research results have been published in international journal, Journal of Cogent Food & Agriculture, Environmental Analysis Health and Technology and Oriental journal of chemistry. https://doi.org/10.1080/23311932.2020.1816420, https://doi.org/10.5620/eaht.2021007 and http://dx.doi.org/10.13005/ojc/370217 respectively. The experience of the applicant is ranging from materials synthesis and environmental analysis combine preventive and remediation technology. So the manuscript submitted for publication is one of the projects among the research activities in our lab group.
References
- Apte, A. D., Verma, S., Tare, V., & Bose, P. (2005). Oxidation of Cr(III)in tannery sludge to Cr(VI): Field observations and theoretical assessment. Journal of Hazardous Materials, 121(1–3), 215–11. https://doi.org/https://doi.org/10.1016/j.jhazmat.2005.02.010
- Bini, C., Maleci, L., & Romanin, A. (2008). The chromium issue in soils of the leather tannery district in Italy. Journal ofGeochemical Exploration, 96(2–3), 194–202. https://doi.org/http://doi.org/10.1016/j.gexplo.2007.03.008
- Bishop, J. E., Smith, J. A., & David, G. (2020). Lidzey* ACS applied materials & interfaces. Development of Spray-Coated Perovskite Solar Cells, 12(44), 49607–49616. https://doi.org/https://doi.org/10.1021/acsami.0c14540
- Chuanchuan, L., Siyun, Q., Zhu, L., Zhao, Y., Huang, R., He, Y., Ge, W., Liu, X., Zhao, M., Xu, L., & Qian, Y. (2021). Regulating polysulfide intermediates by ultrathin Co-Bi nanosheet electrocatalyst in lithium−sulfur batteries. Nano Today, 40(2021), 101246. https://doi.org/https://doi.org/10.1016/j.nantod.2021.101246
- Fu, S. K., & Su, X. (2010). Size dependent active effect of CdTe quantum dots on pyrogallol-H2O2chemiluminescence system for chromium (III) detection. Microchim.Acta, 169(1–2), 167–172. https://doi.org/https://doi.org/10.1007/s00604-010-0334-0
- Gardner, M., & Comber, S. (2002). Determination of trace concentrations of hexavalent chromium. Analyst, 127(1), 153–156. https://doi.org/https://doi.org/10.1039/b109374f
- Homa, D., Haile, E., & Washe, A. P. (2016). Determination of spatial chromium contamination of the environment around industrial zones. International Journal of Analytical Chemistry, 2016, 1–7. https://doi.org/https://doi.org/10.1155/2016/7214932
- Jg., W., & Li, X. (2012). Electrochemical treatment of wastewater containing chlorophenols using boron-doped diamond film electrodes. J. Cent. South Univ, 19(7), 1946–1952. https://doi.org/https://doi.org/10.1007/s11771-012-1230-z
- Jin, W., Wu, G., & Chen, A. (2014). Sensitive and selective electrochemical detection of chromium(vi) based on gold nanoparticle-decorated titania nanotube arrays. Analyst, 139(1), 235–241. https://doi.org/https://doi.org/10.1039/C3AN01614E
- Jyothi, N. R., Farook, N. A. M., Cho, M., & Shim, J. (2013). Analysis and speciation of chromium in environmental matrices by various analytical techniques. Asian Journal of Chemistry, 25(8), 4125–4136. https://doi.org/http://dx.doi.org/10.14233/ajchem.2013.14625
- Khalilzadeh, M. A., Tajik, S., Beitollahi, H., & Venditti, R. A. (2020). Green synthesis of magnetic nanocomposite with iron oxide deposited on cellulose nanocrystals with copper (Fe3O4@CNC/Cu): Investigation of catalytic activity for the development of a venlafaxine electrochemical sensor. Industrial & Engineering Chemistry Research, 59(10), 4219–4228. https://doi.org/https://doi.org/10.1021/acs.iecr.9b06214
- Liu, B., Tan, H., & Chen, Y. (2013). Up conversion nanoparticle-based fluorescence resonance energy transfer assay for Cr(III) ions in urine. Anal.Chim.Acta, 761, 178–185. https://doi.org/https://doi.org/10.1016/j.aca.2012.11.035
- MansouriMajd, S., Teymourian, H., Salimi, A., & Hallaj, R. (2013). Fabrication of electrochemical theophylline sensor based on manganese oxide nanoparticles/ionic liquid/chitosan nanocomposite modified glassy carbon electrode. Electrochimica Acta, 108, 707–716. https://doi.org/http://doi.org/10.1016/j.electacta.2013.07.029
- Mulushewa, Z., Wendimagegn, T., & Yihunie, A. (2021). Removal of methylene blue from textile waste water using kaolin and zeolite-x synthesized from Ethiopian kaolin. Environmental Analysis Health and Toxicology, 32(1), e202100. https://doi.org/https://doi.org/10.5620/eaht.2021007
- Μolla, A., Ioannou, Z., Mollas, S., Skoufogianni, E., & Dimirkou, A. (2017). Removal of chromium from soils cultivated with maize (Zea Mays) after the addition of natural minerals as soil amendments. Bulletin of Environmental Contamination Toxicology, 98(3), 347–352. https://doi.org/https://doi.org/10.1007/s00128-017-2044-3
- N. Rai, K., & Rai, A. K. (2008). LIBS-An efficient approach for the determination of Cr in industrial wastewater. Journal of Hazardous Material, 150(3), 835–838. https://doi.org/https://doi.org/10.1016/j.jhazmat.2007.10.044
- Orooji, Y., Asrami, P. N., Beitollahi, H., Tajik, S., Alizadeh, M., Salmanpour, S., Baghayeri, M., Rouhi, J., Sanati, A. L., & Karimi, F. (2021). An electrochemical strategy for toxic ractopamine sensing in pork samples; twofold amplified nano-based structure analytical tool. Journal of Food Measurement and Characterization. https://doi.org/https://doi.org/10.1007/s11694-021-00982-y
- Posta, J., Alimonti, A., Petrucci, F., & Caroli, S. (1996). separation and preconcentration of chromium species in seawater. Anal.Chim.Acta, 325(3), 185–193. https://doi.org/https://doi.org/10.1016/0003-2670(96)00030-X
- Shrivastava, R., Upreti, R. K., Seth, P. K., & Chaturvedi, U. C. (2002). Effects of chromium on the immune system. FEMS Immunology and Medical Microbiology, 34(1), 1–7. https://doi.org/https://doi.org/10.1111/j.1574-695X.2002.tb00596.x
- Sohail, B. M., Xubao, J., Shusheng, L., & Zheng, K. X. (2019). Highly uniform and porous polyurea microspheres: clean and easy preparation by interface polymerization, palladium incorporation, and high catalytic performance for dye degradation. Frontiers in Chemistry, 7, 314. https://doi.org/https://doi.org/10.3389/fchem.2019.00314
- Stasicka, Z., & Kota´, S. (2000). Chromium occurrence in the environment and methods of its speciation. Environmental Pollution, vol, 107(3), 263–283. https://doi.org/https://doi.org/10.4236/jep.2011.210155
- Stepniewska, Z., Bucior, K., & Bennicelli, R. P. (2004). The effects ofMnO2 on adsorption and oxidation of Cr(III) by soils. Geoderma, vol, 122(2–4), 291–296. https://doi.org/http://doi.org/10.1016/j.geoderma.2004.01.015
- Tagesse, W., & Haile, B. (2021). Adsorptive removal of chromium (VI) using silver nanoparticles synthesized via green approach with the extract of moringa stenopetala. Orient J Chem, 37(2), 380–387. https://doi.org/http://doi.org/10.13005/ojc/370217
- Tajik, S., Beitollahi, H., Nejad, F. G., Zahra Dourandish, M. A., Khalilzadeh, H. W. J., Venditti, R. A., Varma, R. S., & Shokouhimehr, M. (2021). Recent developments in polymer nanocomposite-based electrochemical sensors for detecting environmental pollutants. Industrial & Engineering Chemistry Research, 60(3), 1112–1136. https://doi.org/https://doi.org/10.1021/acs.iecr.0c04952
- Tajik, S., Orooji, Y., Ghazanfari, Z., Karimi, F., Beitollahi, H., Varma, R. S., Jang, H. W., & Shokouhimehr, M. (2021b). Nanomaterials modified electrodes for electrochemical detection of Sudan I in food. Journal of Food Measurement and Characterization, 15(4), 3837–3852. https://doi.org/https://doi.org/10.1007/s11694-021-00955-1
- Tajik, S., Orooji, Y., Karimi, F., Ghazanfari, Z., Beitollahi, H., Shokouhimehr, Varma, M., R. S., & Jang, H. W. (2021). High performance of screen-printed graphite electrode modified with Ni–Mo-MOF for voltammetric determination of amaranth. Journal of Food Measurement and Characterization. https://doi.org/https://doi.org/10.1007/s11694-021-01027-0
- Washe, P. A., Lozano-Sánchez, P., Bejarano-Nosas, D., & Katakis, I. (2013). Facile and versatile approaches to enhancing electrochemical performance of screen printed electrodes. Electrochimica Acta, 91, 166–172. https://doi.org/https://doi.org/10.1016/j.electacta.2012.12.110
- Wei, H., Sun, J.-J., Xie, Y., Lin, C.-G., Wang, Y.-M., Yin, W.-H., & Chen, G.-N. (2007). Enhanced electrochemical performance at screen-printed carbon electrodes by a new pretreating procedure. Analytica Chimica Acta, 588(2), 297–303. https://doi.org/https://doi.org/10.1016/j.aca.2007.02.006
- Zhang, N., Suleiman, J., He., S., & Hu, B. (2008). Chromium(III)-imprinted silica gel for speciation analysis of chromium in environmental water samples with ICP-MS detection. Talanta, 75(2), 536–543. https://doi.org/https://doi.org/10.1016/j.talanta.2007.11.059
- Zhao, L., Jin, Y., Yan, Z., Liu, Y., & Zhu, H. (2012). Novel, highly selective detection of Cr(III) in aqueous solution based on a gold nanoparticles colorimetric assay and its application for determining Cr(VI). Anal.Chim.Acta, 731, 75–81. https://doi.org/https://doi.org/10.1016/j.aca.2012.04.022
- Zhou, S. G., Zhou, L. X., Wang, S. M., & Fang, D. (2006). Removal of Cr from tannery sludge by bioleaching method. Journal of Environmental Sciences (China), 18(5), 885–890. https://doi.org/http://doi.org/10.1016/s1001-0742/06/60009-0
- Zhou, Y., Li, Y. S., Meng, X. Y., Zhang, Y. Y., Yang, L., Li, Z. H., Zhang, J. H., Wang, X. R., Liu, J. Q., Lu, S. Y., Ren, H. L., Hu, P., & Liu Z. S. (2013). Production of a monoclonal antibody and development of an immunoassay for detection of Cr(III) in water samples. Chemosphere, 93(10), 2467–2472. https://doi.org/https://doi.org/10.1016/j.chemosphere.2013.08.088