 ?Mathematical formulae have been encoded as MathML and are displayed in this HTML version using MathJax in order to improve their display. Uncheck the box to turn MathJax off. This feature requires Javascript. Click on a formula to zoom.
ABSTRACT
The phenomenon of urban growth is a complicated one. It is the outcome of numerous social, economic, ecological, cultural, and even political circumstances. Rapid urbanization generally occurs due to the disbursement of peripheral prime agricultural land, destroying the natural landscape in the process. Rohtak city is a fast-growing city in India’s National Capital Region (NCR). The physical development of the city and land use/land covers are measured using Landsat satellite data. ArcGIS and Erdas software have been used for making the map, image processing and classification. In this study, five major land use and cover categories, built-up area, agricultural land, vegetation, bare/open land and water bodies, are used. The spatial arrangement and urban growth trends in Rohtak are examined using Shannon’s Entropy index. Results show that Rohtak city has witnessed four-fold growth in its built-up area (from 1640.79 hectares in 1991 to 6686.36 hectares in 2021) in thirty years of the study. However, the planned and unplanned residential and commercial arrangements have appeared on all sides throughout the periods. Yet, the city expanded its limits mainly in north, north-eastern and south-eastern sides along with the major transport routes to New Delhi, Sonipat and Panipat. It is primarily a result of government policies and proximity to the capital city.
Introduction
Throughout the evolution of civilization, human society has been significantly shaped by urban places or cities. These areas have remained the locations of the major socio-economic, cultural and diplomatic alterations. For some past decades, the whole world has witnessed an extraordinary scale and rate of urbanization. Recently, cities have been recognised as the habitats of about half of the world’s populace. However, the complex structure of the cities and their interactions with the citizens is very difficult to understand because of several urban phenomena that keep on changing with the constant interaction with each other or discretely. These vibrant parameters design for the prospected growth of the urban centres and control the routine of urbane (Batty, Citation2005). Although the urban centres exist over a small proportion of the earth, yet their escalating and unprovoked growth warns for an outsized alteration in natural scenery with severe and irreparable damages to the humans as well as the environment also (Berling-Wolff & Wu, Citation2004; Mundia & Murayama, Citation2010; Pickett et al., Citation2001; Sharma & Kumar, Citation2017). The rapid population growth and inflexible nature of the existing landscape are some crucial aspects that lead to the rapid growth of the urban centres. Often, to cope with the increasing demands of residents for superior facilities, the express urbanization meets with a chaotic evolution of the cities. It also shortens and distorts the available urban services. The world’s urban population has increased four times (0.8 billion to 4.2 billion) from 1950 to 2018. If the projections of population growth are accurate, then 6.7 billion out of total 9.8 billion inhabitants of the earth will be existing in towns and cities by 2050 (United Nations, Citation2019). Several factors related to development and demography, as well as the conversion of rural settlements into urban due to physical expansions of the urban boundaries, will work as the fuel for this extensive growth of urban population throughout the world
Usually, an area’s land use/land cover is determined by the extent and speed of urbanization. It results from extensive industrial development and economic activities that force a city to absorb the population that reaches there in search of employment and other urban facilities. This process of accumulation diversifies the economy and encroachment to the periphery. It further pressurizes the region for intensive farming over the offered agricultural lands to fulfil the food demands of the people. The evaluation of precedent cities progression plays a significant role in policy formulation and assessing expected urbanization trends. It assists in sustainable development and offers a spacious platform to understand man–environment relationship in a natural and socio-cultural atmosphere. The fast-growing urban population imbalances inland, foodstuff, water, shelter, and resource allocation. These social and economic parameters and diverse ecological, political and long-term demographic positions direct and control the land utilization of a region. The constant changes in different land utilization categories to pace with the urban demands not only impact sustainability but also bring disastrous loss for the physical landscape, biodiversity, and the reservoirs throughout the planet.
Measurements of urban growth have been progressively proposed to understand the growth and proper handling of the problem. The detection and measurements of spatial changes at regular intervals help in shaping the urban centres in an organized way by assisting the planners in formulating and executing the urban growth models. In developing countries like India, urban land use has increased through urbanization, whereas rural land use has witnessed a decrease in the area. The implementation of new economic reforms of the 1990s has also accelerated the pace of Indian urbanization by offering more scopes of investment for global investors. Rohtak, an important city of Haryana, is a suitable selection for the present study as it has been experiencing outstanding growth in development and urbanization for the last three decades. The research starts with some appraisal of the available literature related to urbanization, shaping urban growth and land utilization, and its consequences for neighbouring environs. The hope for a new-fangled expansion of the city also offers enough space to study the patterns and trends of urban growth in Rohtak city.
Study area
Rohtak city is one of the most progressive cities of Haryana, having its location in the core of the state (figure ). It is recognized as an educational city due to various learning institutes and other influential art and management research centres. The city has proximity (approximate 66 kms far) to the nation’s capital, Delhi and one of the important cities of the National Capital Region (NCR). Apart from the state initiatives, the city benefits from the regional development plans run by the National Capital Region Planning Board for balanced and sustainable progress. Such a proposal of 2021 offers an opportunity to the contiguous cities like Rohtak to make the strategy for residential, commercial, and industrial investment according to its resource’s potential and provisions. This approach has helped the city’s emergence as the hub of manufacturing and service activities and a destination for the job seekers from adjoining villages, smaller towns, and other states.
Figure 1. Location map of study area.
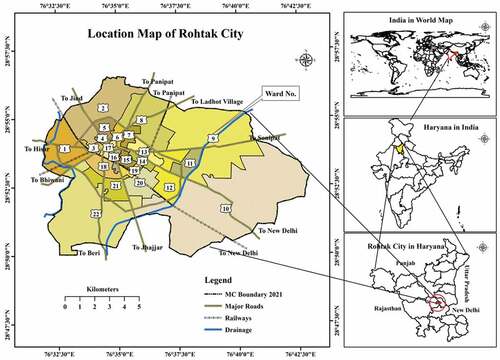
This massive migration of the population from nearby or afar for various interests has shortened the existing public facilities of the city. The land’s demand for the expanding boundaries has resulted in the alterations of land operations and the region’s biodiversity.
Objectives
To check the patterns and trends of urban growth and generated land/land cover changes.
To present a relative analysis of population growth and built-up area statistics.
To identify the determinants or factors operating behind the urban growth.
Materials and procedures
The study depends on spatial and non-spatial data composed of diverse sources and different periods. Landsat satellite data dated March 5, 1991, March 8, 2001, April 5, 2011 and June 3, 2021 is used to measure the physical enlargement and reshaping of the city’s natural zoning and land management (Table ). The purpose of using temporal satellite data is to identify the direction and natural growth in Rohtak city. The supervised classification and maximum likelihood method generate the land arrangements maps for 1991, 2001, 2011 and 2021. The doubtful areas are reclassified and corrected using the recode option in ERDAS, ancillary information, and other historical shreds of evidence. The five classes, (1) built-up area, (2) bare/open land, (3) agricultural land, (4) water bodies and (5) vegetations, are taken to represent the land use and cover of the city (Table ). The Erdas and ArcGIS software is put into practice to complete image processing and classification, and generation of maps.
Table 1. Information about satellite data
Table 2. Classification of land use/ land cover
The below approach was used to determine the population growth rate and the built-up area:
The predicted /estimated population of the required time has been intended with the help of the following method (Swanson & Siegel, Citation2004)..
Where;
P = Population of the selected period;
Pb = Population of the base year;
R = Growth rate;
n = time in year in numbers (e.g. 1, 2, 3, …, n).
The entropy index, proposed by Claude Shannon in 1948 (commonly recited as Shannon’s Entropy Index), is calculated to identify the form and pattern of urban growth using the data from different wards. The ward-wise map received from the Rohtak city Municipal Office is taken as the base map for evaluating the urban growth trends from 1991 to 2021. The Entropy (Hn) indicates whether a geographical variable (xi) clusters or diffuses geographically among n zones (Theil, Citation1967; Thomas, Citation1981). It is expressed as:
Where pi, stands for the amount of a variable taking place in the ith ward/zone
xi refers to the observed value of the phenomenon in the ith zone
n represents the total number of wards.
log n specifies the maximum entropy value (upper limit), i.e., equal to log 22 = 1.342
In the entropy model, the value lies in the middle of 0 and log n. The value nearer to zero indicates homogeneous urban growth, whereas the distant value from zero or closer to log n shows the fragmented distribution with heterogeneous land uses over the discrete spatial unit. The changing values of entropy assist in identifying the dispersion and compactness of urban growth. The degree of change in urban sprawl may be determined by comparing entropy values between two time periods (t1 and t2).
The relative entropy (H’n) rearranges the entropy values from 0 to 1 (Yeh & Li, Citation2001). It is (Thomas, Citation1981) computed as.
The threshold worth for relative entropy (H’n) is 0.67, which is the halfway mark for the maximum value of 1. Therefore, a city with a relative entropy value beyond 0.67 is measured sprawl.
Results
Physical and demographic statistics of Rohtak city
There is no doubt that intensive and speedy urbanization illustrates land use/land cover change that can’t stop but can be managed. It is the most important root of many environmental, social and ecological nuisances in and outer parts of the cities. Understanding the urbanization process is an important task for the city’s sustainable growth and scheduling and management to alleviate the unpleasant impacts of such expansion. The Rohtak city has experienced a significant increase in its population from 1901 to 2011. In 1901, the population was 20,323 persons, reaching 25,240 persons in 1921 and 48,148 persons in 1941. During this span, the municipality and civil lines functioned as the city’s administration in Rohtak town. Afterward, it was reformed as Municipal Committee from 1951 to 1991, Municipal Council in 2001, and Municipal Corporation in 2011 to date.
The population data has also got triple-fold from 1951 to 1991 and was calculated as 216,096 persons with an addition of 144,194 persons in the records of 1951. In census 2001, the registered figure of the population for the city was 294,577 people. It increased 79,715 persons in the next census and was documented as 374,292 and 488,842 persons in 2011 and 2021 one-to-one. This addition is credited to the natural growth, migration from surrounding rural parts, and inclusion of eight peripheral villages in the city’s administrative boundary. The city’s municipal area has also increased from 1961 to 2011 due to the physical expansion of its boundaries.
During the census of 1961, the city’s municipal area was 1166 hectares, which reached 2838 hectares in 1991 with an addition of 1672 hectares. After gaining the status of Municipal Corporation on 17 March 2010 wide Notification No. 18/6/2010-3C1, the city extended its boundaries and recorded as 10,247 and 13,914 hectares in 2011 and 2021, respectively. All this boosted the urban expansion along with the addition of adjoining countrified parts, and presently the city is one of the fast-growing cities of the Haryana state (Table ).
Table 3. Growths in population and municipal area of Rohtak City, 1901–2021
Analysis of artificial and natural land utilizations
The heading stands for assessment of the land use and land cover of the study area that has witnessed a significant change. In 1991, the agricultural land (68.84%) was dominating category among all, followed by the built-up area (11.79%), open or bare land (10.25%), vegetation cover (6.91%) and water bodies (2.21%). In 2001, the farming land was reduced by 636.21 hectares, but still, it constituted the most significant proportion (64.27%) of all land practices. The developed land and water bodies have increased by 7.23% and 1.43% whereas the vegetative land lost (3.23%) almost half of its area for the same year ().
Table 4. Land use and land cover in Rohtak City
Table 5. Land use/land cover change statistics in Rohtak city from 1991 to 2021
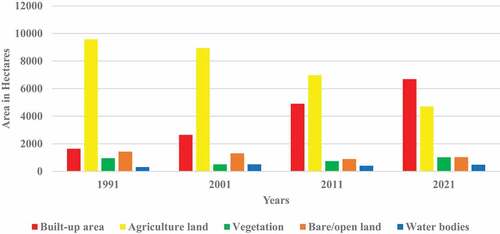
Some settlements have appeared across the canal, while the forest area, in the southwest, is also reduced. As compared to the previous, in the next census of 2011, except for the increase of 16.2% and 1.67% in built-up and vegetation areas, respectively, all categories experienced a significant decline in their actual and proportionate area. In 2021, the fast urban growth augmented to the built-up land, and in the thirty years, the first time, it became the prime category (48.05%) with an area coverage of 6686.36 hectares. The cultivable land has to pay the cost of urban expansion by losing more than half (35.03%) of its part from 1991 to 2021. Though, in this period, the addition of 57.69 and 170.16 hectares in forest and water bodies’ classes, respectively, is good for the health viewpoint of dwellers and the city (Table ). The graphical representation clearly shows the quantitative change in different land categories during the studied period (figure ).
Figure 2. Quantitative changes in land use/land cover of Rohtak City 1991–2021.
The land use/land cover prototype clearly shows that the city has grown with an express speed that has altered all ongoing land operations. During this phase (1991–2021), along with the congestion in the city’s core due to infill growth, the city has expanded in adjoining suburban and rural areas through the edge and outlying expansion, respectively. In 1991, the urbanized area was observed in the west of the canal almost compactly. Here, the Jawaharlal Nehru Canal (JLN) has restricted its expansion in the east. In 2001, the growth shifted towards the eastern part that became denser in 2011 and 2021 with the rejections of natural or artificial confines. In 1991, the vegetation area appeared near the canal that has reduced in the following images. A big patch of forest cover at the western margin has entirely disappeared by 2021 (figure )
Figure 3. Land use/land cover mapping for Rohtak city.
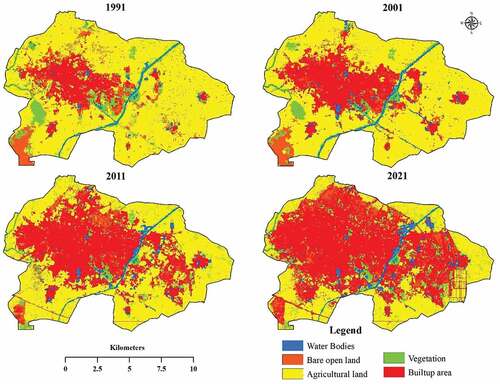
Table and figure show the loss and gain of the area under various land operations. The observations reveal that, except for the agricultural land, all land-use groupings have met positive changes (in absolute and percentage) in the previous 30 years. Between 1991 and 2001, agriculture, vegetation, and bare lands have also experienced to decline of 4.57%, 3.23%, and 0.87% one-to-one. In the next decade (2001–2011), the built-up area has observed a substantial increase of 16.2% and 2253.24 hectares in absolute area.
Figure 4. Gain and loss of area from 1991 to 2021.
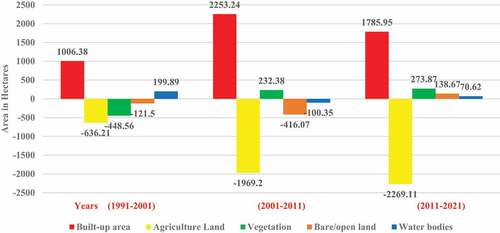
Due to the additional merging of space, the vegetative land has also received the positive change (1.67%), but agriculture (−14.15%), open space (−2.99%), and water bodies (−0.72%) have still got the reduction in their areas in the same decade (figure ). From 2011 to 2021, the declining land categories (vegetation cover, open/bare lands, and water bodies) have regained their areas in any way, but farming space has squeezed more and more. Built-up Area and Population Growth
Table establishes the relation between population growths and sprawl in terms of built-up area for around 30 years of 1991 to 2021. In 1991, the city’s built-up area was extended to 1640.79 hectares, which have reached up to 2647.17 hectares in 2001 with a growth rate of 61.34%. In contrast, the increasing pace of population was 36.32% during the same time with an addition of 78,481 persons in total population. The maximum increase was observed in built-up areas from 2001 to 2011 when the city expanded its limits rapidly, and the built-up area has been considered as 4900.41 hectares, and escalation speed was 85.12%. After 2011, the growth rate of built-up area and population has declined, and it recorded 36.44% and 27.06% respectively.
Table 6. Growth rates of population and sprawl in Rohtak city
The built-up area for the year 2021 is 6686.36 hectares, quadruple more than 1991. The populace has also augmented to 488,842 in 2021, which was 374,292 in 2011 with a growth rate of 27.06%. The sizable increase in developed areas of the city between 2001 and 2011 can be attributed to political interest and the tag of CM city. The administration provided all required facilities to the area, which helped it in planned development and edges or peripheral regions. The predicted estimations explain if the growth rate of built-up area and population will remain the same, then the city will encounter 9564.27 and 13,680.89 hectares built-up area to accommodate the 638,455 and 833,858 persons by 2031 and 2041, respectively. This immense intensification in physical and demographical aspects directs the city’s administration to focus on vertical growth rather than horizontal.
Spatial expansion of Rohtak city and Shannon’s entropy index
Spatial expansion means the geographical extension of a city beyond the boundaries. It is a unidimensional procedure where the urban settlements are appraised as the magnet owing to their specific and diversified socio-economic structures. In the case of Rohtak city, the landscape has observed speedy growth as a result of natural as well as migration-induced growth in the population, the convenience of educational institutions, availability of employment opportunities, and other improved public facilities in its vicinity. This increase in the number of people compelled the city’s administration to lengthen the boundary for sustainable management.
Figure 5. Spatial expansion of Rohtak city (1991–2021).
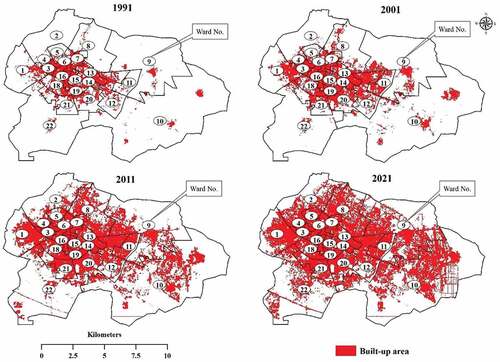
The planned and unplanned residential and commercial arrangements have appeared everywhere throughout the periods, yet the city expanded its limits mainly towards the north and east by crossing the drainage. Various new wards and unclassified settlements have appeared in 2011 and 2021 ().
Shannon’s entropy is exercised to quantify the patterns of urban sprawl. The geophysical variable used in this study is a ward-wise impervious area, which allows for urban sprawl assessment. Table represents the calculated Shannon’s Entropy index for Rohtak city for the different years (1991, 2001, 2011, and 2021) with the help of built-up area. The entropy value varies from 0 to log (n). The closeness of entropy values to log n’ indicates a dispersed pattern with sprawl, which implies urban growth and diversified land uses, whereas values closer to 0 show a compact distribution. In the current situation, log (n) is 1.342, which refers to the entropy index’s upper limit. The lowest entropy value (1.191) for 1991 reveals the dense distribution of developed areas. For the next, 2001, 2011, and 2021 years, the values have been observed as 1.247, 1.301, and 1.321 with an addition of 0.056, 0.053, and 0.021 points, respectively (Table ).
Table 7. Change in Shannon’s entropy values of Rohtak city
Discussions
Generally, urban growth is a process that represents land demand induced by economic growth, natural population growth, and migration. The expanding border of a city engrosses the modifications in any region’s material and functional mechanism and speeds up the conversion of countryside to urban forms (Dahal et al., Citation2016; Sharma & Kumar, Citation2019). Among the several aspects, the population explosion and poverty-induced migration from rural to urban are mainly responsible factors for the fast and chaotic urban expansion worldwide (Bhat et al., Citation2017). It becomes challenging for the urban authorities to manage the demands of urbane for essential services, and such accidental urbanization leads to diffusion of the growth at outer reaches. Here, agricultural land is seen as an accessible resource to furnish the land demand of urban growth for various uses. Such encroachment on farming land threatens the region’s food security.
The experience of Rohtak city regarding urban growth is somehow similar to any growing city. The city has witnessed remarkable alterations in all land use categories throughout the period (). The built-up structures have augmented more while agricultural land directly paid the cost of this growth. In the earlier study phase, the urbanized area was compact, mainly in the western part. In the east, the existence of the Jawaharlal Nehru Canal (JLN) has restricted the city’s growth by 2001. In the further decades, because of the improved transport links and the ease of commuting from Rohtak to Delhi, the expansion is more concentrated in the north-eastern direction, along Delhi Road, than in the other directions.
The growth in eastern parts has been supported by the Delhi and Sonipat transport route, industrial model township (IMT), creation of amusement site (Tilyar Lake) and establishment of various academic and other organizations. Whereas, in the south-east, the new emergence of multi-functional points due to having the proximity benefit of leading medical centre, Post Graduate Institute of Medical Sciences PGIMS (named after the first chief minister of Haryana, Pandit Bhagwat Dayal Sharma) and the planned residential opening have stayed behind the growth. In the west, the founding of small-scale manufacturing units has offered the scope for developing the residences in the surroundings, yet the progress is restricted by Drain No-8 on this side (figure ). The merging of neighbouring villages, namely Kutana, Sunaria, Garhi Bohar, Bohar, Kheri Sadh, Kanheli, Pahrawar and Singhpura, has also been a major cause behind the massive presence of developed and dispersed areas in the city in recent years. It led to maximum accidental expansion in the form of illegal colonies or formal settlements generally originated along with transport network, planned residential and commercial development by Haryana Urban Development Authority (HUDA) and other private builders. Some construction is certified by the administration in a planned and sustainable manner (figure ). Many pulling factors like the establishment of state and national level educational and medical institutions (Maharshi Dayanand University, Baba Mast Nath University, State Hotel and Management Institute, All India Jat Heroes Memorial College, Gaur Brahman Educational institutes, Vaish and Saini Educational Institutes) and other important centres (State Institute of Film and Television, State University of Performing and Visual Arts) have also played a significant role in spreading the city outside to its margin. The new industrial set-up (Asian Paints industry, Sabar Dairy, High-tech Plastic limited, Footwear Design and Development Institute, Hindustan Herbal Limited, Amar Ujala Publication Limited, Enrich Agro Food Production, Advices North India Private Limited Company) in Industrial Model Township has also amplified the growth.
While discussing the Shannon entropy (as a measure of urban sprawl and degree of spatial urban growth), it is found that the values are closer to log n’ (1.342) that points to the dispersed or fragmented development of the built-up area in the city. It is found that in 1991 core part (wards 3, 6, 13, 14, 15, 16, and 19) of the city was compact that became denser for the successive studied periods, mainly in 2011 and 2021, with the inclusion of more wards. The sprawl has started slowly in 2001 and reached a peak in 2021. The highest dispersion is traced in 2021 as the entropy value is highest for this period as compared to other three periods. During this period, along with the centre part (wards 4, 5, 6, 16, and 18), the developed area has further condensed in the periphery (wards 1, 8, 9, 10, 11, 20, and 21) also (figure ). The trend indicates that the bare/open space within the city is continuously disappearing by infill growth. Getting closer to the city’s outskirts, the edge and outlying development have appeared all-round, especially in the north and east of the city. This fact clears that the city’s neighbourhood is contributing more to the fragmented growth and is a symbol of urban sprawl.
Conclusion
The urban growth compels to walk on two blades sword through affirmative and unconstructive impacts for the concerned structure worldwide. Rohtak city, also regarded as Haryana’s educational hub and important city of the National Capital Region, faces the inevitable consequences of urban growth. The built-up area’s spatial pattern changes from centre to the periphery, with more alterations visible in the south-eastern direction. This is also attributed to Delhi’s territorial expansion and the implementation of the Delhi NCR plan, which encompasses the Rohtak region. The city has witnessed fourfold growth in its built-up area for thirty years, and significant expansion has traced in north, north-east, and south-east, as per different growth patterns. The steady growth in contiguous development around the central part and considerable progress in the circumference are observed in the analysis. This intensification has ensued in substantial modifications in land use and the land cover of the city. The agricultural land has made the highest adjustment negatively, and it lost 4874.52 hectares of its productive area by the end of the studied period.
Moreover, the bare/open land has also missed its significant area of 398.9 hectares from 1991 to 2021. The calculated entropy value for the city’s built-up area, which was 1.191 in 1991, and reached 1.321 in 2021, demonstrates that development is considerably scattered. The unsystematic and impulsive expansion has resulted in the abbreviation of the available urban infrastructure and forces the city to compromise with its qualitative aspects and augments to the emergence of slums and illegal structures, increase in crime incidences, jamming in peak hours, pollution, etc. Such negotiations threaten the sustainability, environmental and social cohesion of any urban area. Major changes are more noticeable on the outskirts than in the centre. The city’s horizontal growth is far faster than its population growth, so the government should watch its extension to ensure good land management in a specific category. The study suggests that mass employment would be feasible with the generated economic momentum in Rohtak city, meeting the migrators’ needs from the periphery and relieving the burden of the capital city, New Delhi. Overall, the city has advanced a lot, yet its potential as a part of the national capital region (NCR) is remained to tap completely. So, the administration should adopt painstaking measures to achieve the enduring that is wished to be environmentally safe and excellent regarding urban services.
Acknowledgments
The authors express their gratitude to the United States Geological Survey (USGS) for free access to Landsat satellite images for the different periods. A warm thanks also go to the editor and the anonymous referees of the journal for their valuable remarks and suggestions for better drafting the manuscript.
Disclosure statement
No potential conflict of interest was reported by the author(s).
Data Availability Statement
The study is based on open-source satellite data (Landsat satellite data), which have been downloaded from the United States Geological Survey (https://www.usgs.gov/) (Table ). Other information related to the study area was derived from the city headquarters and census of India.
Additional information
Funding
Notes on contributors
Manju Sharma
Manju Sharma is an Assistant Professor in the Department of Geography at Dayanand College, Guru Jambheshwar University of Science and Technology, Hisar-125001, India.
Sandeep Kumar had done his Ph. D. from the Department of Geography, Maharshi Dayanand University, Rohtak-124001, India.
References
- Batty, M. (2005). Cities and complexity understanding cities with cellular automata agent-based models and fractals. MIT Press.
- Berling-Wolff, S., & Wu, J. (2004). Modeling urban landscape dynamics: A case study in Phoenix, USA. Urban Ecosystems, 7(3), 215–240. https://doi.org/10.1023/B:UECO.0000044037.23965.45
- Bhat, P. A., Shafiq, M. U., Mir, A. A., & Ahmed, P. (2017). Urban sprawl and its impact on land use/land cover dynamics of Dehradun city, India. International Journal of Sustainable Built Environment, 6(2), 513–521. https://doi.org/10.1016/j.ijsbe.2017.10.003
- Census of India. (2001). Primary census abstract, Haryana. : Director of Census Operations.
- Census of India. (2011). Primary census abstract, Haryana. Director of Census Operations.
- Dahal, K. R., Benner, S., & Lindquist, E. (2016). Analyzing spatiotemporal patterns of urbanization in Treasure Valley, Idaho, USA. Applied Spatial Analysis and Policy, 11(2), 205–226. https://doi.org/10.1007/s12061-016-9215-1
- Mundia, C. N., & Murayama, Y. (2010). Modeling spatial processes of urban growth in African cities: A case study of Nairobi City. Urban Geography, 31(2), 259–272. https://doi.org/10.2747/0272-3638.31.2.259
- Pickett, S. T., Cadenasso, M. L., Grove, J. M., Nilon, C. H., Pouyat, R. V., Zipperer, W. C., & Costanza, R. (2001). Urban ecological systems: Linking terrestrial ecological, physical, and socioeconomic components of metropolitan areas. Annual Review of Ecology and Systematics, 32(1), 127–157. https://doi.org/10.1146/annurev.ecolsys.32.081501.114012
- Sharma, M., & Kumar, S. (2017). Development and sprawling nature of Karnal City: A GIS perspective. The Geographer, 64(2), 50–59. https://www.indianjournals.com/ijor.aspx?target=ijor:tgr&volume=64&issue=2&article=006
- Sharma, M., & Kumar, S. (2019). Dynamics of urban growth in Hisar city of Western Haryana, India. Journal of Human Ecology, 66(1–3), 66–77. https://doi.org/10.31901/24566608.2019/66.1–3.3135
- Swanson, D. A., & Siegel, J. S. (2004). The methods and materials of demography (2nd ed., pp. 693). Elsevier Academic Press.
- Theil, H. (1967). Economics and information theory. North-Holland Publishing Company.
- Thomas, R. (1981). Information statistics in geography: Geo abstracts. University of East Anglia.
- United Nations. (2019). World urbanization prospects: The 2018 revision, department of economic and social affairs population division, ST/ESA/SER.A/420. https://population.un.org/wup/Publications/Files/WUP2018-Report.pdf
- Yeh, A. G. O., & Li, X. (2001). Measurement and monitoring of urban sprawl in a rapidly growing region using entropy. Photogrammetric Engineering and Remote Sensing, 67(1), 83–90. https://www.asprs.org/wp-content/uploads/pers/2001journal/january/2001_jan_83-90.pdf