 ?Mathematical formulae have been encoded as MathML and are displayed in this HTML version using MathJax in order to improve their display. Uncheck the box to turn MathJax off. This feature requires Javascript. Click on a formula to zoom.
ABSTRACT
Land use and land cover changes significantly impact carbon storage capacity, potentially causing long-term climate change, as examined in the Upper Awash Basin over three decades. This study aimed to examine the spatial and temporal dynamics of carbon stocks in the Upper Awash Basin over three decades due to land use and land cover changes. Remote sensing, ArcGIS, and the InVEST model were used to map changes in land use and land cover, as well as changes in carbon storage. The model and software have proven as accurate and useful tools for mapping changes in land use, cover, and carbon storage, allowing researchers to assess environmental impacts, plan conservation strategies, and effectively monitor ecosystems. Between 1993 and 2023, forests, shrublands, and wetlands decreased by 27.7%, 41.7%, and 60.7%, respectively, while cropland and built-up areas increased by 9.7% and 154.7%, respectively. As a result, the overall carbon stock decreased by 15%, from 17,342,625 tons to 14,810,521 tons of carbon. Agriculture expansion, overexploitation of forests for wood and charcoal production, settlement, population growth, and urban development are the primary drivers of carbon loss. Despite the upper Awash River Basin’s importance for carbon storage and sequestration, changes in land use and cover increased carbon emissions, contributing to climate change. Thus, this study highlights the link between land use land cover change and shifts in carbon stocks, emphasizing the importance of sustainable land management practices for maintaining or increasing carbon storage capacity, mitigating the effects of climate change, and improving overall ecosystem function.
Introduction
Climate change and global warming pose significant threats to global ecosystems as they impact the characteristics of ecosystems and the energy and material flow (Markham, Citation1996; Van Der Geest et al., Citation2019). The primary cause of global climate change is the increase in greenhouse gas (GHG) emissions resulting from economic development and industrialization (Javaherian et al., Citation2021). Carbon dioxide (CO2) concentration in the atmosphere has surpassed preindustrial levels, with CO2 being one of the major GHGs (Brown, Citation2002). Enhancing carbon storage and sinks can effectively reduce atmospheric CO2 concentration, mitigate the greenhouse effect, and regulate global climate change (Berc, Citation2004; Critchley et al., Citation2023; Goheer et al., Citation2023). Terrestrial ecosystems play a crucial role in carbon storage, encompassing above-ground, and below-ground biomass, soil organic matter, and dead organic matter pools. While natural conditions allow terrestrial ecosystems to act as carbon sinks, land use, and land cover changes can also turn them into carbon sources (X. Li et al., Citation2022; M. Zhao et al., Citation2019; S. Zhao et al., Citation2013).
Land use and land cover change are complex and dynamic processes that affect ecosystem services and carbon storage (Meshesha et al., Citation2014; Shao, Citation2005) and land use land cover (LULC) change caused by anthropogenic activities impacts terrestrial carbon storage (Zaehle et al., Citation2007). For instance, carbon stock dynamics have significant implications for climate change management. Changes in land cover, such as deforestation and forest degradation, have a direct impact on ecosystem carbon stocks. Forests play an important role in mitigating climate change by sequestering atmospheric carbon dioxide. Carbon storage and sequestration in forest biomass and soils contribute to climate change mitigation by lowering CO2 concentrations in the atmosphere(Rice, Citation2010; Solomon et al., Citation2018; Tadese et al., Citation2023). The land uses land cover change (LULCC) also aggravates socio-economic and environmental problems by altering land management practices at the landscape scale, disrupting biodiversity and hydrological cycles, reducing carbon sequestration potential, and reducing groundwater (Lambin & Meyfroidt, Citation2011; Lambin et al., Citation2003). In addition, it also affects evapotranspiration, infiltration, climate patterns, socio-economic dynamics, and natural phenomena both at a global and local scale (Akpoti et al., Citation2016; Chakilu & Moges, Citation2017).
Modeling land use and cover change is essential for long-term resource management, climate change mitigation, and hydrological processes, especially for basin-scale water resource development and extreme events (Kindu et al., Citation2016; Wang et al., Citation2020; Wang et al., Citation2021; Tao et al., Citation2023). Remote sensing plays a vital role in monitoring LULC changes as it provides timely and accurate data across large areas. Remote sensing techniques can be used to investigate the spatiotemporal patterns of carbon storage in large areas. In addition, the InVEST model uses remote sensing data to analyze ecosystem services such as carbon storage dynamics. The InVEST model is a valuable tool used to estimate the current amount of carbon stored in a landscape and assess the value of sequestered carbon. This model calculates the amount of carbon stored in different pools, including aboveground biomass, belowground biomass, soil, and dead organic matter, based on land use and land cover data. This integration of technologies enables a thorough examination of how land use changes affect carbon dynamics, thereby assisting in informed conservation efforts and sustainable land management practices (Bobrinskaya, Citation2012; Ullah et al., Citation2019; Zhu et al., Citation2022). The model aids stakeholders like governments, NGOs, and businesses in making informed decisions about ecosystem services and environmental conservation in landscape management for carbon storage and sequestration (Li et al., Citation2023; Maanan et al., Citation2019).
Awash River is extensively utilized for various purposes, such as irrigation, industries, hydropower generation, and domestic use. However, the availability of water in the Awash River Basin has led to a significant level of economic activity. This heightened economic activity has had negative consequences, including land degradation, the expansion of agriculture, and population growth (Hailemariam, Citation1999; Mengistu, Citation2008). The changes in land use and land cover in the area are influenced by multiple factors. Previous studies have highlighted issues such as land degradation, water resource depletion, and rapid population growth as major threats in the basin (Daba & You, Citation2022; Tadese et al., Citation2020).
The impact of land use and land cover changes on carbon storage and ecosystem function has received a lot of attention in recent years (Chen et al., Citation2017; Leh et al., Citation2016; Newbold et al., Citation2015). To gain a better understanding of how carbon stock changes over time, it is critical to assess its dynamics in rapidly changing land use and land cover, which helps to develop effective land management policies (Meshesha et al., Citation2014; Muleta, Citation2017). Previous research in this basin has primarily focused on the impact of climate change on water resources, frequently overlooking the significant effects of LULC changes on carbon stocks. Thus, the goal of this study was to investigate the spatial and temporal changes in carbon stocks associated with LULC change over thirty years (1993–2023) for ecosystem service evaluation, climate change mitigation, and informed policy development toward sustainable land use practices in the upper Awash River Basin.
Materials and methods
Description of the study area
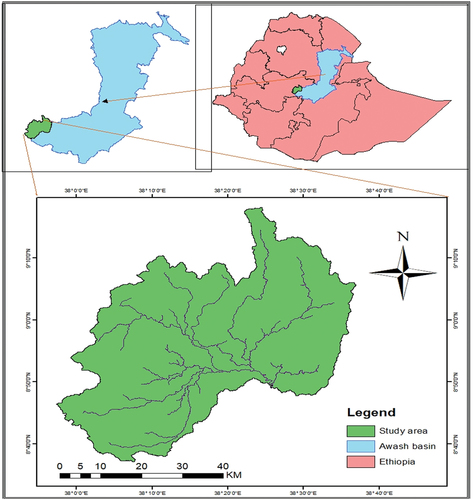
The Awash River basin is a significant river basin entirely contained within the country, covering approximately 1,200 kilometers and discharging into the salty Lake Abbe near the Djibouti border (FAO and IHE Delft, Citation2020; Girma Taddese & Peden, Citation2009). It is an important water resource for irrigation, domestic use, and other economic sectors (Assegide et al., Citation2022). The study area is in the upper Awash River Basin, extending downstream from the Chilimo-Gaji Forest to the Menagesha Suba Forest. Upper Awash Basin is located in the central part of Oromia National Regional State. It is bounded by latitudes of 8° 40’00‘to 9° 10’ 00’ N and longitudes of 38° 00’00‘to 38° 40’ 00’ E (Figure ). Its elevation ranges from 2290 to 3300 meters above sea level. The study area is approximately 2827 km2 (Figure ). The basin receives approximately 1200 mm of annual rainfall, and the average annual temperature ranges from 14.2 to 20.2 °C, with a relatively cold climate in November and December and a warm climate in May (Daba et al., Citation2020).
Figure 1. Location of the Upper Awash Basin.
Vertisols, nitisols, luvisols, and cambisols are among the soil types found in the study area. Agriculture is practiced in the study area, and agriculture is mostly practiced in gentle and flat-sloped areas. The main crops grown are cereals such as teff, wheat, barley, and maize. Beans, chickpeas, guava, and oil seeds are also grown, but they take up less space than cereals. Shrubland is the area’s second most important land use type (Alemu et al., Citation2018; Berhe et al., Citation2013; Girma Taddese & Peden, Citation2009).
Evaluation of LULC dynamics
Image processing and classification
The Landsat images were downloaded from the United States Geological Survey’s (USGS) Earth Explorer (https://earthexplorer.usgs.gov). Each Landsat was georeferenced to the WGS_84 datum and Universal Transverse Mercator Zone 37 coordinate system. The selection of satellite images primarily considered the spatial, spectral, radiometric, and temporal resolutions. The images were taken in nearly the same season (dry season) for the all-time series to make it cloud-free. They were accessed with a minimum cloud cover of ≤10%. Image pre-processing was done to improve image quality and to enhance the image for further processing or before detecting LULC changes (Cheruto et al., Citation2016; Sonka et al., Citation1993).
The classification process and analysis of the different LULC classes were started following image pre-processing using Landsat satellite images covering Landsat 4–5, 7, and 8. Five LULC classes were established, namely: built-up, high forest, shrubland, wetland, and cropland (Table ). Image processing and classification, such as radiometric correction (sun angle, atmospheric, and topographic), training sample selection and evaluation, creating and examining signature files, supervised classification, and accuracy assessment, were performed. A training sample was created for each class based on the coverage in hectares. A total of 3000 training samples were collected and evaluated for each study year (1993, 2003, 2013, and 2023). Before supervised image classification was applied, a signature file for all years was created and examined. Supervised classification was performed using a maximum likelihood classifier in ArcGIS 10.5, determining where the cells in each class sample in the multidimensional space are regularly distributed. Each pixel in the data collection was compared to each interpretation key category and labeled with the name of the category it most closely resembles. These steps allowed the study to successfully classify and analyze LULC changes over time using Landsat satellite imagery, ensuring a systematic approach to understanding land cover dynamics (Alshari & Gawali, Citation2021; Vivekananda et al., Citation2021).
Table 1. The land cover classification scheme
Classification accuracy assessment
The classification accuracy assessment was checked using the error/confusion matrix rule on the classified land use classes to see how closely the results relate to the true values and give a qualitative collection of information from the obtained satellite data. Using GPS points, ground control points were used to validate all years of classified images. The accuracy was determined using a total of 125 ground control points. The accuracy evaluation process was carried out for all years (1993, 2003, 2013, and 2023). The overall accuracy was calculated by dividing the total number of sample units by the sum of correctly classified sample units. The overall accuracy as well as the Kappa statistics were computed following the below formula:
Overall accuracy = number of pixels correctly classified/total number of pixel
Kappa (Kˆ) refers to the difference between the actual agreement and the agreement expected by chance and estimated as:
Where Po = proportion of correctly classified pixels and determined by diagonal in error matrix;
Pe = proportion of correctly classified pixels expected by chance and incorporates off-diagonal/Expected classification accuracy.
These metrics are essential in assessing the accuracy and reliability of pixel-based classification models, providing insights into how well the model performs in classifying image pixels accurately (McHugh, Citation2012).
Change detection analysis
The pattern of LULC changes for each class was computed in terms of square kilometers (km2), and the change in area coverage of each land use type was computed across the time series, i.e. the classified images were compared in four periods, namely: 1993–2003, 2003–2013, 2013–2023, and 1993–2023. The shift in area coverage for each land use type was calculated using the following formula, and the value was both in percentage and hectare.
Where, Area = the extent of each LULC category (positive values of the equation imply an increase, whereas negative values imply a decrease in extent).
% of LULC = percent change in the area of a land use type between initial and final time;
Area initial = the area of land used at the initial time;
Area final = the area of the same land use type at the final time and
Time interval = time interval between the final and initial years.
Carbon stock estimation for each LULC class
Sampling and data collection methods
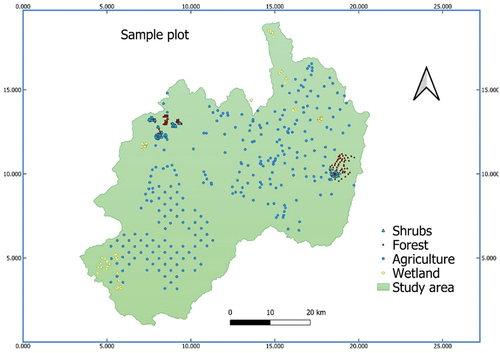
A stratified systematic sampling design and rectangular plots of 10 m by 20 m were laid down depending on the size of each land use type, and a systematically selected homogenous and representative land use type within the study area was used. A total of 260, 125, 50, and 63 sample plots for cropland, forest, shrubland, and wetland, respectively, were adopted to assess carbon stocks and environmental parameters. The size of the sample plots varied depending on the area of land use and land cover (Figure ). Trees and shrubs with a diameter at breast height (DBH) ≥ 5 cm were recorded within the main plots of 200 m2 for forest and shrubland. Soil samples were collected for four land uses (forest, shrubland, cropland, and wetland) from subplots of 1 m2 within the main plots. The DBH at 1.3 m was measured using diameter tape, while height was measured using a Suunto clinometer and visual estimation. The geographical coordinates of plots and altitudes were measured using a Garmin eTrex 10 GPS receiver. Trees and shrub species were identified by their local names, and the naming of these trees and shrub species was followed by Flora of Ethiopia and Eritrea (de Almeida et al., Citation2016; Hedberg, Citation1983); and Useful Trees and Shrubs of Ethiopia (Bekele, Citation2007).
Figure 2. Geographic distribution of sample plots in the study area.
Above Ground Biomass (AGB): The diameter (DBH) and total height of individual trees and shrubs with DBH ≥5 cm were measured in every 200 m2 sample plot. The AGB of trees and shrubs existing in the forest and shrubland was calculated using the general allometric model of Chave et al. (Citation2014), as stated below. The equation uses DBH and height measured from the sampling plots as well as the wood density values taken from the global wood density database.
where Y = predicted aboveground total biomass (kg), D = diameter at breast height (cm), H = total height (m), and ρ = wood density (g/cm3) from the global wood density database. The carbon stock was considered as 47% of the AGB’s carbon stock (Terakunpisut et al., Citation2007).
Below-Ground Biomass (BGB): The measurement of below-ground biomass is more difficult and time-consuming than AGB measurement. Therefore, it was estimated by MacDicken (Citation1997) that it is 20% of AGB.
Soil Organic Carbon (SOC): The soil sample was taken in five land-use systems, and the samples were taken from five points (four corners of the plot and one in the center) in the rectangular plot based on the composite method, i.e. mixing the soil samples from each of the five soil sampling points at each depth (depth of 0 cm–5 cm, 5 cm–10 cm, 10 cm–20 cm, and 20 cm–30 cm). The soil samples were air-dried and passed through a 2 mm sieve for SOC analysis. A hundred grams (100 g) of the mixed soil samples were analyzed in the laboratory and used for the determination of soil organic carbon. The sample was oven-dried at a temperature of 105°C for 24 hours to achieve a constant weight. The depth, bulk density, and concentrations of organic carbon were used to obtain an accurate inventory of carbon stocks in each LULC (four land-use types). The quantity of soil carbon per hectare was computed as follows (IPCC, Citation2006; Pearson et al., Citation2005, Citation2007).
Where SOC = soil organic carbon stock per unit area (t ha−1) BD = soil bulk density (g cm3), D = the total depth at which the sample is taken (30 cm), and %C = carbon concentration (%), soil carbon concentration (Cc%) was determined in the laboratory.
Bulk density was computed using the following equation:
where BD = bulk density of soil sample (g/cm3), Mav = average dry weight of soil sample per plot (g), and V = volume of soil sample in the core sampler (cm3) (Pearson et al., Citation2005).
Carbon stock estimation using the InVEST model
The InVEST model is mainly used to calculate the LULC dynamics affecting carbon storage, which operates simply with flexible parameters and obtains more accurate results (Jiang et al., Citation2017). Currently, substantial research has proven the use of InVEST models in simulating and evaluating LULC change and its effects on carbon storage (X. Li et al., Citation2022; Maanan et al., Citation2019; Wei et al., Citation2021; Xu et al., Citation2020). The model used land cover maps and data on stocks in four carbon pools (aboveground biomass, belowground biomass, soil, and dead organic matter) to estimate the amount of carbon stored in a selected area as indicated in Figure below.
Figure 3. Method of carbon stock dynamic assessment.
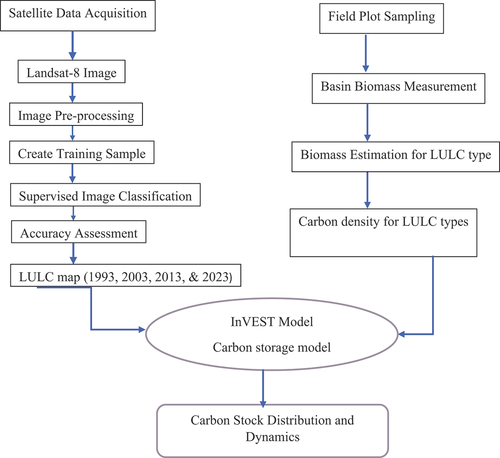
The carbon stock changes were estimated using the InVEST model. The model was applied to the LULC maps to calculate the net change in carbon stocks over time for each land use and land cover, assuming that any change in carbon stocks was due to changes between one LULC and another (Maanan et al., Citation2019). The model estimates the total carbon stock based on the aggregated carbon pool values assigned for each LULC class (Sharp et al., Citation2018). It divides carbon storage into four basic carbon pools for each LULC type: above-ground biomass (Cabove), below-ground biomass (Cbelow), soil organic (Csoil), and dead organic matter (Cdead) (Sharp et al., Citation2020), but the dead organic matter was not considered for the forest land due to the lack of data. AGB mainly refers to the carbon of living vegetation on the surface, while BGB mainly refers to the carbon in the root systems of underground forests and shrublands. Soil organics mainly include organic carbon in the soil for four land uses (forest, shrub, crop, and wetland).
The LULC data and its carbon pools served as an input to estimate carbon stocks for each grid cell and the entire study area. The spatial distribution of carbon storage is estimated by combining LULC data and its corresponding carbon pool data (Figure ). The LULC maps of 1993, 2003, 2013, and 2023 were required to calculate the carbon storage over 30 years. The InVEST model was run separately for each year to evaluate the effects of LULC changes over the period. A CSV table of LULC classes that contains data on fundamental carbon pools for each LULC class was used. The table also includes lucode, an integer land cover code that corresponds to an entry in the LULC map, and the carbon pool data. The carbon density/stock (CK) for LULC type is equal to the sum of aboveground, belowground, and soil carbon densities for LULC type
.
; where Ck = Total amount of carbon
The total Upper Awash River Basin carbon storage (CT) is equal to the sum of carbon density for LULC type multiplied by the area (
) for LULC type
, with n as the number of LULC types, which is set to 5 in this study.
where Ct = Total amount of carbon; CABgi = Average amount of carbon stored above ground within land use i; CBgi = Average amount of carbon stored below ground with land use i; CSli = Average amount of carbon stored in soil with LULC Aqi = the area of a specific LULC type.
Results and discussion
Classification and accuracy assessment
An accuracy assessment was performed to reduce uncertainty and improve the reliability of remotely sensed land use and land cover data. Confusion matrices (user accuracy, producer accuracy, and kappa coefficients) were used to gain valuable insights and verify the pixel-level agreement between the map and reference data, resulting in improved reliability and applicability of land use land cover change analysis. Accuracy assessment in this study revealed Kappa coefficients of 77.5%, 82.7%, 84%, and 87.6% for 1993, 2003, 2013, and 2023, respectively (Table ). The overall accuracies were 85.6%, 88.8%, 89.6%, and 92% for 1993, 2003, 2013, and 2023, respectively (Table ). The result indicates a strong agreement between the classified LULC changes and ground control point data. According to Monserud (Citation1990), Kappa values between 0.70 and 0.85 are very good indicators of the classified image. The high overall accuracies and Kappa values reported in the question suggest the land use and land cover (LULC) classification has been performed very well and the results can be considered reliable for further analysis.
Table 2. Summary of accuracy assessments of land use and land cover classification from 1993 to 2023
Land use and land cover maps
The land use and land cover map of the year 1993 showed that the total cultivated land was about 79.63% and would rise to 86.88% of the total study area (282,700 ha) in 2023 (Figure ). This was mainly because of population growth, which caused an increase in demand for new cultivation land and settlements. For instance, according to the study by Genet (Citation2020) Ethiopia’s population growth has been closely linked to significant land use and cover changes. The rapid increase in population has resulted in increased demand for cultivated land, grazing areas, settlement spaces, and resources such as fuel wood. The expansion of cultivated land into wetlands, forests, and shrubland has been a long-standing phenomenon in the central part of Ethiopia. In 1993, the total forest coverage was about 2.58% of the total study area, while in 2023, it was reduced to 1.87% (Table ). This could be because of the deforestation activities that have been taking place to make space for agriculture. Sisay (Citation2020) also mentioned that agricultural expansion, resettlement programs, charcoal burning, and fuel-cutting all contribute to deforestation in Ethiopia, resulting in a decrease in forest coverage. Following the fall of the socialist Derg in 1991, official control over the forest resource was reduced, most of the forest and shrubland were deforested, and a few years later, new forest management legislation (1994 and 2007) allowed the local community to participate in forest management, especially in the Chilimo Forest Priority Area. However, in Ethiopia in general and in the study area in particular, deforestation continues due to a lack of forest policy, and poor implementation on the ground and it was limited in its ability to benefit all local communities equally.
Figure 4. Land use and land cover change maps (1993, 2003, 2013, and 2023).
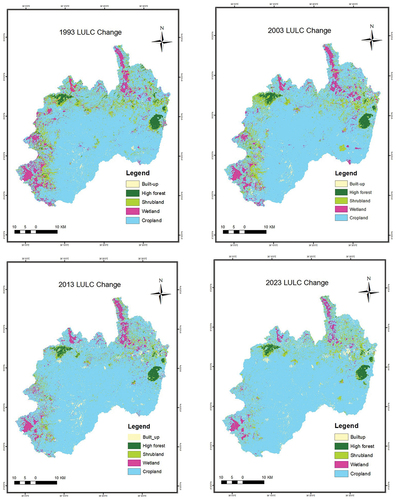
Table 3. Land use land cover map over time series (area in ha and %)
During the last 30 years, the cultivated land increased by almost 9%, whereas the forest land decreased by 27% from the initial coverage of 1993. All LULC variables, such as the spread of various agricultural activities, the production of fuelwood and charcoal, cutting trees for construction resources, settlements, and revenue growth, are associated with population increase and resettlement. The finding was consistent with Bahru et al. (Citation2021) and Shumba (Citation2001) who found that the high demand for fuelwood, combined with population pressure, has resulted in overexploitation of these resources, contributing to deforestation, land degradation, and climate change. Getahun et al. (Citation2017) also found that rapid population growth and associated resettlement efforts have increased pressure on natural resources, deforestation, and environmental degradation in certain parts of the country. The change statistics for the four periods are summarized in .
Table 4. Trend of land use land cover change in different periods
Changes in land use and land cover
The basin’s land use and land cover changes were divided into three time periods: 1993–2003 (first), 2003–2013 (second), and 2013–2023 (third) (Table ). Throughout the study periods, there was a continuous decline in forests, shrubs, and wetlands, while cropland and built-up areas increased (Figure ). In the first, second, and third periods, forest lands decreased by 12.33%, 9.38%, and 8.62%, respectively. The first period noticed the greatest rate of decline in forest lands, which could be attributed to governmental changes, as observed in other studies (Amogne, Citation2014; Kindu et al., Citation2016). Shrub lands decreased by 13.62% in the first period, 31.95% in the second period, and 0.61% in the third period. Wetlands also decreased by 12.44% in the first period, 14.79% in the second period, and 47.22% in the third period. Agricultural lands and built-up areas, on the other hand, increased in all three periods. Agricultural lands expanded by 2.4% in the first period, 3.77% in the second, and 2.68% in the third. In the first, second, and third periods, built-up areas increased by 54.84%, 43.75%, and 14.49%, respectively (Table ). The upper Awash basin’s land use and land cover changes include forest degradation and deforestation, shrubland, and wetland reduction due to cropland expansion and built-up during the study periods. The findings were consistent with Giweta (Citation2018); Wassie (Citation2020), and Sisay (Citation2020), who found that Ethiopia has experienced significant forest degradation, deforestation, and reduction of shrublands due to the land use land cover change driven by a complex set of socioeconomic and environmental factors.
Figure 5. Total trend of land use and land cover change (1993–2023).
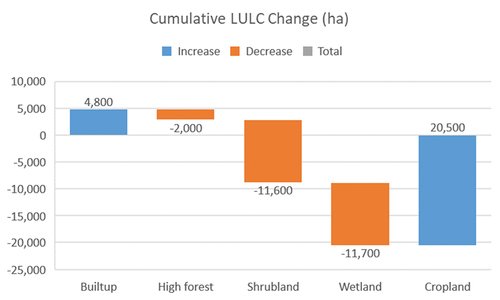
Table and Figure illustrate the LULC change in the study areas. The results showed that 27%, 60.62%, and 41% of high forest, wetland, and shrubland, respectively, were converted to other LULC classes, while cropland and built-up areas increased by 9.1% and 154%, respectively. Rapid declines in the high forest, shrubland, and wetland occurred between 1993 and 2003, 2003 and 2013, and 2013 and 2023, respectively, while cropland and built-up areas increased rapidly between 2003 and 2013, and 1993 and 2003, respectively. In overall, about 50,600 ha (17.9%) of the land changed from one land use type to another. Similarly, nearly 232,100 ha (82.1%) of the LULC remained unchanged from the 282,700 ha in 1993. The original extents of forest (7,300 ha), shrubland (27,900 ha), and wetland (19,300 ha) were reduced to forest (5,300 ha), shrubland (16,300 ha), and wetland (7,600 ha), which were converted to croplands and built-up areas.
Landscape carbon stocks in different pools
The InVEST model efficiently calculates and visualizes carbon storage using carbon pool data estimated from field sampling, which helps to reduce potential uncertainty and generate more reliable results. This study only considered three carbon pools: above-ground biomass, below-ground biomass, and soil organic carbon, to estimate the carbon stored in each carbon pool for each land use category. The InVEST modeling tool was used to map and calculate carbon stock for the study area, which can help to make decisions for sustainable land management. It presents a novel approach to assessing and reporting landscape carbon storage at the basin scale. The carbon stocks in each pool were aggregated over the study area to estimate the amount of carbon stored. The analysis showed that forestland had the highest carbon stock at 258.94 t/ha, followed by shrubland at 169.21 t/ha, and cropland had the lowest carbon stock at 41.2 t/ha. Among the three carbon pools in forestland, AGB had the highest recorded value, followed by soil carbon stock (Table ), whereas SOC had the highest recorded value for shrubland, followed by AGB. The Upper Awash River Basin’s forests contribute significantly to carbon stocks in aboveground biomass. These forests, consisting of various tree species, store carbon in their trunks, branches, and leaves. The extensive root systems of trees and other vegetation in forests and grasslands store significant amounts of carbon below the surface of the ground. Organic matter in the soil, which is derived from decomposed plant material, and microbial activity increases soil organic carbon stocks in the study areas. However, specific levels of soil organic carbon in the study area can vary depending on factors such as land use practices, vegetation cover, and soil management. Conserving and improving carbon stocks in above-ground, below-ground, and soil carbon pools can help to sequester carbon, reduce greenhouse gas emissions, and promote sustainable land use practices.
Table 5. Carbon stock in different pools
In the forest, 48.35% and 41.98% of the total carbon stock were stored in aboveground biomass and soil, respectively, and the remaining 9.67% of carbon was stored in a below-ground carbon pool, while 62.37% of the carbon was stored in the soil for shrubland. However, the total carbon stock in the basin was higher in the soil carbon pool, followed by the above-ground carbon pool (Figure ). The result of carbon pools varied with the land use and land cover classes, in which the amount of carbon stored in forest biomass per hectare was higher than the other land-use land covers. This is due to the high forest biomass and the decomposition of plant bodies in the forest, which makes the area rich in organic matter. Similarly, other findings indicated a higher carbon stock in forest land as compared to other LULC categories (Rajput et al., Citation2017; Solomon et al., Citation2018). Other studies have shown that forests, particularly the tropical Afromontane forests of Ethiopia, can sequester and store more carbon in their biomass and soils than other land use types (Birungi et al., Citation2023; Nyirambangutse et al., Citation2017; S. Tadese et al., Citation2023)
Figure 6. Spatial distribution of carbon pools (t/pixel).
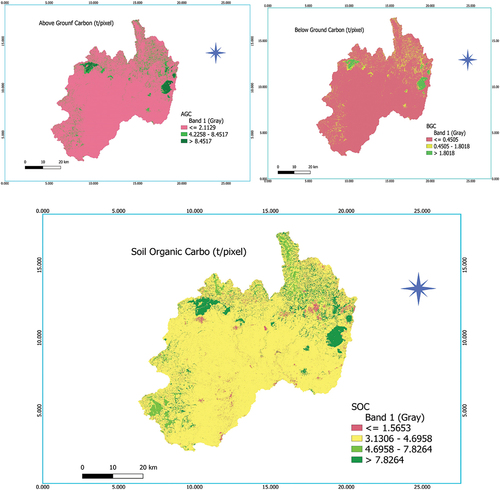
The variation in carbon stock between forest and shrubland might be due to the variation in the number of stems, density, and size of the trees. This is in line with the result of N. Solomon et al. (Citation2018), who stated that tree density and diameter have an effect on biomass carbon in northern Ethiopia. Soil from cultivated land had lower soil organic matter values than from forest land. N. Solomon et al. (Citation2017) and N. Solomon et al. (Citation2018) also found that forests have higher carbon stocks than shrublands due to their higher biomass density and tree cover. Changing land uses from forest to cultivation depletes nutrients and soil organic matter. The lower carbon stock was found in cropland that has been altered by intensive cultivation or other anthropogenic soil disturbance and land uses with woody perennials have higher carbon stock than those without (Toru & Kibret, Citation2019). Cultivation of soil reduces organic matter by facilitating the interaction of physical, chemical, and biological soil processes that increase the decomposition rate of soil organic matter (D. Solomon et al., Citation2000;).
Landscape carbon storage dynamics (1993–2023)
The results of carbon stocks for each land use and land cover class in the study area, estimated using the InVEST model, are presented in Table . Carbon stocks, estimated from the InVEST model, showed values ranging from 41.12 to 258.94 t/ha, depending on the types of LULC and carbon pools in the study area. The spatial distribution pattern of carbon storage in the study areas has changed significantly (Figure ). Changes in carbon stock are caused by a variety of factors, including disturbance levels, environmental gradients, site characteristics, land use types, and the interaction of biotic and abiotic factors within ecosystems (Gebeyehu et al., Citation2019; Muluneh & Worku, Citation2022). The total carbon storage (ton of carbon) of the Upper Awash River Basin in 1993, 2003, 2013, and 2023 was 17,342,625, 16505,173, 15213,536, and 14,810,521, respectively (Table ). The area’s carbon storage has decreased over the past 30 years, with a cumulative loss of 2,532,113 tons. From 1993 to 2023, the carbon storage in the study areas decreased by 15%, while 85% of the areas remained unchanged. In the last 30 years, there has been a substantial loss of carbon storage in the basin (8.96 tons per hectare) (Table ) due to LULC change. This has occurred in forests, shrublands, and wetlands, while cultivated land shows an increased carbon stock. This is because the cultivated land area expanded to other land uses, and land cover increased by 9% within the same period. The LULC transformation was mainly from land with high carbon density to land with low carbon density, as shown in the transformation from forest, shrubland, and wetland to cropland.
Table 6. Changes in carbon storage (1993–2023)
Figure 7. Spatial distribution of carbon stocks (1993–2023).
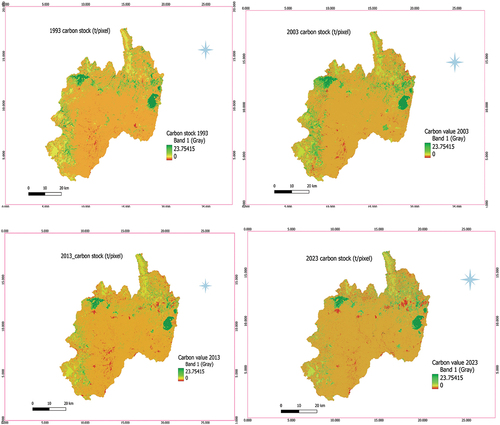
The total carbon stock lost between 1993 and 2023 was 517,880 tC, 1,962,836 tC, and 894,348 tC in the forest, shrubland, and wetland, respectively, with annual carbon losses of 17,262.67, 65427.87, and 29,811 tons of carbon, while the cropland was increased by 842,960 tons of carbon in the last 30 years (Figure ). The overall carbon stock decreased, with a mean yearly loss of 84,403.47 tons of carbon in the Upper Awash River Basin. Changes in carbon storage from 2003 to 2013 were the most obvious during the entire study period.
The estimated total carbon stock in the Upper Awash Basin for 1993 was 17,342,625 tons of carbon (61.35 tons/ha), while the estimated total carbon stock for 2023 was 14,810,521 tons (52.39 tons/ha) (Figure ). About 53.37% and 68.19% of the total carbon stock for 1993 and 2023 in the basin were from the cropland LULC class (Figure ). This is followed by shrubs and forest land contributing 27% (shrubs) and 12% (forest) for 1993 and 18% (shrubs) and 9.27% for 2023, respectively. Based on the values generated by the InVEST model, there was a decrease in the total carbon stock by 15% from 1993–2023. The decrease can be attributed to the decrease in the total area of LULC classes with high carbon values, such as forest, shrubland, and wetland. This was also supported by the rapid urbanization in the area caused by deforestation and land cultivation in the upland over the years. The findings are consistent with Toru and Kibret (Citation2019) and Tadese et al. (Citation2023) who discovered that land cover changes with high carbon density, such as forest, shrubland, and wetland conversion, reduce carbon stocks, affecting vegetation and soil organic carbon. Among the land uses, forest was found in Chilimo, and Menegesha has the largest average estimated carbon stock per hectare. This result is also consistent with the findings of Kassahun et al. (Citation2015) and Toru and Kibret (Citation2019) who found that forests have a higher average estimated carbon stock per hectare than other land uses.
Effects of LULC change on carbon stocks
Over the past three decades, changes in land use and cover have resulted in a significant loss of carbon storage in the Upper Awash River Basin, most of which has occurred in forest and shrubland areas. The results showed that the cropland of the study area expanded rapidly from about 225,100 ha in 1993 to 254,600 ha in 2023, while the overall percentage of forest, shrubs, and wetland decreased by 27.4, 41.58, and 60.62%, respectively. Most of the area lost from forests, wetlands, and shrubland was converted to cropland. This dramatic shift in land cover in the study area has led to the consequence that carbon stocks in forest land decreased from 1,890,262 tC to 1,372,382 tC over 30 years, with an average annual loss of 17,262.67 tC. Conversely, the carbon stock in cropland increased from 9,256,112 tC to 10,099,072 tC, with an average annual increase of 28,098 tC (Table ). The Upper Awash Basin is a vital region supporting agricultural activities and natural ecosystems. However, human activities, primarily driven by population growth and economic development, have led to changes in land use and land cover that impact the climate system. Similarly, studies by Dessu et al. (Citation2020), Wassie (Citation2020), and Regasa et al. (Citation2021) show that human activities, driven by population growth, resettlement programs, and poor governance, have resulted in significant LULC changes in Ethiopia, with negative consequences for the environment and local communities. The study also confirmed that the increasing demand for tree products such as fuel wood, construction materials, and charcoal for domestic uses in and around the woreda towns found in the study area was one of the major driving forces of land cover change that resulted in the net loss of carbon stock in the Upper Awash River Basin. This finding aligned with the study by (Gashaw et al., Citation2014, Citation2018), in which the increasing demand for agricultural land, increasing demand for fuel wood, construction poles, increased population, and poor natural resource conservation policy were identified as the major driving factors of LULC changes in Ethiopia.
Land use change affects the structure and function of the terrestrial ecosystem, which causes a change in carbon storage from 1993 to 2023. The change in carbon storage lies in the type of ecosystem and the change in land use patterns. LULC change, especially the conversion and degradation of forests, shrubs, and wetlands, is the key factor causing terrestrial carbon stocks to decline in the study area. Land use and land cover changes in the Upper Awash Basin have had significant impacts on carbon stocks in the region. Changes in land use and land cover can lead to the release or sequestration of carbon, which in turn affects the balance of greenhouse gases in the atmosphere and contributes to climate change. These effects were also confirmed by N. Solomon et al. (Citation2018) and (Tadese et al., Citation2023) who found that land use and land cover changes, particularly the expansion of cropland, built-up areas at the expense of forests and other natural ecosystems, can have a significant impact on the carbon balance by reducing carbon sequestration and increasing greenhouse gas emissions. This carbon release contributes to climate change, highlighting the need for sustainable land management practices to conserve and restore carbon sinks in the country. For instance, the conversion of natural vegetation, such as forests, shrublands, and wetlands, into cropland and built-up land uses often results in the loss of carbon stocks. Forests, in particular, store large amounts of carbon in their biomass and soils. When forests are cleared for agriculture or other purposes, the carbon stored in trees and vegetation is released into the atmosphere as carbon dioxide (CO2). Moisa et al. (Citation2023) and Muluneh and Worku (Citation2022) have also confirmed the findings, stating that the conversion of natural ecosystems, particularly forests, to other land uses in Ethiopia has resulted in significant carbon stock losses due to carbon release from vegetation and soils. This has implications for the region’s efforts to mitigate climate change. The expansion of agricultural activities, including the cultivation of annual crops and grazing, has resulted in the clearing of forests and the degradation of wetlands. This has not only led to the immediate release of carbon stored in vegetation but also reduced the potential for carbon sequestration in the future. Eshete et al. (Citation2020) discovered that agricultural expansion, particularly through unsustainable practices and land use change, significantly contributes to greenhouse gas emissions, causing climate change by altering local microclimates and influencing temperature and precipitation patterns in the region.
In the study area, land degradation resulting from improper land management practices, such as soil erosion and degradation, can also lead to carbon loss. When soils are eroded or degraded, the organic matter and carbon content in the soil are reduced. This reduces the capacity of the land to sequester carbon and contributes to the release of carbon into the atmosphere. The main cause of the carbon storage loss is related to agricultural expansion, over-extraction of forests for fuel wood and charcoal, settlements, population growth, and urban expansion. Land-use changes from forest to croplands have a far more significant impact on carbon storage by releasing atmospheric CO2. The main underlying processes associated with LULC change and carbon stock loss are population density and distribution, poverty, and a poor tenure system, which resulted in built-up and cropland expansion to wetlands, forest, and shrubland areas. With a growing population and increasing demand for food, there has been a significant expansion of agricultural activities in the upper Awash Basin. This expansion often leads to deforestation as forests are cleared for cultivation, resulting in changes in land use and land cover. In general, the conversion of land use types, particularly forests, to other land uses such as agriculture contributes significantly to carbon emissions both locally and globally. Land use management must be carefully managed to maintain and improve carbon sinks and thus mitigate climate change.
The Awash River Basin is home to a variety of ecosystems, including forests, shrublands, wetlands, and agricultural lands, all of which contribute significantly to carbon sequestration and storage. However, due to land use and land cover change, carbon emissions have increased over the last 30 years, and water resources are under increasing pressure from climate change, population growth, and others. Thus, understanding the dynamics of carbon stocks in the Upper Awash Basin and how they might be affected by climate change is critical for developing effective climate change mitigation strategies.
Conclusion and recommendations
This study used remote sensing, ArcGIS, and the InVEST model to examine the changes in carbon stocks over the past 30 years in the Upper Awash River Basin. The complexity and limitations of accurately estimating carbon stock dynamics using geospatial techniques were reduced by collecting ground truth data. Geospatial techniques, combined with ground truth data and the InVEST model, provide an accurate framework for analyzing the changes in carbon stocks at the basin scale. The study considered three carbon pools: above-ground biomass, below-ground biomass, and soil organic carbon, estimating carbon stored in each for each land use category. The results indicated a significant decline in carbon stock due to converting land with high carbon content, such as forests, shrublands, and wetlands, into croplands and urban areas. Forests and shrublands exhibited the highest carbon stock, while croplands had the lowest. Both biomass and soil carbon pools were found to be higher in forest and shrubland as compared to croplands. The expansion of croplands and settlements has led to a reduction in carbon storage capacity. These changes can have far-reaching consequences for agricultural productivity, water resources, and food security. The Upper Awash River Basin is crucial for water sources, biodiversity conservation, carbon storage, and ecosystem services. However, land use and land cover changes can significantly impact the basin’s spatial distribution of carbon stock. Therefore, it is imperative to develop land management and planning policies that discourage the conversion of forests, shrublands, and wetlands into croplands and urban areas while promoting afforestation and reforestation programs. Additionally, implementing effective population policies to control population growth and adopting appropriate technologies to improve land productivity will address the problem of agricultural expansion into forests and wetlands. An integrated approach such as ground truth measurement, using the InVEST model, and remote sensing to evaluate the feedback of carbon stock dynamics on the local climate system can provide a comprehensive understanding of the carbon stock dynamics and their impact on the local climate system in Ethiopia as well as in the study area. This approach can help in developing effective climate mitigation and adaptation strategies. Finally, a similar approach, such as using remote sensing and GIS, the InVEST model, spatial analysis techniques, and validating geospatial analysis results with ground truth data, can be adapted to replicate the study in other parts of Africa or around the world.
Disclosure statement
No potential conflict of interest was reported by the author(s).
Data availability statement
The data used to support the findings of this study are available from the corresponding author upon request.
References
- Akpoti, K., Antwi, E. O., & Kabo-Bah, A. T. (2016). Impacts of rainfall variability, land use and land cover change on stream flow of the Black Volta basin, West Africa. Hydrology, 3(3), 1–18. https://doi.org/10.3390/hydrology3030026
- Alemu, A., Korecha, D., & Mohamod, M. (2018). Impacts of various ENSO phases on cereal crop productivity in the Upper Awash Basin, central high land of Ethiopia. International Journal of Research in Environmental Science, 4(4), 8–21.
- Alshari, E. A., & Gawali, B. W. (2021). Development of classification system for LULC using remote sensing and GIS. Global Transitions Proceedings, 2(1), 8–17. https://doi.org/10.1016/j.gltp.2021.01.002
- Amogne, A. E. (2014). Forest resource management systems in Ethiopia: Historical perspective. International Journal of Biodiversity and Conservation, 6(2), 121–131. https://doi.org/10.5897/ijbc2013.0645
- Assegide, E., Alamirew, T., Dile, Y. T., Bayabil, H., Tessema, B., & Zeleke, G. (2022). A synthesis of surface water quality in Awash Basin, Ethiopia. Frontiers in Water, 4(March), 1–17. https://doi.org/10.3389/frwa.2022.782124
- Bahru, T., Kidane, B., & Tolessa, A. (2021). Prioritization and selection of high fuelwood producing plant species at Boset District, Central Ethiopia: An ethnobotanical approach. Journal of Ethnobiology and Ethnomedicine, 17(1), 1–15. https://doi.org/10.1186/s13002-021-00474-9
- Bekele A. (2007). Useful trees of Ethiopia: identification, propagation and management in 17 agroecological zones (p. 552). RELMA in ICRAF Project.
- Berc, J. L. (2004). Sustainable Soil and Land Management. Encyclopedia of Soils in the Environment, 4(December), 108–115. https://doi.org/10.1016/B0-12-348530-4/00304-0
- Berhe, F. T., Melesse, A. M., Hailu, D., & Sileshi, Y. (2013). MODSIM-based water allocation modeling of Awash River Basin, Ethiopia. Catena, 109, 118–128. https://doi.org/10.1016/j.catena.2013.04.007
- Birungi, V., Dejene, S. W., Mbogga, M. S., & Dumas-Johansen, M. (2023). Carbon stock of Agoro Agu Central Forest reserve, in Lamwo district, Northern Uganda. Heliyon, 9(3), e14252. https://doi.org/10.1016/j.heliyon.2023.e14252
- Bobrinskaya, M. (2012). Remote Sensing for Analysis of Relationships between Land Cover and Land Surface Temperature in Ten Megacities. Master’s of Science Thesis in Geoinformatics, (December), 12–19. https://www.diva-portal.org/smash/get/diva2:617823/FULLTEXT02/https://www.diva-portal.org/smash/record.jsf?pid=diva2%3A617823&dswid=1098
- Brown, S. (2002). Measuring carbon in forests: Current status and future challenges. Environmental Pollution, 116(3), 363–372. https://doi.org/10.1016/S0269-7491(01)00212-3
- Chakilu, G. G., & Moges, M. A. (2017). Assessing the land use/cover dynamics and its Impact on the low flow of Gumara Watershed, Upper Blue Nile Basin, Ethiopia. Hydrology: Current Research, 08(1). https://doi.org/10.4172/2157-7587.1000268
- Chave, J., Réjou-Méchain, M., Búrquez, A., Chidumayo, E., Colgan, M. S., Delitti, W. B., Duque, A., Eid, T., Fearnside, P. M., Goodman, R. C., Henry, M., Martínez-Yrízar, A., Mugasha, W. A., Muller-Landau, H. C., Mencuccini, M., Nelson, B. W., Ngomanda, A., Nogueira, E. M., Ortiz-Malavassi, E., Vieilledent, G., & Pélissier, R. (2014). Improved allometric models to estimate the aboveground biomass of tropical trees. Global Change Biology, 20(10), 3177–3190. https://doi.org/10.1111/gcb.12629
- Chen, P., Chavez, O., Ong, D. C., & Gunderson, B. (2017). Strategic resource use for learning: A self-administered intervention that guides self-reflection on effective resource use enhances academic performance. Psychological Science, 28(6), 774–785. https://doi.org/10.1177/0956797617696456
- Cheruto, M. C., Kauti, M. K., Kisangau, P. D., & Kariuki, P. (2016). Assessment of land use and land cover change using GIS and remote sensing techniques: a case study of Makueni County, Kenya. Journal of Remote Sensing & GIS, 05(4). https://doi.org/10.4172/2469-4134.1000175
- Critchley, W., Harari, N., Mollee, E., Mekdaschi-Studer, R., & Eichenberger, J. (2023). Sustainable land management and climate change adaptation for small-scale land users in Sub-Saharan Africa. The Land, 12(6), 1206. https://doi.org/10.3390/land12061206
- Daba, M. H., Ayele, G. T., You, S., & Buttafuoco, G. (2020). Long-term homogeneity and trends of hydroclimatic variables in upper awash river basin, Ethiopia. Advances in Meteorology, 2020, 1–21. https://doi.org/10.1155/2020/8861959
- Daba, M. H., & You, S. (2022). Quantitatively assessing the future land-use/land-cover changes and their driving factors in the upper stream of the Awash River based on the CA–markov model and their implications for water resources management. Sustainability (Switzerland), 14(3), 1538. https://doi.org/10.3390/su14031538
- de Almeida, C. S., Miccoli, L. S., Andhini, N. F., Aranha, S., de Oliveira, L. C., Artigo, C. E., Em, A. A. R., Em, A. A. R., Bachman, L., Chick, K., Curtis, D., Peirce, B. N., Askey, D., Rubin, J., Egnatoff, D. W. J., Uhl Chamot, A., El‐Dinary, P. B., Scott, J. … De Santa, U. F. (2016). Flora of Ethiopia and Eritrea. Revista Brasileira de Linguística Aplicada, 5(1). ht tps://revistas.ufrj.br/index.php/rce/article/download/1659/1508%0Ahttp://hipatiapress.com/hpjournals/index.php/qre/article/view/1348%5Cnht tp://w ww.tandfonline.com/doi/abs/1 0.1080/09500799708666915%5Cnhttps://mckinseyonsociety.com/downloads/reports/Educa
- Dessu, T., Korecha, D., Hunde, D., & Worku, A. (2020). Long-term land use land cover change in Urban centers of Southwest Ethiopia from a climate change perspective. Frontiers in Climate, 2(December), 1–23. https://doi.org/10.3389/fclim.2020.577169
- Eshete, Z. S., Mulatu, D. W., & Gatiso, T. G. (2020). CO2 emissions, agricultural productivity and welfare in Ethiopia. International Journal of Climate Change Strategies and Management, 12(5), 687–704. https://doi.org/10.1108/IJCCSM-07-2019-0046
- FAO and IHE Delft. (2020). Water accounting in the Awash River Basin. FAO WaPOR water accounting reports. www.fao.org/contact-us/licence-request
- Gashaw, T., Bantider, A., & Mahari, A. (2014). Evaluations of land use/land cover changes and land degradation in Dera District, Ethiopia: GIS and remote sensing based analysis. International Journal of Scientific Research in Environmental Sciences, 2(6), 199–208. https://doi.org/10.12983/ijsres-2014-p0199-0208
- Gashaw, T., Tulu, T., Argaw, M., Worqlul, A. W., Tolessa, T., & Kindu, M. (2018). Estimating the impacts of land use/land cover changes on ecosystem service values: The case of the andassa watershed in the Upper Blue Nile basin of Ethiopia. Ecosystem Services, 31, 219–228. https://doi.org/10.1016/j.ecoser.2018.05.001
- Gebeyehu, G., Soromessa, T., Bekele, T., & Teketay, D. (2019). Carbon stocks and factors affecting their storage in dry afromontane forests of Awi Zone, northwestern Ethiopia. Journal of Ecology and Environment, 43(1), 1–18. https://doi.org/10.1186/s41610-019-0105-8
- Genet, A. (2020). Population growth and land use land cover change scenario in Ethiopia. International Journal of Environmental Protection and Policy, 8(4), 77. https://doi.org/10.11648/j.ijepp.20200804.12
- Getahun, K., Poesen, J., & Van Rompaey, A. (2017). Impacts of Resettlement Programs on deforestation of moist evergreen afromontane forests in Southwest Ethiopia. Mountain Research and Development, 37(4), 474–486. https://doi.org/10.1659/MRD-JOURNAL-D-15-00034.1
- Girma Taddese, K. S., & Peden, D. (2009). The water of the awash river basin a future challenge to Ethiopia. Concept and Communication, (23), 301–316. https://doi.org/10.4314/ejossah.v14i1.3
- Giweta, M. (2018). “Reversing the degradation of Ethiopian Wetlands”: Is it unachievable phrase or a call to effective action? International Journal of Environmental Sciences & Natural Resources, 14(5). https://doi.org/10.19080/ijesnr.2018.14.555898
- Goheer, M. A., Fatima, L., Farah, H., Hassan, S. S., & Abbas, N. (2023). Assessment of change in forests land, carbon stock and carbon emissions of KPK, Pakistan for past three decades using geospatial techniques. Journal of Water and Climate Change, 14(2), 442–453. https://doi.org/10.2166/wcc.2023.315
- Hailemariam, K. (1999). Impact of climate change on the water resources of Awash River Basin, Ethiopia. Climate Research, 12(2–3 SPEC. ISS. 6), 91–96. https://doi.org/10.3354/cr012091
- Hedberg, O. (1983). Ethiopian flora project. Bothalia, 14(3/4), 571–574. https://doi.org/10.4102/abc.v14i3/4.1210
- IPCC. (2006). IPCC Guidelines for National Greenhouse Inventories. Prepared by the National Greenhouse Gas Inventories Programme, 20. https://www.researchgate.net/publication/259575269_IPCC_2006_Guidelines_for_National_Greenhouse_Gas_Inventories
- Javaherian, M., Ebrahimi, H., & Aminnejad, B. (2021). Prediction of changes in climatic parameters using CanESM2 model based on rcp scenarios (case study): Lar dam basin. Ain Shams Engineering Journal, 12(1), 445–454. https://doi.org/10.1016/j.asej.2020.04.012
- Jiang, W., Deng, Y., Tang, Z., Lei, X., & Chen, Z. (2017). Modeling the potential impacts of urban ecosystem changes on carbon storage under different scenarios by linking the CLUE-S and the InVEST models. Ecological Modelling, 345, 30–40. https://doi.org/10.1016/j.ecolmodel.2016.12.002
- Kassahun, K., Soromessa, T., & Belliethathan, S. (2015). Forest carbon stock in woody plants of ades forest, Western Hararghe Zone of Ethiopia and its variation along environmental factors: Implication for climate change mitigation. Journal of Natural Sciences Research, 5(21), 96–109.
- Kindu, M., Schneider, T., Teketay, D., & Knoke, T. (2016). Changes of ecosystem service values in response to land use/land cover dynamics in Munessa-Shashemene landscape of the Ethiopian highlands. Science of the Total Environment, 547, 137–147. https://doi.org/10.1016/j.scitotenv.2015.12.127
- Lambin, E. F., Geist, H. J., & Lepers, E. (2003). Dynamics of land-use and land-cover change in tropical regions. Annual Review of Environment and Resources, 28(1), 205–241. https://doi.org/10.1146/annurev.energy.28.050302.105459
- Lambin, E. F., & Meyfroidt, P. (2011). Global land use change, economic globalization, and the looming land scarcity. Proceedings of the National Academy of Sciences of the United States of America, 108(9), 3465–3472. https://doi.org/10.1073/pnas.1100480108
- Leh, M. D. K., Matlock, M. D., Cummings, E. C., & Nalley, L. L. (2016). Corrigendum to “Quantifying and mapping multiple ecosystem services change in West Africa”. Agriculture, Ecosystems and Environment, 221, 285. https://doi.org/10.1016/j.agee.2016.01.035
- Li, P., Chen, J., Li, Y., & Wu, W. (2023). Using the InVEST-PLUS model to predict and analyze the pattern of ecosystem carbon storage in Liaoning Province, China. Remote Sensing, 15(16)), 4050. https://doi.org/10.3390/rs15164050
- Li, X., Huang, C., Jin, H., Han, Y., Kang, S., Liu, J., Cai, H., Hu, T., Yang, G., Yu, H., & Sun, L. (2022). Spatio-temporal patterns of carbon storage derived using the invest model in Heilongjiang Province, Northeast China. Frontiers in Earth Science, 10(March), 1–11. https://doi.org/10.3389/feart.2022.846456
- Maanan, M., Maanan, M., Karim, M., Ait Kacem, H., Ajrhough, S., Rueff, H., Snoussi, M., & Rhinane, H. (2019). Modelling the potential impacts of land use/cover change on terrestrial carbon stocks in north-west Morocco. International Journal of Sustainable Development and World Ecology, 26(6), 560–570. https://doi.org/10.1080/13504509.2019.1633706
- MacDicken, K. (1997). A guide to monitoring carbon storage in forestry and agro-forestry projects. Winrock International. Winrock International Institute for Agricultural Development. January 1997. https://scholar.google.com/scholar_lookuptitle=A+guide+to+monitoring+carbon+storage+in+forestry+and+agroforestry+projects&author=MacDicken%2C+K.G.&publication_year=1997
- Markham, A. (1996). Potential impacts of climate change on ecosystems: A review of implications for policymakers and conservation biologists. Climate Research, 6, 179–191. https://doi.org/10.3354/cr006179
- McHugh, M. L. (2012). Lessons in biostatistics interrater reliability: The kappa statistic. Biochemica Medica, 22(3), 276–282. https://hrcak.srce.hr/89395
- Mengistu, D. (2008). Regional Flood Frequency Analysis for Upper Awash Sub Basin (UPSTREAM of KOKA) [ Unpublished Master Thesis]. Addis Ababa University.
- Meshesha, D. T., Tsunekawa, A., Tsubo, M., Ali, S. A., & Haregeweyn, N. (2014). Land-use change and its socio-environmental impact in Eastern Ethiopia’s highland. Regional Environmental Change, 14(2), 757–768. https://doi.org/10.1007/s10113-013-0535-2
- Moisa, M. B., Dejene, I. N., Deribew, K. T., Gurmessa, M. M., & Gemeda, D. O. (2023). Impacts of forest cover change on carbon stock, carbon emission and land surface temperature in sor watershed, Baro Akobo Basin, Western Ethiopia. Journal of Water and Climate Change, 14(8), 2842–2860. https://doi.org/10.2166/wcc.2023.208
- Monserud, R. (1990). Methods for Comparing Global Vegetation Maps. The Geographical Journal, 126(4), 552. https://doi.org/10.2307/1793450
- Muleta, T. T. (2017). Forest landscape structure, fragmentation and ecosystem services in the Central highlands of Ethiopia Forest landscape structure, fragmentation and ecosystem services in the Central highlands of Ethiopia by a PhD dissertation submitted in fulfillment of. June. https://www.researchgate.net/publication/320395418_Forest_landscape_structure_fragmentation_and_ecosystem_services_in_the_Central_highlands_of_Ethiopia
- Muluneh, M. G., & Worku, B. B. (2022). Carbon storages and sequestration potentials in remnant forests of different patch sizes in northern Ethiopia: An implication for climate change mitigation. Agriculture & Food Security, 11(1). BioMed Central. https://doi.org/10.1186/s40066-022-00395-0
- Newbold, T., Hudson, L. N., Hill, S. L., Contu, S., Lysenko, I., Senior, R. A. & Purvis, A. (2015). Global effects of land use on local terrestrial biodiversity. Nature, 520(7545), 45–50. https://doi.org/10.1038/nature14324
- Nyirambangutse, B., Zibera, E., Uwizeye, F. K., Nsabimana, D., Bizuru, E., Pleijel, H., Uddling, J., & Wallin, G. (2017). Carbon stocks and dynamics at different successional stages in an Afromontane tropical forest. Biogeosciences, 14(5), 1285–1303. https://doi.org/10.5194/bg-14-1285-2017
- Pearson, T., Sandra, L. R. H., Brown Richard, P., & Birdsey, A. (2007). Measurement Guidelines for the Sequestration of Forest Carbon, northern research station. General Technical Report NRS-18. United States Department of Agriculture, Serviece, 5.
- Pearson, T., Walker, S., & Brown, S. (2005). Sourcebook for Land use, Land-use change and forestry projects. Winrock International and the BioCarbon Fund of the World Bank, 21(3). http://wbcarbonfinance.org/docs/Background_LULUCF_Sourcebook_compressed.pdf
- Rajput, B. S., Bhardwaj, D. R., & Pala, N. A. (2017). Factors influencing biomass and carbon storage potential of different land use systems along an elevational gradient in temperate northwestern Himalaya. Agroforestry Systems, 91(3), 479–486. https://doi.org/10.1007/s10457-016-9948-5
- Regasa, M. S., Nones, M., & Adeba, D. (2021). A review on land use and land cover change in Ethiopian basins. The Land, 10(6), 585. https://doi.org/10.3390/land10060585
- Rice, J. (2010). Carbon stock conditions and how climate and disturbance may influence carbon dynamics on the Shoshone National Forest, Wyoming. Ipcc, 2007, 1–16. https://doi.org/10.2737/RMRS-GTR-264
- Shao, J. (2005). Land use change and its corresponding ecological responses: A review. Journal of Geographical Sciences, 15(3), 305. https://doi.org/10.1360/gs050305
- Sharp, R., Chaplin-Kramer, R., Wood, S., Guerry, A., Tallis, H., Ricketts, T., Nelson, E., Ennaanay, D., Wolny, S., Olwero, N., Vigerstol, K., Pennington, D., Mendoza, G., Aukema, J., Foster, J., Forrest, J., Cameron, D. R., Arkema, K., Lonsdorf, E., Douglass, J. (2018). InVEST User’s Guide. https://doi.org/10.13140/RG.2.2.32693.78567
- Shumba, E. M. (2001). Forestry outlook studies in Africa. (December). https://www.fao.org/4/y8672e/y8672e00.pdf
- Sisay, G. (2020). Forest cover change in Ethiopia: extent, driving factors, environmental implication and management strategies, systematic review. Journal of Resources Development and Management, 67, 1–13. https://doi.org/10.7176/jrdm/67-01
- Solomon, N., Birhane, E., Tadesse, T., Treydte, A. C., & Meles, K. (2017). Carbon stocks and sequestration potential of dry forests under community management in Tigray, Ethiopia. Ecological Processes, 6(1). https://doi.org/10.1186/s13717-017-0088-2
- Solomon, D., Lehmann, J., & Zech, W. (2000). Land use effects on soil organic matter properties of chromic luvisols in semi-arid northern Tanzania: Carbon, nitrogen, lignin and carbohydrates. Agriculture, Ecosystems and Environment, 78(3), 203–213. https://doi.org/10.1016/S0167-8809(99)00126-7
- Solomon, N., Pabi, O., Annang, T., Asante, I. K., & Birhane, E. (2018). The effects of land cover change on carbon stock dynamics in a dry Afromontane forest in northern Ethiopia. Carbon Balance and Management, 13(1). https://doi.org/10.1186/s13021-018-0103-7
- Sonka, M., Hlavac, V., & Boyle, R. (1993). Image pre-processing. Image Processing, Analysis and Machine Vision, 56–111. https://doi.org/10.1007/978-1-4899-3216-7_4
- Tadese, M., Kumar, L., Koech, R., & Kogo, B. K. (2020). Mapping of land-use/land-cover changes and its dynamics in Awash River Basin using remote sensing and GIS. Remote Sensing Applications: Society & Environment, 19(June), 100352. https://doi.org/10.1016/j.rsase.2020.100352
- Tadese, S., Soromessa, T., Aneseye, A. B., Gebeyehu, G., Noszczyk, T., & Kindu, M. (2023). The impact of land cover change on the carbon stock of moist afromontane forests in the Majang Forest Biosphere Reserve. Carbon Balance and Management, 18(1), 1–20. https://doi.org/10.1186/s13021-023-00243-z
- Tao, Y., Tian, L., Wang, C., & Dai, W. (2023). Dynamic simulation of land use and land cover and its effect on carbon storage in the Nanjing metropolitan circle under different development scenarios. Frontiers in Ecology and Evolution, 11(February), 1–16. https://doi.org/10.3389/fevo.2023.1102015
- Terakunpisut, J., Gajaseni, N., & Ruankawe, N. (2007). Carbon sequestration potential in aboveground biomass of Thong Pha Phum National Forest, Thailand. Applied Ecology and Environmental Research, 5(2), 93–102. https://doi.org/10.15666/aeer/0502_093102
- Toru, T., & Kibret, K. (2019). Carbon stock under major land use/land cover types of Hades sub-watershed, eastern Ethiopia. Carbon Balance and Management, 14(1), 1–14. https://doi.org/10.1186/s13021-019-0122-z
- Ullah, S., Tahir, A. A., Akbar, T. A., Hassan, Q. K., Dewan, A., Khan, A. J., & Khan, M. (2019). Remote sensing-based quantification of the relationships between land use land cover changes and surface temperature over the lower Himalayan region. Sustainability(Switzerland), 11(19), 5492. https://doi.org/10.3390/su11195492
- Van Der Geest, K., De Sherbinin, A., Kienberger, S., Zommers, Z., Sitati, A., Roberts, E., & James, R. (2019). Loss and Damage from Climate Change. Springer International Publishing. https://doi.org/10.1007/978-3-319-72026-5
- Vivekananda, G. N., Swathi, R., & Sujith, A. V. L. N. (2021). RETRACTED ARTICLE: Multi-temporal image analysis for LULC classification and change detection. European Journal of Remote Sensing, 54(sup2), 189–199. https://doi.org/10.1080/22797254.2020.1771215
- Wang, Z., Cao, J., Zhu, C., & Yang, H. (2020). The impact of land use change on ecosystem service value in the upstream of Xiong’an New Area. Sustainability (Switzerland), 12(14), 1–16. https://doi.org/10.3390/su12145707
- Wang, Q., Guan, Q., Lin, J., Luo, H., Tan, Z., & Ma, Y. (2021). Simulating land use/land cover change in an arid region with the coupling models. Ecological Indicators, 122, 107231. https://doi.org/10.1016/j.ecolind.2020.107231
- Wassie, S. B. (2020). Natural resource degradation tendencies in Ethiopia: A review. Environmental Systems Research, 9(1), 1–29. https://doi.org/10.1186/s40068-020-00194-1
- Wei, P., Chen, S., Wu, M., Deng, Y., Xu, H., Jia, Y., & Liu, F. (2021). Using the invest model to assess the impacts of climate and land use changes on water yield in the upstream regions of the shule river basin. Water (Switzerland), 13(9), 1–20. https://doi.org/10.3390/w13091250
- Xu, X., Shrestha, S., Gilani, H., Gumma, M. K., Siddiqui, B. N., & Jain, A. K. (2020). Dynamics and drivers of land use and land cover changes in Bangladesh. Regional Environmental Change, 20(2). https://doi.org/10.1007/s10113-020-01650-5
- Zaehle, S., Bondeau, A., Carter, T. R., Cramer, W., Erhard, M., Prentice, I. C., Reginster, I., Rounsevell, M. D. A., Sitch, S., Smith, B., Smith, P. C., & Sykes, M. (2007). Projected changes in terrestrial carbon storage in Europe under climate and land-use change, 1990-2100. Ecosystems (New York), 10(3), 380–401. https://doi.org/10.1007/s10021-007-9028-9
- Zhao, M., He, Z., Du, J., Chen, L., Lin, P., & Fang, S. (2019). Assessing the effects of ecological engineering on carbon storage by linking the CA-Markov and InVEST models. Ecological Indicators, 98(November 2017), 29–38. https://doi.org/10.1016/j.ecolind.2018.10.052
- Zhao, S., Liu, S., Sohl, T., Young, C., & Werner, J. (2013). Land use and carbon dynamics in the southeastern United States from 1992 to 2050. Environmental Research Letters, 8(4), 044022. https://doi.org/10.1088/1748-9326/8/4/044022
- Zhu, L., Song, R., Sun, S., Li, Y., & Hu, K. (2022). Land use/land cover change and its impact on ecosystem carbon storage in coastal areas of China from 1980 to 2050. Ecological Indicators, 142(August), 109178. https://doi.org/10.1016/j.ecolind.2022.109178