 ?Mathematical formulae have been encoded as MathML and are displayed in this HTML version using MathJax in order to improve their display. Uncheck the box to turn MathJax off. This feature requires Javascript. Click on a formula to zoom.
ABSTRACT
Following India’s economic liberalization, rapid economic growth is driving urban sprawl in mid-sized cities, altering land use patterns from the core to the periphery of the city. This study offers a comprehensive analysis of the evolving urban landscape in the Sonipat-Kundli urban agglomeration within the Delhi-NCR region, focusing on land use changes. Leveraging remote sensing data and analytical techniques, the study spans 1991 to 2021, using Landsat imagery and ERDAS Imagine software. Employing a Maximum Likelihood Classifier, it creates Land Use Land Cover maps, evaluating accuracy with the Kappa coefficient. Utilizing built-up density and the Shannon Entropy model, it assesses urban sprawl dynamics. Zoning, based on road networks and CBD buffer zones, enhances the analysis. Land transformation indicates that large tracts of agricultural land are directly converted to built-up patches which are used majorly for residential and industrial purposes. Notably, a leapfrog pattern of sprawl, driven by industrial development, is observed encroaching on agricultural land in Kundli away from the core city of Sonipat. These findings provide vital insights for future urban planning, policy formulation, and sustainable development initiatives in the region.
1. Introduction
Urbanization is a common occurrence that has emerged as a key demographic trait. It pertains to how the expansion of economic and infrastructure activities leads to an increase in the built-up area and the proportion of people living in cities and towns (Ali & Fazal, Citation2022; Sudhira et al., Citation2003; Yeh & Li, Citation2001). The prevalent trend observed in emerging nations involves urban expansion surpassing municipal boundaries to encompass the surrounding hinterlands and rural areas. The transformation of arable land into concrete surfaces is widespread. By 2050, the United Nations predicts that urban areas will house 68 percent of the world’s population, with 90 percent of this increase concentrated in Asia and Africa. The major key points behind this shift are increasing urbanization, residence shift from rural to urban parts, and industrial growth. Urban areas are growing and expanding in nearby rural lands to cater to the needs of all segments and this process is called urban sprawl.
Urban sprawl denotes the built-up growth of dispersed new development on isolated parcels separated from nearby developed locations by vacant land (Yeh & Li, Citation2001). Urban sprawl arises from factors such as the affordability of land in the hinterland as opposed to the city core, along with the presence of an extensive network of roads and highways. An expanding city exhibits a unique urban sprawl pattern, including randomly dispersed sprawl towards the outskirts, ribbon-like development along major transportation routes, and scattered low-density and leapfrogging sprawl (Taiwo, Citation2022; Viana et al., Citation2019; Yue et al., Citation2013). The liberalization of the Indian economy through New Economic Policies (NEP) in 1991 facilitated Foreign Direct Investment (FDI) in real estate, consequently contributing to the expansion of urban areas and the enhancement of infrastructure (Chadchan & Shankar, Citation2012). Investments in urban infrastructure are the primary driver behind the significant expansion in size observed in metropolitan cities. The process alters the land use pattern of the city’s outer region and induces a large interchange of land for various purposes. The emergence of new urban areas surrounding a city is marked by considerable horizontal expansion (Dhanaraj & Angadi, Citation2022; Hasnine et al., Citation2020; Rahman et al., Citation2012; Shaw, Citation2005; Sudhira & Ramachandra, Citation2007) and this transformation of land primarily occurs at the cost of agricultural land (Amin & Fazal, Citation2012; D. Dutta et al., Citation2020; Fazal, Citation2000).
In the initial phase of urban expansion, there is the proliferation of less dense scattered residential and industrial units in agricultural areas situated beyond the city’s periphery (Barnes et al., Citation2001). Urban sprawl adversely affects the region’s ecology, land use and other resources and has been criticized for insufficient use of land resources and energy, reduction in forest land, reserved forests, degradation of air quality, issues of solid waste treatment, and degradation of groundwater quality due to untreated effluents from industries and large-scale encroachment on agricultural land (Effat & El Shobaky, Citation2015; Jha et al., Citation2008; Rahman et al., Citation2010; Sisodia et al., Citation2015). As the local economy expands and nearby rural villages undergo an urbanization process, socio-economic dimensions gradually decline over time. This shift is propelled by the diminishing significance of agriculture, a decrease in community life and cultural values, and the loss of public space.
Lastly, these nearby villages integrated into planned urban extensions experience a gradual erosion of their rural characteristics. Hence tracking the temporal land use alterations can assist authorities and urban planners in comprehending urban expansion, enabling them to devise more sustainable city development strategies. Some of the prominent methods adopted to analyze landscape transformation and urban sprawl are land cover change detection (Deka et al., Citation2011; V. Dutta, Citation2012), growth percentage (A. Kumar & Kumar, Citation2017; Naikoo et al., Citation2022), built-up density calculation of built-up areas (Shikary & Rudra, Citation2021), Shannon entropy (Ahuja et al., Citation2022; Chettry & Surawar, Citation2020; Paarcha et al., Citation2023; Shikary & Rudra, Citation2021) and landscape metrics (Azabdaftari & Sunar, Citation2022; Das & Angadi, Citation2021; Ramachandra et al., Citation2012; Sahana et al., Citation2018; Sharma & Joshi, Citation2013; Sudhira & Ramachandra, Citation2007). Remote sensing and GIS-based approaches to gauge urban expansion are most common among various researchers (Chaudhuri et al., Citation2022; Dhanaraj & Angadi, Citation2022; D. Dutta et al., Citation2020; Hasnine et al., Citation2020; Shikary & Rudra, Citation2021).
Studies demonstrate that the use of remotely sensed data coupled with the built-up density and Shannon entropy calculation is a robust method to detect and measure the spatial extents of urban sprawl on both local and regional scales due to its simplicity and easy integration with GIS (Bhatta et al., Citation2010; Bindajam et al., Citation2021; Deka et al., Citation2011; D. Dutta et al., Citation2020; Purvis et al., Citation2019; Yeh & Li, Citation2001). Entropy measures the degree of disorders or randomness in the allocation of urban areas (Ahuja et al., Citation2022; Chettry & Surawar, Citation2020; Paarcha et al., Citation2023). According to the second law of thermodynamics, entropy in physical systems always increases but in social systems, entropy has been shown to move in both directions. Further, it is implied when the entropy value positively increases then a system is expanding and sprawling, and further if entropy decreases then it could be concluded that infilling is happening between already existing systems and the system is getting compact (Haynes & Storbeck, Citation1978). Moreover, Shannon entropy helps to detect the pattern of city growth whether it is compact or dispersed based on its values. Urban land uses which were previously homogeneous now expanding in such a way that the surrounding rural landscape got interrupted and fragmented thereby increasing landscape disorganization (Cabral et al., Citation2013; Sudhira et al., Citation2003). Thus, built-up density and entropy calculation help to detect the pattern of urban sprawl occurring in an area. In the past five decades, India has witnessed a doubling of its overall population, while the urban population has surged by five times (Shaw, Citation2019). According to the Census of India (2011), growth in the urban population outpaced the rural population growth. Rural India is witnessing a decline in the growth of its population. Rising population and expanding economy necessitate increased infrastructure capacity, resulting in the expansion of cities in the form of urban agglomeration. Various studies have analyzed the urban growth pattern of megacities like Mangalore, Arnavutkoy, Hill Shire, and Delhi-NCR (Azabdaftari & Sunar, Citation2022; Das & Angadi, Citation2021; Dhanaraj & Angadi, Citation2022; Naikoo et al., Citation2022). Hence, unregulated and unchecked urban expansion as well as land use changes along the outskirts of the city region is currently a source of concern among various scholars. As approx. 46 percent of Delhi-NCR lies in Haryana hence the economic developments of the national capital have spilled over the nearby cities of Haryana which include Gurugram, Faridabad, Bahadurgarh, Sonipat, Panipat, and many others. The implementation of NCR policies has fueled a rapid expansion of the real estate sector in Haryana, especially in Gurugram (Chauhan & Kumar, Citation2020; Pramanik et al., Citation2021).
Apart from this, Sonipat-Kundli is a metro center in the Sonipat district of Haryana state adjoining Delhi and is part of the Delhi NCR region. The metro center has been designated by NCRPB (National Capital Region Planning Board) among 6 other urban centers in NCR. Industrial units located along the Delhi-Sonipat border have caused the demand for more land for residential and other industrial purposes. The Sonipat-Kundli Urban Agglomeration includes 1 municipal corporation, 1 municipal town, 3 non-municipal towns and 59 rural villages. In addition to aiding in population dispersal from the national capital, the agglomeration unit serves as a potent growth node to draw in capital functions and activities. Studies have been done to analyze the growth pattern of Sonipat City (S. Kumar & Sangwan, Citation2013; S. Kumar & Sharma, Citation2007) only but there is a dearth of research on this large agglomerated unit. Even in studies of Delhi NCR (Chaudhuri et al., Citation2022; D. Dutta et al., Citation2020; Jain et al., Citation2011; Sharma & Joshi, Citation2013) its sub-centers outside NCT Delhi remain in a blurred status. Hence, in the context, the current discussion is evaluating the land use transformation and urban sprawl from 1991 to 2021 with the help of Shannon’s Entropy dispersion index in the Sonipat-Kundli urban center. It makes it possible to gather information to preserve the currently available natural resources and to comprehend the reasons behind and effects of resource overexploitation. The study helps to understand the changing pattern of urban growth, its impact on land use, and the sprawl induced by it.
2. Study area description
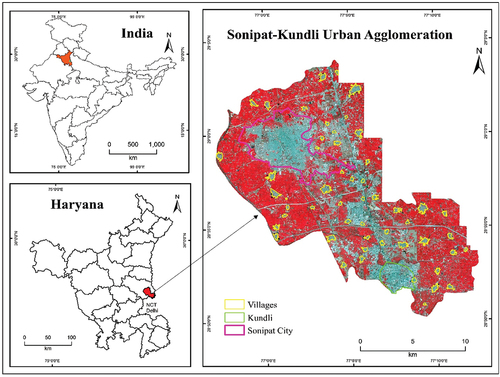
The Sonipat-Kundli urban agglomeration, covered about 305 sq. km. area situated within the geographical coordinates of 28° 5′ 11′′ N to 29° 3′ 57′′ N latitudes and 76° 57′4′′ E to 77° 12′25′′ E longitudes (Figure ). The designation of Sonipat-Kundli as a metro centre within the Delhi NCR is part of comprehensive effort by NCRPB (National Capital Region Planning Board) for regional development. These centers are vital for accommodating population growth, driving economic activities, and ensuring that urbanization in NCR is well-planned and sustainable. They serve as key hubs for infrastructure and investment, contributing significantly to the region’s overall progress. The agglomeration unit comprising Sonipat and Kundli, along with 59 rural villages and 3 non-municipal urban towns represents a complex and diverse area in terms of both urban and rural development (Development plan, 2021). The population was 8,75,417 persons for the year, 2021 (estimated using an equation by Angel et al., Citation2005) which was 4,95,643 in the year 2011(Census of India, 2011). The strategic location with proximity to Delhi, and excellent interstate connectivity via National Highway 44, along with the intersection of eastern and western peripheral expressways significantly enhances its appeal for an industrial growth node in Haryana. In the region, the Haryana State Industrial and Infrastructure Development Corporation (HSIIDC) has set up multiple industrial estates, such as Kundli Industrial Estate, Murthal Industrial Estate, Rai Industrial Estate, and Sonipat Industrial Estate to support industrial and economic development. Hence the transformation is characterized by dynamic shifts in land use due to high demand for land, marked sprawl into formerly rural regions, changing built-up density, and burgeoning status as a key industrial hub. These changes are shaping its landscape and economy at a rapid pace.
Figure 1. Location of the study area.
3. Objectives of the study
The present study aims to analyze the following objectives: -
To analyze the land use land cover for the years 1991, 2001, 2011, and 2021.
To calculate the decadal land transformation in the study area.
To assess the pattern of urban sprawl using the Shannon entropy model with the help of road transport lines, concentric buffer zones, and directional zones.
4. Material and methods
The research work includes a combination of various techniques like LULC change detection, and evaluating urban growth using integrated geospatial model techniques. Several types of data are required for various measures obtained from various sources. The methods and materials have been divided into several sections as below:
4.1. Database
Satellite imagery data for land use land cover and urban sprawl analysis has been acquired from the United States Geological Survey (USGS) Earth Explorer website https://earthexplorer.usgs.gov for years 1991, 2001, 2011, and 2021 (Table ). The development plan (2021) of the Sonipat-Kundli multipurpose urban complex was utilized as the fundamental geographic reference for the designated study region as a base map, acquired from the Department of Town and Country Planning of Haryana. Area-specific demographic information is sourced from the District Census Handbook (DCH) published by the Census of India. Survey of India toposheet on a scale of 1:50,000 and Google Earth Pro with a spatial resolution of 1 m have been used for accuracy assessment purposes.
Table 1. Landsat data and their description
4.2. Methods for land use land cover (LULC) classification
The acquired images with minimum cloud cover for 1991, 2001, 2011, and 2021 were geometrically and radiometrically corrected first. The corrected spectral bands are stacked to obtain multi-band images for each year. Supervised classification with the Maximum Likelihood Classifier (MLC) algorithm method (Das & Angadi, Citation2021; Naikoo et al., Citation2020) in ERDAS Imagine, 16 software has been used for LULC classification. Supervised classification is a prominent technique in remote sensing and machine learning, facilitating the accurate categorization of pixels or objects within an image based on a predefined set of training samples. A classifier is trained using labeled data, where each sample is associated with a known class or category. The algorithm learns the spectral or spatial patterns associated with each class during the training phase and then applies this knowledge to classify new, unlabeled data. Five land use types namely built-up, agriculture, open land, vegetation, and water bodies have been identified and recommended by the National Remote Sensing Centre (NRSC) level 1 classification (NRSC, Citation2012).
4.2.1. Accuracy assessment
The accuracy assessment is a crucial step in evaluating the quality and reliability of land use land cover classification. The Kappa Coefficient is a statistic that measures the agreement between the map’s classification and the reference data. To ensure precise interpretability and identification, the minimum accuracy of a classified map should exceed 80 percent (Anderson, Citation1976). Several studies have previously employed techniques such as Kappa coefficient analysis, error matrices, and index-based methods to assess the accuracy of land use land cover (Das & Angadi, Citation2021; Naikoo et al., Citation2020; Shikary & Rudra, Citation2021). In the research, the Kappa coefficient technique is applied to assess the accuracy of LULC maps for the Sonipat-Kundli region. A total of 200 randomly chosen points were strategically selected to ensure a balanced representation of all LULC classes across the entire study area. Ground observations are conducted using the Google Earth Pro domain.
4.3. Assessment of land use transformation
The ERDAS Imagine software version 2016 provides a valuable toolkit for quantifying the change in land use in different periods. Once the classification is complete, change detection algorithms help to compare multiple image datasets and identify areas where land use transformation has occurred. Visualizing the results through thematic maps highlights the magnitude and location of land use changes. Thus, the transition matrix helps to quantify the change in land use.
4.4. Quantifying the dispersion of built-up areas through the Shannon entropy model
Shannon entropy measures the degree of spatial concentration or dispersion of geographical variables (Yeh & Li) among n zones. The formula is: -
Where,
-Xi is the land development, which equals the amount of built-up land divided by the total amount of land in ith zone
n is the total number of zones
The value of Entropy ranges from zero to log (n). If the distribution is maximally concentrated in one zone, the lowest value of zero will be obtained, conversely an evenly dispersed distribution among the zones will give a maximum value of log (n). The relative entropy can be used to scale the entropy value that ranges from 0 to 1. The higher values of entropy indicate sprawl. The halfway mark of log (n) is measured as a threshold value, therefore if the entropy values are beyond the threshold can be called a sprawling city. The relative entropy H′n can be measured to scale up the entropy value into ranges from 0 to 1. The relative entropy for n number of zones can be calculated with the formula: -
The value 0.5 is considered as a threshold value. The value is higher than the threshold considered sprawl. Hence, in this study Shannon entropy values are calculated using zones created with the help of road transport lines, concentric buffer zones, and directional zones and the description of various zones has been given below:
4.4.2. Creating distinct zones based on major roads, concentric buffer zones, and directional orientations
The road zones help to understand the role of transportation in urban growth as direct control over land use activities next to roads. The study area has been divided into 11 road zones considered the main national highway, state highways, and district roads. Firstly, Kml files of various roads are created in Google Earth Pro. Furthermore, Kml are converted to shapefiles, and then their projection is defined to UTM projected 43 N zone with the assistance of a conversion tool in ArcGIS 10.4. These 11 zones have been created with the help of road transport lines. Moreover, 8 concentric buffer zones have been generated around the Central Business District (CBD) of Sonipat city across a distance of 3 kilometers extending up to the study area’s boundary. Lastly, 8 directional zones were demarcated to analyze the directional growth of built-up areas taking CBD as a center point.
4.5. Built-up density computation
The built-up area for each zone is extracted through the mask feature in the ArcGIS 10.4 software and individually calculated the built-up area of each zone. Built-up density is calculated by dividing the built-up area of each zone by the total area of that zone i.e;
Built-up density of zone x =
Additionally, choropleth maps have been prepared using the data of zone-wise built-up density.
4.6. Rate of urban expansion (RUE)
The urban area has been divided into built-up and non-built-up areas. The built-up areas include complexes for residences, businesses, and industries, as well as paved and other infrastructure that is closely related to a built-up environment. After extracting the built-up area, the RUE for the specified periods was evaluated.
Where,
BUA = Built-up area
Where, (BUA)i+n and (BUA)i are the built-up area at a time i+n and i respectively, and n is the interval of the calculating period.
5. Results and discussion
5.1. Land use land cover distribution in Sonipat-Kundli urban agglomeration
The land use land cover is delineated into five distinct categories spanning over an area of 305.35 sq. km. within the Sonipat-Kundli urban agglomeration (Figure ) . The land use categories encompass built-up areas, agricultural land, vegetation cover, open spaces, and water bodies. The accuracy of the classified images was assessed using Google Earth Pro as good for the assessment of historic images and also to be useful in assessing the accuracy of classification (Bindajam et al., Citation2021). The accuracy assessment indicates an overall accuracy rate of 87.50 percent, 84.00 percent, 87.50 percent, and 90.91 percent along with corresponding Kappa statistics of 0.833, 0.800, 0.836, and 0.884 for the years 1991, 2001, 2011, and 2021 respectively. The user accuracy value lies from 82 percent to 89.1 percent from 1991 to 2021 and the producer accuracy lies from 86 percent to 92.72 percent from 1991 to 2021 (Table ). Therefore, it can be narrated that the accuracy of the classified images was authentic. The urban expansion of Sonipat City has notably contributed to the augmentation of built-up areas. Table reveals comprehensive statistics derived from various land use land cover groupings, while subsequent sections furnish a detailed description of the distribution patterns. The Sonipat city serves as the administrative hub within the Sonipat district of Haryana, while the neighboring Kundli is classified as a census town. Both these locales assume significant strategic importance due to the recommendations made by the National Capital Region Planning Board (NCRPB) for their combined developmental plan, given their proximity to Delhi, the national capital.
Figure 2. Land use land cover of Sonipat-Kundli urban agglomeration, 1991–2021.
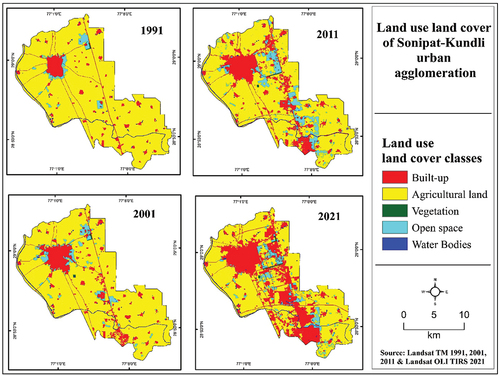
Table 2. Accuracy assessment for LULC, 1991–2021
Table 3. Land use land cover distribution
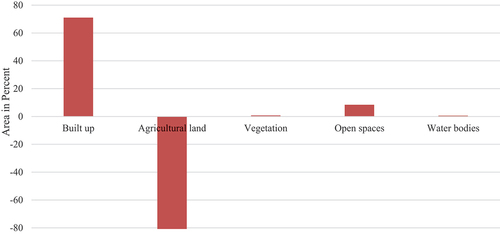
The Haryana state government approved the developmental plan in 2003 for the Sonipat-Kundli urban complex recognizing its substantial growth potential. Over three decades, the region has experienced a predominant urban expansion of built-up area accounting for 92.98 sq. km. in 2021 which was 21.96 sq. km. in 1991, 36.58 sq. km. in 2001 and 56.84 sq. km. in 2011 (Table ). Notably, the urban expansion had a pronounced adverse impact on the agricultural sector in the immediate vicinity. Figure highlights both the expansion and reduction of different land use categories. Furthermore, a holistic overview of the statistical attributes associated with these land use patterns (Figure ) . In the year 1991, the agricultural area encompassed 270.78 sq. km. exhibited a discernible reduction, dwindling to 189.96 sq. km. in 2021 (Table ). The influence on the land use category of natural vegetation was relatively subtle, primarily because of the inherently sparse distribution of such vegetation in the region. Over this period, the land designated as open spaces displayed considerable fluctuations. During the initial two decades, there was an incremental expansion of open spaces (Figure ); however, the trend reversed, culminating in a reduction to 16.52 sq. km. in 2021, down from 25.16 sq. km. in 2011(Table ). It is noteworthy that the region grapples with a paucity of natural water bodies or reservoirs. Notably, the western branch of the Yamuna Canal serving Delhi is situated on the western periphery of the study area. Drain numbers 6 and 8, along with village ponds, contribute to the land use classification of water bodies. Throughout the observed three-decade period, the proportion of land designated as water bodies has remained relatively constant.
Figure 3. Land use land cover (Sq. km.), 1991–2021.
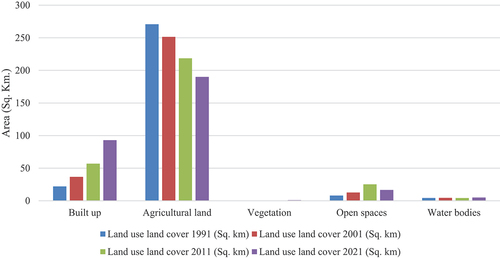
Figure 4. Gain and loss of area (percentage), 1991–2021.
5.2. Land use land cover change
The entire region has been systematically partitioned into 11 distinct zones based on major road networks and planned sectors to give a comprehensive overview of land use (Figure ). Table represents the distribution of sectors according to their designated land use and Sonipat Municipal Corporation along with its outgrowth, Kundli census town and all 59 villages (Figure ). The land use land cover changes of the Sonipat-Kundli urban agglomeration are discussed below:
Figure 5. Distribution of road zones and sectors.
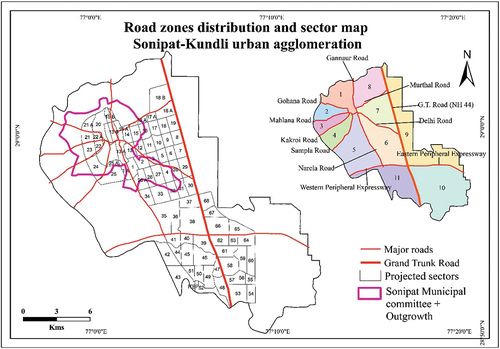
Figure 6. Distribution of revenue villages.
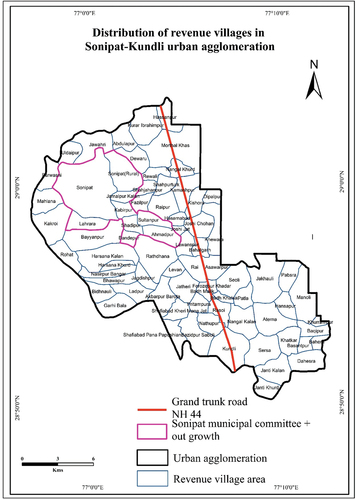
Table 4. Sector developed under different land use categories
5.2.1. Extension of built-up area
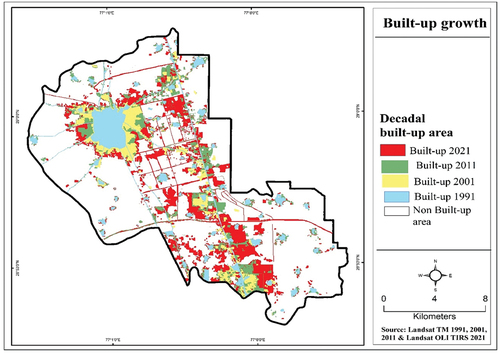
The built-up area began to grow significantly after the completion of the Sonipat-Kundli Multifunctional Urban Complex Development Plan in 2003. A total of 68 sectors have been established in the urban agglomeration. Kundli was classified as a village in the census years 1991 and 2001, its proximity to Delhi and NH-44 makes it a perspective location for urban development. It was declared a census town in 2011 with a total population of 21,633 persons. The built-up area in the whole complex was 21.96 sq km. in 1991 which grew to 92.98 sq. km. in 2021 (Table ). According to the development plan, Sonipat city must expand towards NH-44 and Kundli town. Zone 7 contains residential sectors and new residential sectors lie in the east of old Sonipat city so that remains connected to the old city region.
The demographical behavior of people switching from a joint family to a nuclear family is one of the reasons that results in demand for new household formation (Chadchan & Shankar, Citation2012). Subsequently, this shift in behavior created a bulk demand for housing and residential areas have a larger impact on the expansion of a city. The sector plan of the city has a resemblance to the planned city Chandigarh where roads intersect each other at 90° angles as the framework provides maximum accessibility. There are various villages in residential sectors like Rewali and Shahpurturk village in Sector 18; Raipur in Sector 9; Garhi Shahjahanpur in Sector 10 and Fazilpur in Sector 11 that exhibit a mixed culture of high-rise private townships as well village culture in these sectors. Fazilpur village was termed a census town in 2011 and also grew in population. These residential sectors were established on nearby villages’ agricultural land and paved the way for urbanized rural settlements. The comparable trend of urban expansion observed in other developing cities of Haryana, such as Gurugram (Chauhan & Kumar, Citation2020), and Faridabad (S. Kumar et al., Citation2022), involves the transformation of agricultural land from nearby villages into planned developed zones.
There were four villages namely Lahrara, Shadipur, Kabirpur, and Bandepur became outgrowths of Sonipat city, and four nearby villages such as Jamalpur Kalan, Sultanpur, Ahmadpur, and Sonipat-Rural completely amalgamated with Sonipat Municipal Committee in 2011. Sectors 28, 29, 30, and 31 are designated for industrial land use and have proximity to NH-44 and State Highway-11 (Delhi Road). Moreover, sector 32 has been approved for commercial use, but it has not seen significant development to date.
Sector 38, a major industrial area is well connected to NH-44, and the eastern and western peripheral expressway established by HSIIDC and Rai Industrial estate lies in this sector. The sectors 65, 66, 67, and 68 are earmarked for educational land use. The major universities established here such as SRM University, Motilal Nehru School of Sports, Ashoka University, Dr. B.R. Ambedkar National Law University, and IIT Delhi-Sonipat campus.
There is a clear dominance of built-up areas upon agricultural terrain in the year 2021. The smaller scattered settlements and villages have grown and have emerged as a large agglomerated unit in the study area. The map of land use land cover shows a compact pattern of built-up area between these two towns in 2021 (Figure ). The sectors 53,54,55,56 and 57 are fully developed and considered industrial sectors. Also, sectors 58, 59, 60, 61, 62, 63, and 64 are reserved for the residential purpose in Kundli. A maximum number of new urban units were added in the decade 2011–2021 (Figure ). The Gohana to Sonipat railway line was laid out in 2013. The Sonipat bye pass road has been constructed to connect Gohana Road, Ganaur Road, and NH-44 in the recent decade.
Figure 7. Growth of built-up area, 1991–2021.
5.2.2. Loss of agricultural land
The primary means of making land available for urban development and other infrastructural needs is through the acquisition of agriculture from farmers by government agencies and private developers. Moreover, the government can relax the provision for areas lying in agricultural zones to be used for other than agricultural use in the development plan 2021. One common scenario could be seen in land use studies of various cities that it is always the agricultural land that has to be victimized for the expansion of urban built-up areas (Fazal, Citation2005).
In the Sonipat-Kundli agglomeration unit, agricultural land which was 270.78 sq. km. in 1991 reduced to 189.96 sq. km. in 2021. The largest reduction in the period 2011–2021 i.e. 28.62 sq. km. (Table ) amounts to −13.09 percent of land converted to other land use and the loss is increasing over time. The total cultivable land has been declining in comparison to the increment in a built-up area with the population growth and expansion of the city. Parallelly, there is a need for more food production from scarce soil resources to meet the demands of an ever-growing population. Hence, this is a paradoxical situation because, at the same time, vast tracts of land are being converted from agricultural land use to other than agricultural use.
5.2.3. Stagnant vegetation cover
The urban complex lacked any designated or conserved forests. Those places with a significant amount of naturally occurring or artificially planted trees and greenery beside highways are considered to be vegetated zones. In the vicinity of NH-44, there were a few spots of greenery in industrial sector 18-A. The natural vegetation has remained in the range of 0.23 to 0.98 sq. km. throughout the study period of 30 years (Table ).
5.2.4. Increase in vacant land/open spaces
The spread of vacant lands surrounding towns stands out as a distinctive facet of urbanization in the country. These are areas of land that remain unused or under-utilized and are commonly referred to as ‘vacant land’. Typically, the phenomenon occurs during the transition of land use on the peripheries of cities, where agricultural land is initially abandoned or left vacant to pave the way for forthcoming urban development. Vacant land often arises as a result of speculative land ownership driven by the prevailing materialistic mindset in rural areas. The land remains vacant until the farmer receives the desired price. Farmers who are affected by urban forces cease farming on agricultural lands and offer their land for urban use (Ali & Fazal, Citation2022).
There was a significant increase in vacant land from 1991 to 2021. It expanded from 8.07 sq. km. in 1991 to 12.62 sq. km. in 2001 with a 56.38 percent increment in one decade and further to 25.16 sq. km in 2011 with a maximum increase of 99.37 percent (Table ). Approximately, 35 percent of the open or vacant land was utilized for various residential and industrial purposes in 2021. Numerous land use sectors were carved out from the agricultural land in the development plan of Sonipat-Kundli. This was the infant stage of the expansion of the city and the process of urbanization started in stages; firstly, agricultural land was converted to fallow land/open spaces, and then concrete buildings occupied these open spaces. These transformations radiate outward from the city core and that too first along the roads. Thereafter, interior sites are transformed. The stages of transformation reflect the demand for land, its value, availability, and suitability.
5.2.5. Constant water bodies area
The proportion of water bodies has remained constant throughout the decades. LULC maps reveal that the area of water bodies was 4.31 sq km in 1991 and is still in the vicinity and will become 4.91 sq. km. in 2021 (Table ).
5.3. Land transformation in Sonipat-kundli urban agglomeration
Land undergoes continuous transformation as a result of various natural and human-induced processes. However, land transformation driven by human activities is considered a prominent factor in land use change. Detecting and understanding the change often revolves around identifying the specific shifts from one land use type to another. The data reveals the land use classes that exhibit relative stability over time, shedding light on both favorable and unfavorable changes. Leveraging the information constitutes a fundamental step in the decision-making process for effective land management (Amin & Fazal, Citation2012).
In addition to growing urban land beyond its original dimensions during the study period, Sonipat City experienced significant land exchanges among different land uses. These modifications are the result of urbanization which has raised demand for land uses such as residential, commercial, industrial, etc. The need for land, together with site appeal, functional convenience, functional management, and the land value of that particular location, all have an impact on the rate and direction of urban land transformation. Land use transformation is more pronounced in the south-east direction direction of Sonipat city towards Kundli. Tables , and 7 depict the decadal transformation of land use from 1991 to 2021. Table reveals the overall scenario in a total of three decades from 1991 to 2021 and the map of the transformation of land use from one class to another (Figure ).
Figure 8. Land use land cover transformation from 1991–2021.
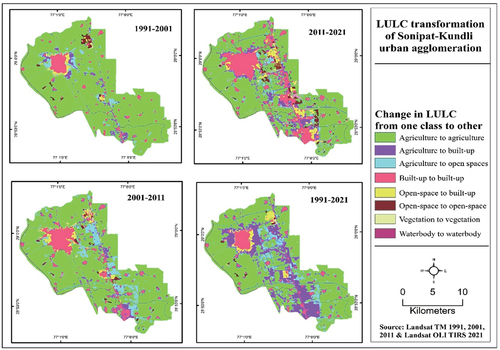
Table 5. Land use land cover change matrix, 1991–2001
Table 6. Land use land cover change matrix, 2001–2011
5.3.1. Land use land cover change in decade 1991–2001
Land transformation witnessed from 1991 to 2001 majorly occurred in agricultural use where the agricultural fields lying on the periphery of the Sonipat city, have been used to develop residential sectors. New residential sectors 12,13, 14, 15, 23, and 24 were part of the drive and sprouted on the field of villages Sonipat rural, Kabirpur, Shadipur, Bandipur, and Lahrara respectively. Police line Sonipat has been established in the western part of the city on Gohana Road along with administrative offices opposite to police lines. Agricultural land of 10.22 sq. km. converted to build-up land and 4.49 sq. km. area from open spaces also contributed to built-up land and thus created a total 36.59 sq. km. area in built-up land use in 2001 from 21.96 sq. km in 1991 (Table ). Another important change could be seen in the open land use class as it takes 9.03 sq. km. of area from agricultural land and there was a net increase of 12.63 sq. km. area in open spaces. The process depicts the stages of land conversion from agricultural to open spaces and then to built-up areas. Vegetation and water bodies area remain approximately the same over the period.
5.3.2. Land use land cover change in decade 2001–2011
In the decade 2001 to 2011, more land has been taken from agriculture and open spaces land use for urban area which amount to 14.74 sq. km. and 7.35 sq. km. respectively. This change increased the urban area from 36.58 sq. km. in 2001 to 56.84 sq. km. in 2011 (Table ). Sonipat’s property boom began in the mid-2000s, with real estate companies such as Ansal API, TDI, Parker, Tulip Infratech, and Eldeco launching residential and commercial projects along the Highway. Rai Industrial Estate flourished after acquiring land from the fields of villages Jatheri, Rai, and Badh Malik. Kundli Industrial Area, developed by HSIIDC, with over 1,600 functional units, manufactures everything from automotive components to garments to pharmaceuticals (Hindustan Times). 2026 acres of land of Asawarpur and other villages were acquired in 2005 to develop the education city which is around 10 km from the Kundli industrial Area Known by Rajiv Gandhi Education City that currently has five functional campuses: Ashoka University, Dr. BR Ambedkar National Law University, World University of Design, SRM University, and IIT Delhi (Sonipat Campus). Deenbandhu Chhotu Ram University of Science and Technology (DCRUST) was also been established in 2006 lying in sector 18 B in the village of Murthal. Also, O.P. Jindal Global, a private university spread over 80 acres was instituted in 2009 by acquiring land from the village Jagdishpur lies in the south of Sonipat city. Similar patterns in the land use studies of Saharanpur and Aligarh cities show that vacant land grows as urbanization occurs and there is a dearth of land for construction. Landowners who had previously used their property for agriculture now offered it for development, which resulted in a significant conversion of agricultural land into unoccupied land. The demand increases land values (Ali & Fazal, Citation2022).
5.3.3. Land use land cover change in decade 2011–2021
Heavy losses to agricultural land could be seen in the later decade from 2011 to 2021, as 27.40 sq. km. of agricultural land was directly converted to urban built-up land and 12.28 sq. km. of area from open spaces also contributed to urban built-up and thus these two important factors bring the current urban area of 92.98 sq. km. in 2021 (Table ). A new railway line has been laid in 2013 connecting Sonipat to Gohana. As Delhi is getting saturated and property prices going out of the reach of the common man, potential homebuyers are prompted to look at options outside the city limits. Hence, Kundli has seen tremendous real estate growth over the last decade. It is Strategically placed on the Delhi border and lies in proximity to North and North-West Delhi. The region has garnered renewed interest from potential homebuyers and investors post the completion of the Kundli-Manesar-Palwal (KMP) Expressway. Existing industrial zones—Kundli Industrial Area and Rai Industrial Area, are expanding the industrial and business base of the region and are generating significant job opportunities.
Table 7. Land use land cover change matrix, 2011–2021
5.3.4. Land use land cover change in total from 1991–2021
A significant proportion of agricultural land was transformed into urban land use which amounts to a total of 64.43 sq. km of land (Table ). A considerable amount of agricultural land of 15.22 sq. km. also got converted to open spaces which are most of the speculative land. Urban built-up land which was only 21.96 sq. km. in 1991 shoots up to 92.98 sq. km. in 2021.
Table 8. Land use land cover change matrix, 1991–2021
In the last three decades, Sonipat and Kundli have grown into major industrial hubs in Haryana consisting of many large-scale and small-scale industries. The micro and small enterprises sector includes the stainless-steel cluster in Kundli operating with 72 units with 800 crore turnover and approximately 200 crores of export and printers and the packagers cluster in Rai includes 110 functional units with 165 crore turnovers. The infrastructural developments taking place in Kundli are poised to convert the region into another Gurgaon. Real estate players like TDI, Parsvnath Developers, Ansal Properties, Omaxe, Parker, Raheja Malls, Eldeco County, Anant Raj, Tulip Infrastructure, Collage Group, Eros Group, AJS Builders, Divine, Bigjos, Vardhman, Jindal Greens, etc, are already coming up with mega project here.
5.4. Built-up density and dispersion of built-up area through Shannon’s Entropy in road zones
There are direct proportional of road transport and urban growth. The zones 6 and 7 exhibit the highest density among all zones registered at 52.37 percent and 48.72 percent in 2021 (Figure and Table ). Zone 7 comprises an exactly planned residential area, encompassing residential sectors from 5 to 19. Notably, the sectors 7, 8, and 19 exhibit a higher population density compared to the other sectors in the same zone due to their proximity to NH-44. There is notable Sector 19 for hosting a range of group housing projects, including ELDECO County, TDI Espania Royal, OMAXE City, Apex Green, and others. The zone is strategically situated between NH-44, Murthal Road, and Delhi Road, making it a prime location with excellent connectivity prospects.
Figure 9. Built-up area according to road zones.
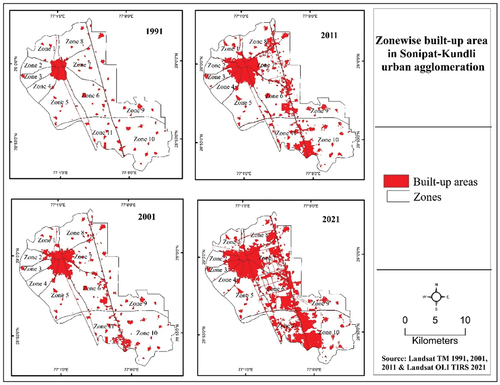
Table 9. Built-up Density in various road zones
Zone 6 primarily functions as an industrial zone and boasts strategic connectivity via NH-44, the newly constructed Western and Eastern Peripheral Expressway, and Narela Road. These three key roadways hold strategic significance by facilitating the transportation of raw materials and the sale of goods to Delhi, Gurgaon, Faridabad, Northern Haryana, and regions extending into Uttar Pradesh. Figure shows the built-up density according to the road zone in the study area from the period 1991–2021. Zone 9 exhibits a lower built-up density due to its location opposite the National Highway, facing the city of Sonipat. Consequently, the zone comprises only four planned sectors, primarily designated for educational infrastructure. Built-up density is influenced by land use patterns and the presence of infrastructure in the area. Higher built-up densities can lead to more efficient land utilization, reduced infrastructure expenses, and improved accessibility to amenities and services, all of which play a pivotal role in enhancing urban sustainability.
Figure 10. Built-up density according to road zones.
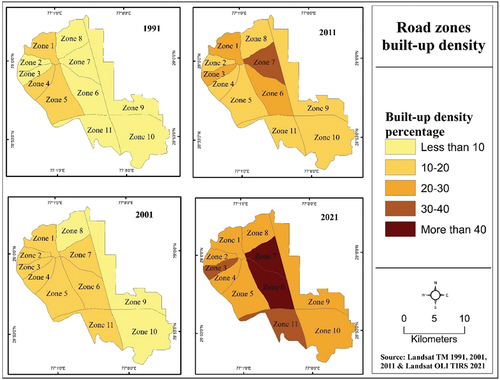
The Shannon’s Entropy measures the distribution of built-up area for the total zones. The Entropy values are calculated based on road zones. From the period 1991 to 2011, relative entropy shows an increasing trend with values of 0.97142 and 0.985455 respectively indicating sprawling in the area (Table ). The existing values already point towards a notable degree of dispersion. However, in the subsequent year (2021), there is a slight decrease in the entropy value, suggesting a concentration of built-up areas in specific zones. The shift signifies that more newly constructed structures are emerging in zones 6, 7, and 11, primarily due to their enhanced road connectivity from all directions. Zone 11, situated adjacent to the Delhi border, has enjoyed the advantage of its proximity to the Narela industrial area in Delhi. The zone encompasses sectors 39 to 53, the majority of which are dedicated to industrial activities. The rapid growth of industrial units within these sectors has led to an increase in built-up structures and subsequently, a greater concentration of built-up units. The pattern of urbanization in the area is unique. Typically, considering the growth of a single city, it tends to expand within its vicinity and around its periphery. However, in the case of Sonipat and Kundli, they are evolving as twin cities. Despite Sonipat being a larger city and Kundli being classified as a census town according to the Census of India, 2011. Their current development trajectories are causing them to draw closer to each other, with new urban growth filling the gap between them.
Table 10. Entropy value in various road zones
The expansion of the built-up area is primarily driven by growth in both the industrial and residential sectors. The industrial policy of Haryana, which promotes the establishment of industrial estates, is contributing significantly to opportunities in the industrial sector, further fueling the expansion.
5.5. Built-up density and entropy values based on concentric buffer zones
To analyze the distribution of the built-up area from the city’s core towards its periphery, built-up density was calculated using concentric buffer zones. The concentric buffer zones around the Central Business District (CBD), provide valuable insights into the urban growth pattern and its structure. A total of six buffer zones were created, each separated by 3 km. gap (Figure ) . Table presents statistical data for built-up density in these concentric buffer zones, and zone-wise density trends from 1991 to 2021 (Figure ). Notably, built-up density exhibits high values within the CBD area, particularly within the 3 km. buffer zone. As one moves further away from the CBD, density gradually decreases, reaching 21.50 percent in the 9 km. buffer zone, which represents the peripheral zone of Sonipat City.
Figure 11. Built-up area according to concentric buffer zones.
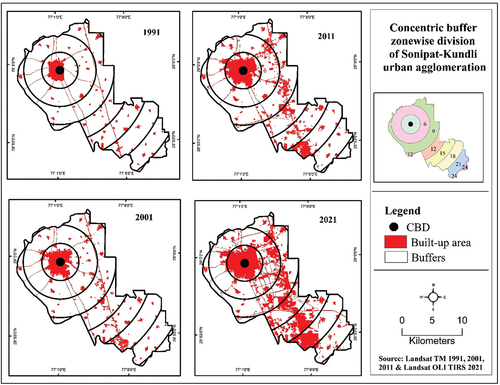
Figure 12. Built-up density in various concentric buffer zones.
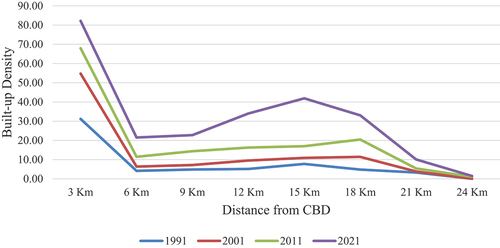
Table 11. Built-up density in various buffer zones
The area situated between the towns of Sonipat and Kundli has been undergoing significant changes in land use, characterized by infill-type land development. Notably, within the 15 km. buffer zone, there is a notable increase in built-up density, reaching 41.86 percent, representing a secondary peak in high density (Figure ). The particular scenario is indicative of leapfrog development sprawl. The emergence of the secondary peak can be attributed to the establishment of an industrial area in Kundli town and its proximity to neighboring villages, which also have access to the industrial area in Narela within the Delhi National Capital Territory. The Leapfrog sprawl is characterized by gaps in open spaces or less developed areas between two high-density built-up regions. The buffer zone of 15 km. encompasses several villages, including Safiabad Pana Paposian, Bajidpur Saboli, Nathupur, Rasoi, and Badh Khalsa. These villages are surrounded by a significant number of industries around them.
Table provides valuable insights into entropy values, specifically focusing on buffer zones. Among the zones, Zone 1, which spans a distance of 3 kilometers, and Zone 5, covering a distance of 15 kilometers, stand out as significant buffer areas. Analyzing the Entropy values within these zones sheds light on the evolving infill development occurring between them. For the year 2021, the entropy value for the 3 km buffer zone is particularly noteworthy, registered at 0.1590. The value ranks highest among all the buffer zones, primarily because the zone encompasses the Central Business District (CBD) of Sonipat and densely populated residential and commercial areas. There is no surprise that such a concentrated urban environment yields a high entropy value.
Table 12. Entropy values in various buffer zones
On the other hand, buffer zone 5 exhibits an Entropy value of 0.1307, the second-highest in the dataset. The value indicates a remarkable degree of sprawl within the buffer zone, situated between Sonipat city and Kundli town. Historically characterized by vast expanses of agricultural land, recent years have witnessed a surge in industrial development in the area. Consequently, a notable heterogeneity in land use patterns has emerged, contributing to increased dispersion of built-up land. The phenomenon accounts for the comparatively high entropy value in buffer zone 5. When considering relative Entropy values, an intriguing mixed trend emerges. The Entropy value in 2001 was 0.7292, followed by 0.8064 in 2011, and culminating in 0.8668 for the year 2021, these figures collectively suggest a trend toward dispersed development. Overall, these values are on the rise. The dispersion trend underscores the evolving landscape and land use patterns within the region over the past three decades.
5.6. Built-up density and dispersion of built-up area through Shannon’s Entropy in cardinal direction zones
provides an overview of the built-up density across the various directional zones. Notably, the South-east and North-east zones exhibit the highest built-up densities, registered at 39.41 percent and 39.38 percent respectively across eight directional zones (Figure ) . Moreover, a radar chart shows the built-up density within these zones over 30 years (Figure ). The South-east direction primarily due to the significant influence of industrial areas that have driven an expansion in built-up zones. It’s worth noting that these industrial facilities are not concentrated in a single location but rather dispersed across the agricultural fields within the South-east zone. The process has led to a heightened fragmentation of agricultural fields, subsequently diminishing both their landscape uniformity and productivity. Notably, the phenomenon affects several villages, including Akbarpur Barota, Safiabad Pana Paposian, and Nathupur, all of which are situated within the zone. In 2021, the relative Entropy touched its peak at 0.1292, signifying a state of dispersed development. Furthermore, two prominent educational institutions i.e. O.P. Jindal Global University and Mahavir Swami Institute within the zone.
Figure 13. Direction wise zones of Sonipat-Kundli urban agglomeration.
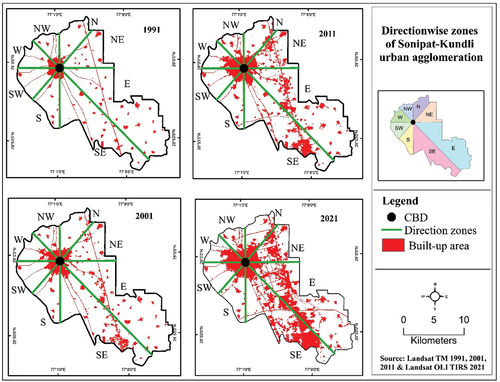
Figure 14. Built-up density according to various directional zones.
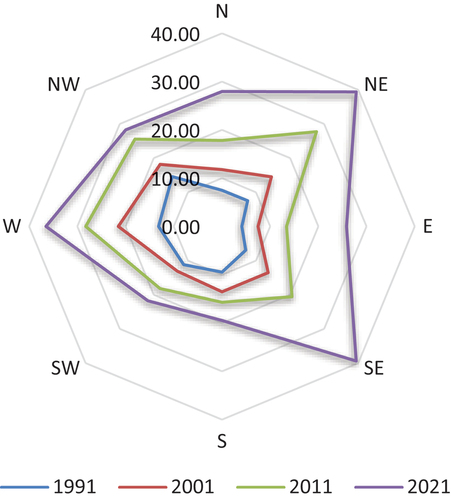
Table 13. Built-up density in various directional zones
The North-east zone accommodates extensive and heavy industrial areas and it is home to Deen Bandhu Chhotu Ram University of Science and Technology (DCRUST) (Hasnine & Rukhsana). There are numerous residential sectors 14, 15, 16, 17, 18, and 19 within the zone. Here, residential units are dispersed across various patches of built-up areas. The Entropy value of 0.1291 signifies a sprawling development pattern in 2021. Furthermore, within these planned urbanized residential sectors, there are several urban villages i.e. Shahpur Turk and Rewali in Sector 18 as well as Nangal Khurd in Sector 19. Overall relative Entropy, there is an observable upward trend, indicative of a prevailing dispersed development pattern in the area (Table ).
Table 14. Entropy value in various directional zones
5.7. Rate of Urban Expansion (RUE)
The city has been growing in a horizontal direction with an annual growth rate of 6 percent approximately during the study periods (Table ). An urban area is developed or encroachment on productive agricultural land that was appropriate for various cash and food crops. There is a need for vertical expansion for residential and commercial purposes so that agriculture can sustain along growing population’s basic needs.
Table 15. Rate of urban expansion (RUE)
6. Conclusion
The study provides valuable insights into the changing landscape dynamics driven by expanding urbanization. The period following India’s economic liberalization in 1991 marked a significant shift in economic and industrial landscapes. Economic reforms opened up the market to private and foreign investors, particularly in the real estate sector. Sonipat and Kundli, situated near the national capital, replicate the urban development model seen in Delhi’s NCT, with the Sonipat-Kundli urban complex emerging as a result of NCRPB initiatives. Over the past three decades, Sonipat has experienced considerable urban expansion, particularly in the eastern and south-eastern directions that are closer to Delhi and primarily fueled by the conversion of agricultural land. This growth has transformed Sonipat into a vibrant economic center, spurring regional infrastructure development and accelerating urbanization. Notably, residential and vacant land developments have proliferated along major highways, particularly NH-44. Kundli has also seen significant growth, becoming a hub for real estate investment, infrastructure, and industrial development, spurred by the establishment of prestigious institutions like the National Institute of Food Technology Entrepreneurship and Management (NIFTEM) and commercial complexes which are at the intersection of NH 44 and Eastern and Western peripheral expressways. A multitude of industrial units have clustered along the national highway in Kundli, catalyzing the construction of additional apartments and residential communities in the vicinity.
The expansion of urban growth was assessed through the analysis of built-up density and Shannon’s Entropy calculation of built-up areas. The analysis revealed dispersed development with low built-up density values, indicating an initial phase of leapfrog sprawl. The presence of vacant land between Sonipat and Kundli suggests further potential for expansion, albeit with caution to balance urban growth and agricultural land preservation. Outlying villages were gradually merging with municipal limits, while villages near the Delhi border saw significant industrial growth, resulting in the conversion of agricultural land. Horizontal urban expansion is more prominent in this area but to promote sustainability, these areas should change their approach from linear expansion to a more compact urban form, fostering agglomeration economies and improving infrastructure through effective urban planning, thus mitigating informal and speculative developments.
7. Recommendations
The land use change analysis needs to be quantified at particular intervals of time for sustainable resource management practice because land use transformation is high in the Sonipat and Kundli areas due to real estate and industrial needs.
There should be more focus given on the accessibility of services while planning for the extension of a city. For example, in the current plan residential area is planned adjacent to the National Highway, but commercial and industrial use will be more suitable at this site due to location factors.
Open spaces between Sonipat City and Kundli should be developed in a continuous manner adjacent to developed sectors which will save municipal resources.
Land is a limited resource, new development should be planned compactly in a vertical direction instead of a horizontal direction.
A railway network should be developed in the vicinity of industrial areas to support cheap transportation for industrial goods.
Further studies to understand the minute intricacies of urban growth in this area need to be taken up for future prediction of growth which would help urban planners to interpret changing urban landscape. In essence, the outcomes of this study signify greater importance to sustainable planning and policies to better manage prospective urbanization in the area.
Disclosure statement
No potential conflict of interest was reported by the author(s).
Data availability statement
The study is based on open-source satellite data (Landsat satellite data), which have been downloaded from the United States Geological Survey (https://www.usgs.gov/) (Table ). Other information related to the study area was derived from the city headquarters and the Census of India.
References
- Ahuja, K., Kumari, M., & Somvanshi, S. (2022). Urban growth trend analysis using Shannon entropy approach—a case study of Dehradun City of Uttarakhand, India. Geospatial Technology for Landscape and Environmental Management: Sustainable Assessment and Planning, 301–22.
- Ali, M. K., & Fazal, S. (2022). The realities of urban land use planning in India: Case study of Aligarh City. Urban India, 42(1), 88–112.
- Amin, A., & Fazal, S. (2012). Land transformation analysis using remote sensing and GIS techniques (a case study). Journal of Geographic Information System, 04(3), 229–236. https://doi.org/10.4236/jgis.2012.43027
- Anderson, J. R. (1976). A land use and land cover classification system for use with remote sensor data (Vol. 964). US Government Printing Office.
- Angel, S., Sheppard, S., Civco, D. L., Buckley, R., Chabaeva, A., Gitlin, L., Kraley, A., Parent, J., & Perlin, M. (2005). The dynamics of global urban expansion. World Bank, Transport and Urban Development Department.
- Azabdaftari, A., & Sunar, F. (2022). District-based urban expansion monitoring using multitemporal satellite data: Application in two megacities. Environmental Monitoring and Assessment, 194(5), 335. https://doi.org/10.1007/s10661-022-09884-y
- Barnes, K. B., Morgan, J. M., III, Roberge, M. C., & Lowe, S. (2001). Sprawl development: Its patterns, consequences, and measurement (p. 24). Towson University. https://www.researchgate.net/publication/251645410.
- Bhatta, B., Saraswati, S., & Bandyopadhyay, D. (2010). Urban sprawl measurement from remote sensing data. Applied Geography, 30(4), 731–740. https://doi.org/10.1016/j.apgeog.2010.02.002
- Bindajam, A. A., Mallick, J., Balha, A., Al Qadhi, S., Shohan, A. A. A., Singh, C. K., & Rahman, A. (2021). Characterizing the urban decadal expansion and its morphology using integrated spatial approaches in a semi-arid mountainous environment, Saudi Arabia. Polish Journal of Environmental Studies, 30(5), 4437–4451. https://doi.org/10.15244/pjoes/133033
- Cabral, P., Augusto, G., Tewolde, M., & Araya, Y. (2013). Entropy in urban systems. Entropy, 15(12), 5223–5236. https://doi.org/10.3390/e15125223
- Chadchan, J., & Shankar, R. (2012). An analysis of urban growth trends in the post-economic reforms period in India. International Journal of Sustainable Built Environment, 1(1), 36–49. https://doi.org/10.1016/j.ijsbe.2012.05.001
- Chaudhuri, G., Mainali, K. P., & Mishra, N. B. (2022). Analyzing the dynamics of urbanization in Delhi National Capital Region in India using satellite image time-series analysis. Environment and Planning B: Urban Analytics and City Science, 49(1), 368–384. https://doi.org/10.1177/23998083211007868
- Chauhan, S., & Kumar, S. (2020). Urban land use/land cover changes in Gurugram district, Haryana using Landsat images. Annals of the National Association of Geographers, India, 40(2), 388–398. https://doi.org/10.32381/ATNAGI.2020.40.02.12
- Chettry, V., & Surawar, M. (2020). Urban sprawl assessment in Raipur and Bhubaneswar urban agglomerations from 1991 to 2018 using geoinformatics. Arabian Journal of Geosciences, 13(14), 667. https://doi.org/10.1007/s12517-020-05693-0
- Das, S., & Angadi, D. P. (2021). Assessment of urban sprawl using landscape metrics and Shannon’s entropy model approach in town level of Barrackpore sub-divisional region, India. Modeling Earth Systems and Environment, 7(2), 1071–1095. https://doi.org/10.1007/s40808-020-00990-9
- Deka, J., Tripathi, O. P., & Khan, M. L. (2011). Urban growth trend analysis using Shannon Entropy approach: A case study in North-East India. International Journal of Geomatics & Geosciences, 2(4), 1062–1068.
- Dhanaraj, K., & Angadi, D. P. (2022). Land use land cover mapping and monitoring urban growth using remote sensing and GIS techniques in Mangaluru, India. Geo Journal, 87(2), 1133–1159. https://doi.org/10.1007/s10708-020-10302-4
- Dutta, V. (2012). Land use dynamics and peri-urban growth characteristics: Reflections on master plan and urban suitability from a sprawling north Indian city. Environment and Urbanization ASIA, 3(2), 277–301. https://doi.org/10.1177/0975425312473226
- Dutta, D., Rahman, A., Paul, S., & Kundu, A. (2020). Estimating urban growth in peri-urban areas and its interrelationships with built-up density using earth observation datasets. The Annals of Regional Science, 65(1), 67–82. https://doi.org/10.1007/s00168-020-00974-8
- Effat, H. A., & El Shobaky, M. A. (2015). Modeling and mapping of urban sprawl pattern in Cairo using multi-temporal Landsat images, and Shannon’s entropy. Advances in Remote Sensing, 4(4), 303. https://doi.org/10.4236/ars.2015.44025
- Fazal, S. (2000). Urban expansion and loss of agricultural land-a GIS-based study of Saharanpur City, India. Environment and Urbanization, 12(2), 133–149. https://doi.org/10.1177/095624780001200211
- Fazal, S. (2005). Urban expansion: A threat to cropland. A GIS-based study of Aligarh City, India. Trends in Agriculture and Soil Pollution Research, 191–204.
- Hasnine, M., & Rukhsana. (2020). An analysis of urban sprawl and prediction of future urban town in an urban area of developing nation: A case study in India. The Journal of the Indian Society of Remote Sensing, 48(6), 909–920. https://doi.org/10.1007/s12524-020-01123-6
- Haynes, K. E., & Storbeck, J. E. (1978). The entropy paradox and the distribution of urban population. Socio-Economic Planning Sciences, 12(1), 1–6. https://doi.org/10.1016/0038-0121(78)90016-2
- Jain, M., Taubenböck, H., & Namperumal, S. (2011). Seamless urbanisation and knotted city growth: Delhi metropolitan region. Proceedings of the REAL CORP 2011, Essen, Germany (pp. 853–862). https://elib.dlr.de/76310/
- Jha, R., Singh, V. P., & Vatsa, V. (2008). Analysis of urban development of Haridwar, India, using entropy approach. KSCE Journal of Civil Engineering, 12(4), 281–288. https://doi.org/10.1007/s12205-008-0281-z
- Kumar, S., Ghosh, S., & Singh, S. (2022). Polycentric urban growth and identification of urban hot spots in Faridabad, the million-plus metropolitan city of Haryana, India: A zonal assessment using spatial metrics and GIS. Environment, Development and Sustainability, 24(6), 8246–8286. https://doi.org/10.1007/s10668-021-01782-6
- Kumar, A., & Kumar, A. (2017). Analyzing urban sprawl and land consumption patterns in major capital cities in the Himalayan region using geoinformatics. Applied Geography, 89, 112–123. https://doi.org/10.1016/j.apgeog.2017.10.010
- Kumar, S., & Sangwan, R. S. (2013). Urban growth, land use changes and its impact on Cityscape in Sonipat city using remote sensing and GIS techniques, Haryana, India. International Journal of Science, Engineering and Computer Technology, 3(3/4), 88–91.
- Kumar, S., & Sharma, M. (2007). Efficient urban planning: A case study of Sonipat city in Haryana. Journal of Global Research & Analysis, 2(1), 190–196.
- Naikoo, M. W., Rihan, M., & Ishtiaque, M. (2020). Analyses of land use land cover (LULC) change and built-up expansion in the suburb of a metropolitan city: Spatio-temporal analysis of Delhi NCR using Landsat datasets. Journal of Urban Management, 9(3), 347–359. https://doi.org/10.1016/j.jum.2020.05.004
- Naikoo, M. W., Rihan, M., Shahfahad, P. A. H., Mallick, S., Talukdar, J., Mallick, J., Ishtiaq, M., & Rahman, A. (2022). Analysis of peri-urban land use/land cover change and its drivers using geospatial techniques and geographically weighted regression. Environmental Science and Pollution Research, 30(55), 1–19. https://doi.org/10.1007/s11356-022-18853-4
- NRSC. (2012). Manual of National Land Use/Land Cover Mapping (Second Cycle) Using Multi‐temporal Satellite Data. Department of Space.
- Paarcha, A., Maithani, S., Husain, M., Suhanee, N., & Azad, R. K. (2023). Monitoring urban sprawl using geo-spatial technology: A case study of Kanpur City, India. In A. Rahman, S. S. Roy, S. Talukdar & S. (Eds.), Advancements in Urban Environmental Studies: GIScience and Geo-environmental Modelling. Springer. https://doi.org/10.1007/978-3-031-21587-2_6
- Pramanik, S., Butsch, C., & Punia, M. (2021). Post-liberal urban dynamics in India–The case of Gurugram, the ‘Millennium City’. Remote Sensing Applications: Society & Environment, 22, 100504. https://doi.org/10.1016/j.rsase.2021.100504
- Purvis, B., Mao, Y., & Robinson, D. (2019). Entropy and its application to urban systems. Entropy, 21(1), 56. https://doi.org/10.3390/e21010056
- Rahman, A., Aggarwal, S. P., Netzband, M., & Fazal, S. (2010). Monitoring urban sprawl using remote sensing and GIS techniques of a fast-growing urban centre, India. IEEE Journal of Selected Topics in Applied Earth Observations and Remote Sensing, 4(1), 56–64. https://doi.org/10.1109/JSTARS.2010.2084072
- Rahman, A., Kumar, S., Fazal, S., & Siddiqui, M. A. (2012). Assessment of land use/land cover change in the north-West District of Delhi using remote sensing and GIS techniques. Journal of the Indian Society of Remote Sensing, 40(4), 689–697. https://doi.org/10.1007/s12524-011-0165-4
- Ramachandra, T., Setturu, B., & Aithal, B. H. (2012). Peri-urban to urban landscape patterns elucidation through spatial metrics. International Journal of Engineering Research and Development, 2(12), 58–81.
- Sahana, M., Hong, H., & Sajjad, H. (2018). Analyzing urban spatial patterns and trend of urban growth using urban sprawl matrix: A study on Kolkata urban agglomeration, India. Science of the Total Environment, 628, 1557–1566. https://doi.org/10.1016/j.scitotenv.2018.02.170
- Sharma, R., & Joshi, P. (2013). Monitoring urban landscape dynamics over Delhi (India) using remote sensing (1998–2011) inputs. Journal of the Indian Society of Remote Sensing, 41(3), 641–650. https://doi.org/10.1007/s12524-012-0248-x
- Shaw, A. (2005). Peri-urban interface of Indian cities: Growth, governance, and local initiatives. Economic and Political Weekly, 40(2), 129–136. https://doi.org/10.2307/4416042
- Shaw, A. (2019). Urban growth and change in post-liberalized India: Small town dynamics. Journal of Urban and Regional Studies on Contemporary India, 6(1), 1–14.
- Shikary, C., & Rudra, S. (2021). Measuring urban land use change and sprawl using geospatial techniques: A study on purulia municipality, West Bengal, India. Journal of the Indian Society of Remote Sensing, 49(2), 433–448. https://doi.org/10.1007/s12524-020-01212-6
- Sisodia, P. S., Tiwari, V., & Dahiya, A. K. (2015). Measuring and monitoring the urban sprawl of Jaipur city using remote sensing and GIS. International Journal of Information Systems and Social Change (IJISSC), 6(2), 46–65. https://doi.org/10.4018/ijissc.2015040104
- Sudhira, H., & Ramachandra, T. (2007). Characterizing urban sprawl from remote sensing data and using landscape metrics. Proceedings of the 10th International Conference on Computers in Urban Planning and Urban Management, Iguassu Falls, Brazil.
- Sudhira, H., Ramachandra, T., Raj, K. S., & Jagadish, K. (2003). Urban growth analysis using spatial and temporal data. Journal of the Indian Society of Remote Sensing, 31(4), 299–311. https://doi.org/10.1007/BF03007350
- Taiwo, O. J. (2022). Modeling the spatiotemporal patterns of urban sprawl in Ibadan metropolis between 1984 and 2013 in Nigeria. Modeling Earth Systems and Environment, 8(1), 121–140. https://doi.org/10.1007/s40808-021-01095-7
- Viana, C. M., Oliveira, S., Oliveira, S. C., & Rocha, J. (2019). Land use/land cover change detection and urban sprawl analysis. In H. R. Pourghasemi & C. Gokceoglu (Eds.), Spatial Modeling in GIS and R for Earth and Environmental Sciences (pp. 621–651). Elsevier.
- Yeh, A. G.-O., & Li, X. (2001). Measurement and monitoring of urban sprawl in a rapidly growing region using entropy. Photogrammetric Engineering and Remote Sensing, 67(1), 83–90.
- Yue, W., Liu, Y., & Fan, P. (2013). Measuring urban sprawl and its drivers in large Chinese cities: The case of Hangzhou. Land Use Policy, 31, 358–370. https://doi.org/10.1016/j.landusepol.2012.07.018