?Mathematical formulae have been encoded as MathML and are displayed in this HTML version using MathJax in order to improve their display. Uncheck the box to turn MathJax off. This feature requires Javascript. Click on a formula to zoom.
ABSTRACT
The primary aim of the current study was to develop a model capable of predicting the spatial distribution patterns of soil organic carbon (SOC) in mangrove forests (Avicennia marina) affected by camel grazing along the southern coast of the Red Sea. Four protected locations within mangrove forests were selected along the southern coast of the Saudi Red Sea, while eight other locations were selected under the influence of camel grazing. Three equations—allometric, exponential, and sigmoid—were employed on soil carbon data obtained from 40 soil cores, which equated to 600 soil samples. The goal was to develop models that could forecast how the cumulative SOC stocks (SOCc) and volumetric SOC densities (SOCv) would be distributed throughout the respective soil profiles in protected and grazed locations of mangroves, in order to predict how soil carbon changes when mangroves are under grazing stress. The sigmoid and exponential equations proved to be most effective in predicting SOCv distribution, with average R2 values of 0.956681 and 0.893894 for protected and grazed locations, respectively. For protected locations, all three equations effectively predicted the SOCc, with the sigmoid equation (R2 = 0.999942) exhibiting the best performance. In grazed locations, all equations were applicable, with the allometric equation demonstrating superior accuracy (R2 = 0.999910). The study found that grazing activities in mangrove forests resulted in a loss of SOC stock of 7.0 kg C/m2, accounting for 54% of the initial stock. These findings will significantly enhance our comprehension of SOC distribution in mangrove ecosystems under the grazing effect, allowing us to quantify the impact of camel grazing on SOC dynamics in coastal ecosystems.
Introduction
Mangroves, recognized as one of the world’s most valuable ecosystems, provide a wide range of ecosystem services that contribute to human well-being (Atwood et al., Citation2017). The estimated value of these ecosystem services is approximately 14,000–16,000 USD/ha/yr, totaling around 1.6 billion USD annually for mangrove habitats worldwide (Polidoro et al., Citation2010). Unfortunately, mangrove forests are currently facing significant degradation and loss (Sanderman et al., Citation2018). The main drivers behind this decline include the conversion of mangroves for aquaculture, particularly shrimp farming, as well as agriculture, urban development, livestock grazing, overexploitation, and severe climatic events (PERSGA/GEF, Citation2004; Valiela et al., Citation2001). Despite the significant increase in food production and expanding human populations, the potential dangers associated with livestock grazing have not received adequate attention, as highlighted by the limited research conducted in this area (Kauffman et al., Citation2016). Mangrove ecosystems are susceptible to degradation, which can occur either indirectly through the utilization of neighboring land for livestock farming or directly through the use of mangrove forests as grazing grounds, transit routes, and resting areas for livestock (He & Silliman, Citation2016). Limited research conducted on the effects of livestock in mangroves has highlighted various significant concerns, including the fragmentation of forests caused by the establishment of pathways, modifications in vegetation structure, and changes to soil conditions (Minchinton et al., Citation2019).
While the mangroves along the Red Sea may not exhibit the same level of lushness as those found on other tropical coastlines, they still fulfill crucial ecological functions (PERSGA/GEF, Citation2004). The mangroves found along the Red Sea have great ecological and biogeographical importance because they mark the northernmost boundary of mangrove ecosystems in the Indo-Pacific region (Eid & Shaltout, Citation2016). These mangroves exhibit remarkable resilience in extremely challenging conditions, such as high salinity, lack of rivers, limited rainfall, and arid landscapes (Eid et al., Citation2016). In Saudi Arabia, numerous earlier surveys have highlighted excessive camel grazing as a significant contributor to mangrove degradation along the Red Sea coast, particularly in the southern regions (Mandura et al., Citation1987; Price et al., Citation1987).
In mangroves, soil organic carbon (SOC) constitutes a substantial portion, ranging from 50 to over 90%, of the total ecosystem carbon (Donato et al., Citation2011). Therefore, it is crucial to assess the distribution of SOC within mangrove forests. This understanding is essential for prioritizing efforts to protect and restore these ecosystems, with a particular focus on climate mitigation (Sanderman et al., Citation2018). Hence, the development of accurate and widely applicable equations that consider soil depth and land-use conditions is of paramount importance. The modeling approach provides an advantage by enabling the mathematical estimation of soil carbon distribution through a straightforward integration across selected depths (Eid et al., Citation2023). As a result, ongoing research is dedicated to improving the prediction of SOC stocks (Minasny et al., Citation2013).
To our knowledge, there has been no prior investigation into modeling the distribution of SOC within mangrove ecosystems in Saudi Arabia. Consequently, the primary aim of this study was to develop a model capable of predicting the spatial distribution patterns of SOC in mangrove forests affected by camel grazing along the southern coast of the Red Sea. The specific aims of this study were as follows: 1) Investigate the distribution patterns of cumulative SOC stocks (SOCc, kg C/m2) and volumetric SOC density (SOCv, kg C/m3) in the soil profiles of protected and grazed areas of Avicennia marina mangroves using three widely applicable mathematical equations (allometric, exponential, and sigmoid); 2) Employ the aforementioned equations to predict SOCv and SOCc for both the protected and grazed areas; and 3) Determine the equation that best fits the data by comparing the accuracy of their predictions. In this study, our hypothesis was that camel grazing on mangroves would lead to a significant reduction in SOCv and SOCc. The findings of this study will significantly enhance our understanding of how soil carbon changes when mangroves are subjected to camel grazing, providing valuable insights for preservation, restoration, and conservation initiatives.
Materials and methods
Soil samplings
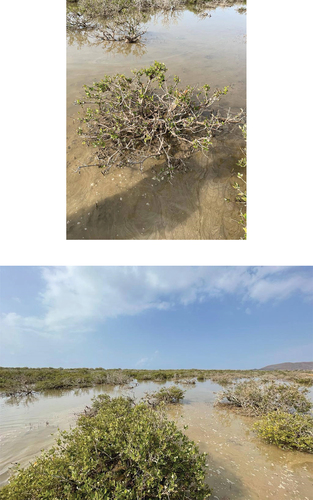
Our research was conducted along the southern coast of the Red Sea near Jazan City, Saudi Arabia. In this area, there was a protected mangrove forest situated in close proximity to the Saudi Aramco oil company. To prevent camel trespassing and grazing, a long fence had been installed along the mangrove forest several decades ago. However, the grazed locations we studied were located outside the fence, allowing camels easy access to the forest for feeding activities (Photos A1–2). We obtained permission from the local authorities of Aramco to access the protected locations of A. marina. It is important to note that all the A. marina locations we studied were natural forests and not part of any seedling efforts.
The study area is characterized by a hot and dry climate (Arshad et al., Citation2018). The climatic data from 1991 to 2020 (Saudi Arabia, Citation2024) indicates that the average maximum temperature in July is approximately 38.7°C, while the average minimum temperature in January is about 17.8°C. The hottest months in the study area typically occur from June to September. In terms of precipitation, the monthly rainfall varies from 3.1 mm in September to 19.6 mm in March.
In January–February 2022, sampling was carried out at 12 locations (Table ): four of these locations were selected as representative sites of protected mangroves dominated by A. marina; the remaining eight locations were chosen to represent grazed mangroves. Large numbers of camels were observed grazing in these areas, and their impact on the vegetation was evident (Photos A1–2). For the protected locations, 20 soil cores were randomly selected from the corresponding 20 sites. Similarly, for the grazed locations, another 20 soil cores were randomly selected. A hand soil corer made of stainless steel, measuring 75 cm in length and with an inner diameter of 70 mm, was used for sampling. The corer was inserted into the soil to a depth of 75 cm. Carefully removing the soil core from the corer, it was then divided into 5 cm-thick samples using a blade. These samples represented various soil depths, including 0–5, 5.1–10, 10.1–15, 15.1–20, 20.1–25, 25.1–30, 30.1–35, 35.1–40, 40.1–45, 45.1–50, 50.1–55, 55.1–60, 60.1–65, 65.1–70, and 70.1–75 cm. Each soil sample was placed and stored in plastic containers, tightly sealed with Parafilm to prevent volatilization losses and minimize microbial activity before analysis. The containers were stored on ice. In total, 40 soil cores were collected, resulting in 600 soil samples. Each core represented 15 soil layers (0–5, 5.1–10, 10.1–15, 15.1–20, 20.1–25, 25.1–30, 30.1–35, 35.1–40, 40.1–45, 45.1–50, 50.1–55, 55.1–60, 60.1–65, 65.1–70, and 70.1–75 cm). One sample was taken from each layer across all 40 soil cores (20 for protected locations and 20 for grazed locations).
Table 1. Coordinates for selected Avicennia marina mangrove locations on the southern coast of Saudi Arabia, Red Sea
Sample analysis
Each soil sample was dehydrated in a drying oven (DOD-50, Raypa, Barcelona, Espain) at 105°C for a period of three days and then weighed by using an analytical balance (AP224W, Shimadzu, Kyoto, Japan) to determine its bulk density (SBD) in grams per cubic centimeter, following the procedure described by Wilke (Wilke, Citation2005):
where ρsj is SBD (g/cm3) of jth layer, mj is mass of soil sample (g) of jth layer dried at 105°C, and vj is volume of soil sample (cm3) of jth layer. After drying, the samples were ground and sieved (Canadian Standard Sieve Series, 2 mm sieve opening, W.S. Tyler, Ontario, Canada) to ensure particle size was below 2 mm. To assess soil organic carbon (SOC) content, soil organic matter (SOM) was quantified using the loss-on-ignition method. This method involves combusting the SOM in a muffle furnace (ELF 11/6, Carbolite Gero Ltd., Derbyshire, UK) at 550°C for two hours, as described by Jones (Jones, Citation2001). The SOC content (g C/kg) was calculated using the equation (Kauffman & Donato, Citation2012):
To calculate volumetric SOC density (kg C/m3), the SOC content was multiplied by the SBD (Bai et al., Citation2016), according to Equationequation (3)(3)
(3) :
where SOCvj pertains to jth layer’s volumetric SOC density (kg C/m3), ρsj pertains to jth layer’s SBD (g/cm3), and SOCj pertains to jth layer’s SOC content (g C/kg). SOC stock (kg C/m2) in each layer was computed (Bai et al., Citation2016), as shown in Equationequation (4)(4)
(4) :
where SOCsj pertains to jth layer’s stock SOC (kg C/m2), SOCvj pertains to jth layer’s volumetric SOC density (kg C/m3), and H pertains to jth layer’s thick (m). Cumulative SOC stock (SOCc) from the surface (0–5 cm) to a given depth was computed by summing up the stock SOC of each soil layer, as shown in Equationequation (5)(5)
(5) :
where SOCc is the cumulative of jth layer’s stock SOC (kg C/m2) in a desired depth. For each protected and grazed mangroves, 300 soil samples (one sample taken from each of the 15 soil layers) were taken from 20 sampling sites. Datasets for calibration and validation were separated apart of the SOC data. In both protected and grazed locations, 75% (15 soil cores) of the collected soil cores were randomly chosen for model calibration, while the remaining 25% (5 soil cores) served as validation data. For both mangroves locations, the volumetric SOC density (SOCv) and cumulative SOC stocks (SOCc) depth distribution was modeled using allometric, exponential, and sigmoid equations. The mathematical formulas for the three equations are as follows:
The calibration datasets were utilized to fit the allometric, exponential, and sigmoid equations, aiming to describe the depth distribution of SOCc and SOCv for each core spanning from 0 to 75 cm (please see ). The SOCc and SOCv values of the next five intervals of the layers (50.1–55, 55.1–60, 60.1–65, 65.1–70, and 70.1–75 cm) were predicted using the SOCc and SOCv of ten intervals of the layers (0–5, 5.1–10, 10.1–15, 15.1–20, 20.1–25, 25.1–30, 30.1–35, 35.1–40, 40.1–45, and 45.1–50 cm) in validation datasets. By calculating validation indices, for example the Student’s t-test, mean normalized average error (MNAE), and mean normalized bias (MNB), the predictive accuracy between the three equations was compared (Novotná et al., Citation2015):
Figure 1. Curve-fitting models for volumetric SOC density (kg C/m3) as a function of soil profile (m) in protected and grazed Avicennia marina mangrove locations. FLocation = 106.9***; FDepth = 9.7***; FLocation × Depth = 4.5***; F-values represent a two-way repeated measures ANOVA results; ***: p < 0.001.
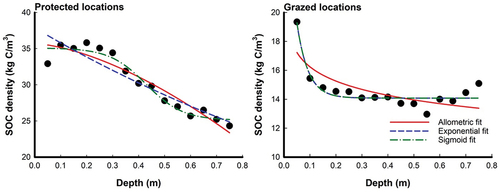
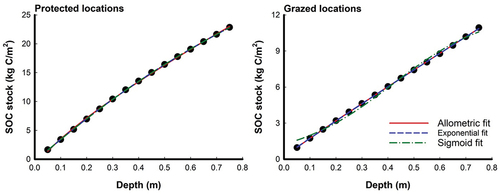
Figure 2. Curve-fitting models for cumulative SOC stock (kg C/m2) as a function of soil profile (m) in protected and grazed Avicennia marina mangrove locations. FLocation = 123.5***; FDepth = 751.5***; FLocation × Depth = 87.9***; F-values represent a two-way repeated measures ANOVA results; ***: p < 0.001.
Statistical analysis
SOCv and SOCc depth distribution patterns were modeled using SigmaPlot version 14.0 software. Prior to statistical analysis, the normality of data distribution was assessed using the Shapiro-Wilk’s W test, and the homogeneity of variance was evaluated using Levene’s test. When necessary, data were log-transformed to ensure normality and homogeneity. To identify statistically significant variations in SBD, SOC content, SOCv, and SOCc between protected and grazed locations at each of the 15 soil profiles, a two-way repeated measures ANOVA was utilized. The Student’s t-test was applied to determine whether there were significant differences in topsoil concentration factors (TCFs) among the protected and grazed locations. All statistical analyses were carried out using SPSS 23.0 software (SPSS, Citation2015).
Results
provide a summary of the statistics for SBD measured in g/cm3 and SOC content expressed in g C/kg across the soil profile depths ranging from 0 to 75 cm. In the protected locations, the distribution of SBD exhibited a significant increase, rising from 0.93 g/cm3 at 0–5 cm depth to 1.90 g/cm3 at 70.1–75 cm depth. Similarly, in the grazed locations, SBD increased from 1.09 g/cm3 at 0–5 cm depth to 2.27 g/cm3 at 70.1–75 cm depth (). In contrast, the trend for SOC content showed a decrease in both protected and grazed locations as the depth increased. In protected locations, SOC content decreased from 35.7 g C/kg to 12.6 g C/kg across the depth range of 0–75 cm. Similarly, in grazed locations, SOC content declined from 18.2 g C/kg to 6.8 g C/kg over the same depth range (). Significant differences in SBD were observed between the protected and grazed locations, with protected locations exhibiting the lowest mean values (1.49 ± 0.02 g/cm3) and grazed locations displaying the highest mean values (1.64 ± 0.03 g/cm3). The increase in SBD amounted to 10% in the grazed locations compared to the protected locations (). Likewise, significant differences in SOC content were observed between the protected and grazed locations, with protected locations showing the highest mean values (21.6 ± 0.5 g C/kg) and grazed locations exhibiting the lowest mean values (9.6 ± 0.2 g C/kg). The decrease in SOC content in the grazed locations amounted to 56% compared to the protected locations ().
Table 2. Statistical summary of soil bulk density (g/cm3) at different depth intervals in protected and grazed Avicennia marina mangrove locations
Table 3. Statistical summary of soil organic carbon contents (g C/kg) at different depth intervals in protected and grazed Avicennia marina mangrove locations
Calibration datasets were used to create models for SOCv and SOCc in protected and grazed mangroves at 12 sampling locations. Three different equations, namely allometric, exponential, and sigmoid, were fitted to the data. The fitting results are visually presented in , while provide details of the equations used and the corresponding results for both SOCv and SOCc. Significant variations in SOCv were observed among the protected and grazed locations, with protected locations exhibiting the highest mean values (30.5 ± 0.6 kg C/m3) and grazed locations displaying the lowest mean values (14.6 ± 0.2 kg C/m3), resulting in a 52% decrease in SOCv (Figure ). These results align with the hypothesis of the study. The sigmoid equation yielded the best modeling outcomes for SOCv, with R2 values of 0.956681 for protected locations, while the exponential equation provided the best modeling outcomes with R2 values of 0.893894 for grazed locations (, Figure ). Regarding SOCc levels, there were noticeable distinctions between the grazed and protected areas. Protected locations exhibited higher mean values (13.0 ± 0.4 kg C/m2) compared to grazed locations (6.0 ± 0.2 kg C/m2), resulting in a 54% decrease in SOCc (). These findings support the hypothesis of the study. All three equations performed well in simulating SOCc, with the sigmoid equation demonstrating the best fit for protected locations (R2 = 0.999942), and the allometric equation being the best fit for grazed locations (R2 = 0.999910) (, Figure ).
Table 4. Model parameters and fitting results for volumetric SOC density (kg C/m3) using three equations in in protected and grazed Avicennia marina mangrove locations
Table 5. Model parameters and fitting results for cumulative SOC stock (kg C/m2) using three equations in protected and grazed Avicennia marina mangrove locations
In this study, predictions and validations were performed for both SOCv expressed in kg C/m3 and SOCc expressed in kg C/m2. The accuracy of the predictions were assessed using validation indices, namely mean normalized average error (MNAE), mean normalized bias (MNB), and t-test, which are presented in . For both protected and grazed locations of mangroves, SOCv predictions can be effectively validated using all three equations. The sigmoid equation is the preferred choice for protected locations, while the exponential equation is preferred for grazed locations due to their lower MNAE and MNB values, indicating higher accuracy (). In terms of SOCc validation in protected locations, any of the three equations can be utilized, with the sigmoid equation being the preferred choice due to its reduced MNB and MNAE values (Table ). For grazed locations, all three equations can be employed for validation, but the allometric equation is slightly preferred due to its lower MNAE and MNB values, indicating better performance. Both the protected and grazed locations exhibited TCFs greater than 0.10, as shown in .
Figure 3. Volumetric densities of SOC in the upper 75 cm of soil, expressed as TCFs (0–10/0–75 cm), at both protected and grazed Avicennia marina mangrove locations. A t-test comparison was displayed on the graph; the middle line is the median; the top and bottom of the box are quantiles (Q1 and Q3); the error bar is the largest and smallest value; and the + is the mean.
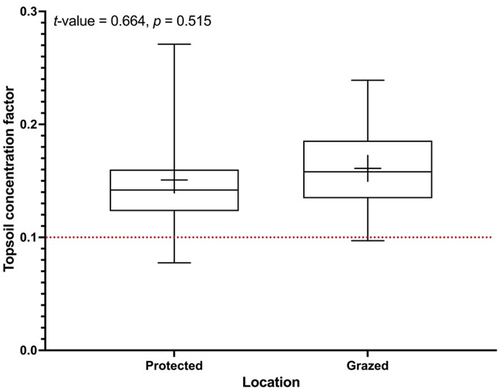
Table 6. Assessment of validation indices for volumetric SOC density (kg C/m3) using three equations in protected and grazed Avicennia marina mangrove locations
Table 7. Assessment of validation indices for cumulative SOC stock (kg C/m2) using three equations in protected and grazed Avicennia marina mangrove locations
Discussion
Soil bulk density (SBD) is a dynamic soil characteristic that varies depending on the structural conditions of the soil. It is commonly used to assess soil moisture and the level of aeration (Wilke, Citation2005). The importance of SBD lies in its significant impact on the mechanical resistance of soil to root growth and its influence on estimating and distributing SOC content (Li et al., Citation2019). Within the mangrove locations we studied, SBD increased with depth in both protected and grazed areas. This finding is consistent with previous research conducted along the Egyptian Red Sea coast (Eid & Shaltout, Citation2016), southern Saudi Arabia (Arshad et al., Citation2018; Eid et al., Citation2016, Citation2019), and in natural and planted mangroves across the United Arab Emirates (UAE) (Schile et al., Citation2017), where the results of these studies indicated that the SBD increases with depth. SBD levels increased due to the accumulation of tailings deposited on the soil surface and plant residues deposited in the subsurface layers. This accumulation, as noted by Osman et al. (Osman et al., Citation2023), alters the content of SOC, porosity, and compaction of the soil, consequently affecting the observed pattern of SBD. The study by Li et al. (Citation2019) delves into the intriguing relationship between soil composition and SBD. It highlights how the buildup of tailings and plant residues in the soil layers can impact organic matter, porosity, and compaction, ultimately shaping the observed pattern of SBD.
The SOC content at a specific depth is influenced by the interaction between supply and decomposition processes that occur over time. In the present study, it was observed that all locations within the study area exhibited a gradual decline in SOC content from the soil surface to the bottom of the soil cores. This pattern has been documented in diverse mangrove regions worldwide, including the Red Sea (Arshad et al., Citation2018; Eid & Shaltout, Citation2016; Eid et al., Citation2016, Citation2019), UAE (Schile et al., Citation2017), Dominican Republic (Kauffman et al., Citation2014), Brazil (Ferreira et al., Citation2010), Indonesia (Sasmito et al., Citation2020), Australia (Ewers Lewis et al., Citation2018), and the Asia-Pacific region (Donato et al., Citation2011). The decreasing trend of SOC content with increasing depth can be attributed to changes in the relative proportions of organic materials derived from mangroves and external sources of organic carbon in the soils. The variation in SOC content with depth may also be influenced by complex processes such as hydrological and soil regimes, decomposition, biological cycling, soil erosion, leaching, illuviation, mineral weathering, and atmospheric deposition, as suggested by Sanderman et al. (Citation2018).
Three primary variables, namely SOC content, SBD, and soil depth, influence the total storage of organic carbon in mangrove soils. Mangroves typically have oxygen-depleted soils with slow decomposition rates, creating favorable conditions for retaining organic carbon (Kida & Fujitake, Citation2020). However, the quantity and dynamics of SOC stock in mangrove soils exhibit significant variation across different mangroves and regions. This variability is driven by regional carbon dynamics and factors such as forest age, species composition, vegetation biomass and productivity, soil fertility, community structure, deposition of suspended matter, and soil conditions (e.g. redox potential, pH, salinity) (Sanderman et al., Citation2018; Twilley et al., Citation2018). In the A. marina mangroves studied, the amount of SOC stock was found to be lower (6.0–13.0 kg C/m2) compared to the global average (36.1 kg C/m2) (Sanderman et al., Citation2018). Several factors contribute to the lower SOC stocks in mangrove locations, including limited input of organic matter from external sources, unfavorable environmental conditions that hinder mangrove growth, and habitat characteristics that are not conducive to carbon sequestration (Eid & Shaltout, Citation2016).
In the present investigation, it was observed that the SOC stock in protected areas exhibited a 117% increase compared to areas subjected to camel grazing, providing additional evidence of the significant impact of camel grazing on SOC stock. The current study also found that the density, height, and crown diameter of trees in protected locations surpassed those in areas influenced by camel grazing by 29%, 56%, and 42%, respectively (Data not displayed). The presence of fewer trees is likely to result in reduced productivity and carbon storage (Kauffman et al., Citation2016). Previous studies conducted by Price et al. (Price et al., Citation1987) and Mandura et al. (Citation1987) have similarly identified camel grazing as a major factor contributing to the degradation of mangroves in the Red Sea. In regions with intense grazing, mangroves experience severe consequences such as significant foliage reduction, desiccation of grazed branch ends, stunted growth leading to multi-stemmed shrubs, and destruction of trampled seedlings and pneumatophores by camels (PERSGA/GEF, Citation2004). Additionally, camel grazing is likely to diminish oxygen availability in the subsurface soil, as trampling damages oxygen-conducting pneumatophores (PERSGA/GEF, Citation2004). Consequently, the proportion of organic matter subject to sulfate reduction may increase (Balk et al., Citation2015).
With the increasing prominence of greenhouse gas reduction projects and carbon exchange systems, the accurate estimation and prediction of SOC levels across different soil depths have become highly significant (Eid et al., Citation2023). A comprehensive understanding of the distribution of SOC in relation to depth is crucial for effective monitoring, management, and the development of policies related to SOC (Song et al., Citation2017). Since there is limited literature specifically addressing the creation of regression models for characterizing the vertical distribution of SOCv in mangroves, the study’s results were compared to research that utilized regression models in other ecosystems. The exponential equation is commonly employed to describe the vertical distribution of SOCv in various ecosystems, such as forests (Song et al., Citation2017), agricultural lands (Sleutel et al., Citation2003), grasslands (Jobbágy & Jackson, Citation2000), and specific regions like Indiana (Mishra et al., Citation2009). In coastal saltmarshes (Bai et al., Citation2016), researchers have utilized exponential, allometric, and logistic equations to model the vertical distribution of SOCv. Similarly, in the coastal sabkhas of Saudi Arabia’s Red Sea coast (Eid et al., Citation2023), the sigmoid equation was found to provide the best fit for predicting the distribution of SOCv across the soil profile. In our study, which focused on predicting SOCv in protected and grazed locations of mangroves, we found that the sigmoid and exponential equations yielded the best modeling outcomes for protected and grazed locations, respectively. Here are some possible reasons to explain the results observed in the present study: a) Model appropriateness: The choice and performance of equations can be influenced by the specific dynamics and characteristics of the study area (Bai et al., Citation2016; Eid et al., Citation2023). The sigmoid equation’s effectiveness in predicting SOCv distribution in protected locations might be attributed to the sigmoidal nature of SOC accumulation patterns in relatively undisturbed mangrove environments. The exponential equation’s success in predicting SOCv distribution in grazed locations could be due to the exponential decay of SOC caused by grazing activities; and b) Environmental factors: Environmental factors such as vegetation cover, soil moisture, nutrient availability, and disturbance levels can influence SOC dynamics (Bai et al., Citation2016; Eid et al., Citation2023; Mishra et al., Citation2009; Osman et al., Citation2023). In protected locations, where mangroves are undisturbed and exhibit healthier conditions, the sigmoid equation may perform well due to the stable and continuous accumulation of organic carbon over time. In contrast, grazed locations experience disturbances caused by grazing activities, leading to changes in vegetation structure, litter input, and decomposition rates (Balk et al., Citation2015; Minchinton et al., Citation2019). The exponential equation’s better accuracy in predicting SOCv in grazed locations could stem from its ability to capture the impacts of biomass changes caused by grazing on carbon stocks.
All three equations utilized in the study produced satisfactory results (R2 > 0.99) when modeling the depth distribution of SOCc in both protected and grazed locations of mangroves (Table ). However, it is essential to determine which equation yields the lowest errors when predicting SOC stocks. For protected locations of mangroves, any of the three equations can be used, but the sigmoid equation is preferred due to its lower MNAE and MNB values. In the case of grazed locations of mangroves, all three equations can be employed for validation, but the allometric equation is preferable due to its lower MNAE and MNB values. This preference aligns with a study by Eid et al. (Citation2023) who identified the exponential equation as the most effective approach for predicting SOCc in coastal sabkhas of Saudi Arabia’s Red Sea coast across various vegetation types. Bai et al. (Citation2016) found that the allometric equation could serve as a viable tool for predicting SOCc in saltmarshes of the Yellow River Delta, China. Additionally, Mishra et al. (Citation2009) demonstrated that the allometric equation resulted in lower errors when predicting SOC stocks for Indiana soils, USA. There are several possible reasons why the results of the current study may differ from previous studies, despite the similar preference for allometric equations in grazed areas and sigmoid equations in protected areas. Here are a few potential explanations: a) Variation in vegetation and ecosystem characteristics: While studies by (Bai et al., Citation2016; Eid et al., Citation2023; Mishra et al., Citation2009) examined different ecosystems such as sabkhas, saltmarshes, and general soil conditions, our study specifically focuses on mangroves. The unique root structures and litter decomposition rates of mangroves compared to other ecosystems may influence the distribution patterns of SOC differently; b) Soil properties: Soil texture, salinity, and aeration are important factors that can impact SOC decomposition and distribution (Arshad et al., Citation2018; Eid et al., Citation2023; Li et al., Citation2019; Osman et al., Citation2023). Even within the Red Sea coast, variations in these soil properties between mangroves and sabkhas may contribute to the preference for different modeling approaches in different studies; and c) Sample size: The sample size used in the current study (40 soil cores, 75 cm depth) differs from the sample sizes employed in other studies, such as Eid et al. (Citation2023) (120 soil cores, 50 cm depth), Bai et al. (Citation2016) (28 soil cores, 100 cm depth), and Mishra et al. (Citation2009) (252 soil cores, 100 cm depth). Differences in the number of soil samples collected and the depth of soil cores can impact the accuracy and representativeness of the results, potentially leading to discrepancies between studies. Considering these factors, it becomes evident that variations in vegetation and ecosystem characteristics, soil properties, and sample size could contribute to the differences observed between your study and previous studies. These factors highlight the importance of considering the specific context and conditions of each study area when interpreting and comparing research results.
To assess the impact of plant cycling on biogeochemical elements, the examination of topsoil concentration factors (TCFs) can be carried out. Figure presents a box plot illustrating the influence of TCFs (0–10/0–75 cm) on SOCv in protected and grazed locations of mangroves. The results depicted in Figure indicate that all mangrove locations exhibit TCFs exceeding 0.10, suggesting that plant cycling contributes to increased SOC in the topsoil layer (0–10 cm depth), in line with findings from (Bai et al. Citation2016; Jobbágy & Jackson, Citation2001).
Conclusions
The findings revealed that in both protected and grazed mangrove locations, SBD increased with soil depth, while SOC content exhibited a decline. The sigmoid and exponential equations proved to be the most accurate models for predicting the vertical distribution of SOCv in protected and grazed mangroves, respectively. Specifically, the sigmoid equation exhibited excellent performance in predicting SOCc in protected mangrove locations, whereas the allometric equation was effective in grazed mangrove locations. The study further indicated that grazing activities in the mangrove forests led to a loss of SOC stock, amounting to 7.0 kg C/m2, which accounted for 54% of the original SOC stock. This highlights the detrimental impact of camel grazing on SOC levels and underscores the significance of preserving mangrove areas, particularly in arid regions like Saudi Arabia.
This study provided valuable insights into the impact of grazing on SOC distribution in mangrove forests. Building on this foundation, several exciting avenues can be explored for further research:
- Refining the Models: The study identified the most accurate models for predicting SOC vertical distribution. Future research could involve:
- Model comparison with field data: Collecting additional field data over a longer period could allow for further validation and refinement of the chosen models.
- Spatially explicit modeling: Integrating spatial data (e.g. satellite imagery) with the models could enable the prediction of SOC distribution across wider mangrove landscapes.
- Understanding the Mechanisms: The study suggests a connection between grazing and reduced SOC stock. Further investigation could delve deeper into the mechanisms:
- Grazing impact on plant litter: Studying how grazing affects litter quantity and quality could provide insights into how it influences SOC decomposition rates.
- Soil faunal communities: Investigating how grazing alters soil microbial communities could reveal their role in SOC dynamics under grazed conditions.
- Long-term Implications: This study provides a snapshot, but long-term monitoring is crucial:
- SOC stock recovery potential: Monitoring SOC stock in previously grazed areas undergoing restoration could reveal recovery rates and the potential for long-term carbon sequestration.
- Grazing intensity and adaptation: Studying the effects of varying grazing intensity could inform management practices to minimize SOC loss while supporting local livelihoods.
By exploring these projections, researchers can gain a more comprehensive understanding of SOC dynamics in mangroves under grazing pressure. This knowledge can be instrumental in developing effective management strategies for the conservation and restoration of these critical ecosystems, promoting their role in mitigating climate change through long-term carbon storage.
Author contributions
Amal S. Dajam: methodology, formal analysis, writing—review and editing, Funding acquisition and visualization; Ebrahem M. Eid: Conceptualization, software, validation, formal analysis, investigation, data curation, writing—original draft preparation, writing—review and editing, visualization, and supervision. All authors agree to be accountable for all aspects of the work.
Acknowledgements
The authors extend their appreciation to the Deanship of Scientific Research at King Khalid University for funding this research work through the grant number RGP. 2/411/44.
Disclosure statement
No potential conflict of interest was reported by the author(s).
Data availability statement
The data supporting the findings of this study are available upon reasonable request.
Additional information
Funding
References
- Arshad, M., Alrumman, S., & Eid, E. M. (2018). Evaluation of carbon sequestration in the sediment of polluted and non-polluted locations of mangroves. Fundamental and Applied Limnology, 192(1), 53–14. https://doi.org/10.1127/fal/2018/1127
- Atwood, T. B., Connolly, R. M., Almahasheer, H., Carnell, P. E., Duarte, C. M., Ewers Lewis, C. J., Irigoien, X., Kelleway, J. J., Lavery, P. S., Macreadie, P. I., Serrano, O., Sanders, C. J., Santos, I., Steven, A. D. L., & Lovelock, C. E. (2017). Global patterns in mangrove soil carbon stocks and losses. Nature Climate Change, 7(7), 523–528. https://doi.org/10.1038/nclimate3326
- Bai, J. H., Zhang, G. L., Zhao, Q. Q., Lu, Q. Q., Jia, J., Cui, B. S., & Liu, X. H. (2016). Depth-distribution patterns and control of soil organic carbon in coastal salt marshes with different plant covers. Scientific Reports, 6(1), 12. https://doi.org/10.1038/srep34835
- Balk, M., Keuskamp, J. A., & Laanbroek, H. J. (2015). Potential activity, size, and structure of sulfate-reducing microbial communities in an exposed, grazed and a sheltered, non-grazed mangrove stand at the Red Sea coast. Frontiers in Microbiology, 6, 1478. https://doi.org/10.3389/fmicb.2015.01478
- Donato, D., Kauffman, J., Murdiyarso, D., Kurnianto, S., Stidham, M., & Kanninen, M. (2011). Mangroves among the most carbon-rich forests in the tropics. Nature Geoscience, 4(5), 293–297. https://doi.org/10.1038/ngeo1123
- Eid, E. M., Arshad, M., Shaltout, K. H., El-Sheikh, M. A., Alfarhan, A. H., Picó, Y., & Barcelo, D. (2019). Effect of the conversion of mangroves into shrimp farms on carbon stock in the sediment along the southern Red Sea coast, Saudi Arabia. Environmental Research, 176, 108536. https://doi.org/10.1016/j.envres.2019.108536
- Eid, E. M., El-Bebany, A. F., & Alrumman, S. A. (2016). Distribution of soil organic carbon in the mangrove forests along the southern Saudi Arabian Red Sea coast. Rend Fis Acc Lincei, 27, 629–637. https://doi.org/10.1007/s12210-016-0542-6
- Eid, E. M., Keshta, A. E., Alrumman, S. A., Arshad, M., Shaltout, K. H., Ahmed, M. T., Al-Bakre, D. A., Alfarhan, A. H., & Barcelo, D. (2023). Modeling soil organic carbon at coastal sabkhas with different vegetation covers at the Red Sea coast of Saudi Arabia. Journal of Marine Science and Engineering, 11(2), 295. https://doi.org/10.3390/jmse11020295
- Eid, E. M., & Shaltout, K. H. (2016). Distribution of soil organic carbon in the mangrove Avicennia marina (Forssk.) Vierh. along the Egyptian Red Sea coast. Regional Studies in Marine Science, 3, 76–82. https://doi.org/10.1016/j.rsma.2015.05.006
- Ewers Lewis, C. J., Sanderman, P. E., Baldock, J., & Macreadie, P. I. (2018). Variability and vulnerability of coastal ‘blue carbon’ stocks: A case study from Southeast Australia. Ecosystems 21(2), 263–279. https://doi.org/10.1007/s10021-017-0150-z
- Ferreira, T. O., Otero, X. L., de Souza Junior, V. S., Vidal-Torrado, P., MacíMacíAs, F., & Firme, L. P. (2010). Spatial patterns of soil attributes and components in a mangrove system in Southeast Brazil (São Paulo). Journal of Soils and Sediments, 10(6), 995–1006. https://doi.org/10.1007/s11368-010-0224-4
- He, Q., & Silliman, B. R. (2016). Consumer control as a common driver of coastal vegetation worldwide. Ecological Monographs, 86(3), 278–294. https://doi.org/10.1002/ecm.1221
- Jobbágy, E. G., & Jackson, R. B. (2000). The vertical distribution of soil organic carbon and its relation to climate and vegetation. Ecological Applications, 10(2), 423–436. https://doi.org/10.1890/1051-0761(2000)010[0423:TVDOSO]2.0.CO;2
- Jobbágy, E. G., & Jackson, R. B. (2001). The distribution of soil nutrients with depth: Global patterns and the imprint of plants. Biogeochemistry, 53(1), 51–77. https://doi.org/10.1023/A:1010760720215
- Jones, J. B. (2001). Laboratory guide for conducting soil tests and plant analysis. CRC Press.
- Kauffman, J. B., & Donato, D. C. (2012). Protocols for the measurement, monitoring and reporting of structure, biomass and carbon stocks in Mangrove Forests. Working paper 86, CIFOR. https://doi.org/10.17528/cifor/003749
- Kauffman, J. B., Heider, C., Norfolk, J., & Payton, F. (2014). Carbon stocks of intact mangroves and carbon emissions arising from their conversion in the Dominican Republic. Ecological Applications, 24(3), 518–527. https://doi.org/10.1890/13-0640.1
- Kauffman, J. B., Hernandez Trejo, H., Del Carmen Jesus Garcia, M., Heider, C., & Contreras, W. M. (2016). Carbon stocks of mangroves and losses arising from their conversion to cattle pastures in the Pantanos de Centla, Mexico. Wetlands Ecology and Management, 24(2), 203–216. https://doi.org/10.1007/s11273-015-9453-z
- Kida, M., & Fujitake, N. (2020). Organic carbon stabilization mechanisms in mangrove soils: A review. Forests, 11(9), 981. https://doi.org/10.3390/f11090981
- Li, H., Liao, X., Zhu, H., Wei, X., Shao, M., Naeth, M. A., & Naeth, M. A. (2019). Soil physical and hydraulic properties under different land uses in the black soil region of Northeast China. Canadian Journal of Soil Science, 99(4), 406–419. https://doi.org/10.1139/cjss-2019-0039
- Mandura, A. S., Khafaji, A. K., & Saifullah, S. M. (1987). Mangrove ecosystem of southern Red Sea coast of Saudi Arabia. Proceedings of the Saudi Biological Society, 10, 165–193.
- Minasny, B., McBratney, A. B., Malone, B. P., & Wheeler, I. (2013). Digital mapping of soil carbon. Advances in Agronomy, 118, 1–47. https://doi.org/10.1016/B978-0-12-405942-9.00001-3
- Minchinton, T. E., Shuttleworth, H. T., Lathlean, J. A., McWilliam, R. A., & Daly, T. J. (2019). Impacts of cattle on the vegetation structure of mangroves. Wetlands, 39(5), 1119–1127. https://doi.org/10.1007/s13157-019-01143-0
- Mishra, U., Lal, R., Slater, B., Calhoun, F., Liu, D., & Van Meirvenne, M. (2009). Predicting soil organic carbon stock using profile depth distribution functions and ordinary Kriging. Soil Science Society of America Journal, 73(2), 614–621. https://doi.org/10.2136/sssaj2007.0410
- Novotná, M., Mikes, O., & Komprdova, K. (2015). Development and comparison of regression models for the uptake of metals into various field crops. Environmental Pollution, 207, 357–364. https://doi.org/10.1016/j.envpol.2015.09.043
- Osman, H. E. M., Elaidarous, A. A., El-Morsy, M. H., Eid, E. M., & Keshta, A. E. (2023). Soils with more clay and dense vegetation were rich in soil carbon along Wadi Al-Sharaea, Makkah, Saudi Arabia. Heliyon, 9(1), e12988. https://doi.org/10.1016/j.heliyon.2023.e12988
- PERSGA/GEF. (2004). Status of Mangroves in the Red Sea and Gulf of Aden. PERSGA Technical Series No. 11. PERSGA.
- Polidoro, B. A., Carpenter, K. E., Collins, L., Duke, N. C., Ellison, A. M., Ellison, J. C., Farnsworth, E. J., Fernando, E. S., Kathiresan, K., Koedam, N. E., Livingstone, S. R., Miyagi, T., Moore, G. E., Ngoc Nam, V., Ong, J. E., Primavera, J. H., Salmo, S. G., Sanciangco, J. C., Sukardjo, S., Wang, Y., Wang, Y. (2010). The loss of species: Mangrove extinction risk and geographic areas of global concern. PLOS ONE, 5(4), e10095. https://doi.org/10.1371/journal.pone.0010095
- Price, A. R. G., Medley, P. A. H., McDowall, R. J., Dawson-Shepherd, A. R., Hogarth, P. J., & Ormond, R. F. G. (1987). Aspects of mangal ecology along the Red Sea coast of Saudi Arabia. Journal of Natural History, 21(2), 449–464. https://doi.org/10.1080/00222938700771121
- Sanderman, J., Hengl, T., Fiske, G., Solvik, K., Adame, M. F., Benson, L., Bukoski, J. J., Carnell, P., Cifuentes-Jara, M., Donato, D., Duncan, C., Eid, E. M., Ermgassen, P. Z., Lewis, C. J. E., Macreadie, P. I., Glass, L., Gress, S., Jardine, S. L., … Spalding, M. (2018). A global map of mangrove forest soil carbon at 30 m spatial resolution. Environmental Research Letters, 13(5), 055002. https://doi.org/10.1088/1748-9326/aabe1c
- Sasmito, S. D., Kuzyakov, Y., Lubis, A. A., Murdiyarso, D., Hutley, L. B., Bachri, S., Friess, D. A., Martius, C., & Borchard, N. (2020). Organic carbon burial and sources in soils of coastal mudflat and mangrove ecosystems. Catena, 187, 104414. https://doi.org/10.1016/j.catena.2019.104414
- Saudi Arabia. (2024). Climate change knowledge portal: The world bank group. https://climateknowledgeportal.worldbank.org/country/saudi-arabia/climate-data-historical
- Schile, L. M., Kauffman, J. B., Crooks, S., Fourqurean, J. W., Glavan, J., & Megonigal, J. P. (2017). Limits on carbon sequestration in arid blue carbon ecosystems. Ecological Applications, 27(3), 859–874. https://doi.org/10.1002/eap.1489
- Sleutel, S., De Neve, S., & Hofman, G. (2003). Estimates of carbon stock changes in Belgian cropland. Soil Use and Management, 19(2), 166–171. https://doi.org/10.1111/j.1475-2743.2003.tb00299.x
- Song, J., Li, Z., Nie, X., Liu, C., Xiao, H., Wang, D., & Zeng, G. (2017). A modified soil organic carbon density model for a forest watershed in southern China. Geomorphology, 296, 153–159. https://doi.org/10.1016/j.geomorph.2017.08.044
- SPSS. (2015). IBM SPSS statistics for Windows, version 23.0. New York: IBM Crop, 440, 394.
- Twilley, R. R., Rovai, A. S., & Riul, P. (2018). Coastal morphology explains global blue carbon distributions. Frontiers in Ecology and the Environment, 16(9), 503–508. https://doi.org/10.1002/fee.1937
- Valiela, I., Bowen, J. L., & York, J. K. (2001). Mangrove forests: One of the world’s threatened major tropical environments. BioScience, 51(10), 807–815. https://doi.org/10.1641/0006-3568(2001)051[0807:MFOOTW]2.0.CO;2
- Wilke, B. M. (2005). Determination of chemical and physical soil properties. In R. Margesin & F. Schinner (Eds.), Manual for soil analysis-monitoring and assessing soil bioremediation (pp. 47–95). Springer.
Appendix
Photo A1. Depicts camels engaging in browsing activity on Avicennia marina within grazed mangrove locations.
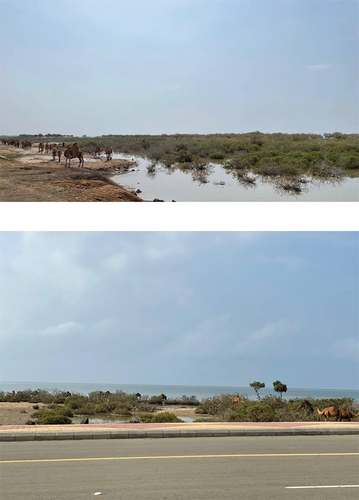
Photo A2. Presents images illustrating the effects of camel grazing on Avicennia marina within grazed mangrove locations.