ABSTRACT
Wetland degradation linked to peri-urban anthropogenic pressures is a major threat to wetland biodiversity. However, little is known of the response of biodiversity to this disturbance. Biotic indicator species are useful for assessing the health and ecological integrity of wetlands. This study evaluated patterns of plant species richness and composition, and determined species characterizing each of three differently disturbed wetland sites of Lutembe Bay Wetland, a peri-urban Ramsar Wetland of International Importance and an Important Bird Area in Uganda. The study revealed that total nitrogen decreased following wetland degradation, but total phosphorous was not affected; pH values were <5.5, while OM content was low in the lightly and heavily (2.5–4.4%) degraded sites. While plant species richness did not differ among the sites, total species richness was higher in heavily disturbed, compared to lightly disturbed and relatively intact sites. Community composition differed significantly among the three sites. Indicator plant species were then identified which could be employed as a rapid assessment tool to infer the level of degradation in the sustainable management of Afrotropical wetlands by practitioners. Results show that continued unsustainable use of wetlands results in changes in soil properties and plant species composition, highlighting the need to restore anthropogenically disturbed parts of wetlands and to prevent further degradation of less degraded areas.
1. Introduction
Globally, wetlands are considered an important and valuable asset to humanity because of their numerous ecosystem functions and values, such as wastewater filtration, nutrient retention, flood protection and storm protection, carbon sequestration and maintenance of wildlife habitats (Alikhani et al., Citation2021; Asumadu et al., Citation2023; Kaffashi et al., Citation2013; Saunders et al., Citation2012; Twesigye et al., Citation2011; USEPA, Citation2013). Anthropogenic disturbance particularly agriculture practices influence the quality and quantity of wetland species composition. Achieng et al. (Citation2023) point out that very few studies focus on relationships between biodiversity and ecosystem change in Afrotropical wetlands except for reports from international organisations which tend to be generic, often with gaps in scientific evidence.
In Africa, various strategies established as efforts to preserve wetlands have continued to be challenged. Mkonda (Citation2022) explains reasons for unsustainable management of Akagela wetland despite the various strategies to conserve this vital ecosystem. Furthermore, Bosma et al. (Citation2017) revealed different perceptions between different wetland resource users which pose challenges to sustainable wetland management. While papyrus harvesters, beekeepers, fishermen, wetland non-users, and hunters associate the largest livelihood benefits with a wetland conservation scenario, farmers and government officials perceive increased agricultural production in the wetland area to be more livelihood enhancing (Bosma et al., Citation2017). Similarly, Businge (Citation2017) reported the main drivers of wetland degradation as agricultural activities, overharvesting of wetland resources and infrastructure development. The same study highlights socio-political dynamics and climatic changes as closely related to main drivers of wetland degradation.
In Uganda, wetlands cover about 11% of the total surface land area, and they provide a wide variety of biophysical and socio-economic functions (UNDP, Citation2016; Barakagira & de Wit, Citation2019). Despite their importance, however, in recent years, wetlands in Uganda have continuously come under increasing anthropogenic degrading pressures, and their coverage has been gradually shrinking due to drainage for agricultural development, excessive exploitation by local populations and infilling for construction of both residential and industrial development (Byamukama & Kiyawa, Citation2019; Finlayson, Citation2007; Kadoma et al., Citation2023; Ndiyoi & Wood, Citation2008; Zhang et al., Citation2006). These activities have, in many cases, drastically reduced the wetlands’ capacity to perform ecological functions (Malick, Citation2004; Kabiri et al., Citation2020; Kakuru et al., Citation2013). For this reason, there is a need for studies on the anthropogenic degradation and restoration of tropical wetlands (Mehari, Citation2023; WRI, Citation2005). The Lutembe Bay is a typical Afrotropical wetland experiencing rapid and widespread degradation, conversion to other land uses and natural areas are increasingly becoming irreversible (Kadoma et al., Citation2023). Many sections of this peri-urban wetland have been converted to industrial use or have gradually been taken over by semi-slum residential housing and commercial floriculture farmers.
Although there is an urgent need to prevent wetland loss and degradation in this biodiversity hotspot, the effects of anthropogenic degradation on physico-chemical soil properties and patterns of plant species communities within the Lutembe Bay Wetland have been under-studied, and standardized plant species to monitor their ecological conditions is lacking.
The present study assessed how wetland plant species richness and community composition vary among wetland sites with different intensities of disturbance on the transitory peri-urban Lutembe Bay Wetland. This study predicted that in response to the wetland degradation, the composition of plant communities will change as a result of differences in the species’ colonization ability (Mohler et al., Citation2006) and changes in soil chemical properties and hydrological regimes (Engida et al., Citation2021; Zhang, Citation2012, Zhang et al., Citation2023). Furthermore, the study assessed which wetland plant species are characteristic of each anthropogenically disturbed and relatively undisturbed/intact adjacent wetland sites. A rapid identification of these indicator species during a transect walk by wetland managers can form the basis of appropriate sustainable Afrotropical wetland management planning.
2. Materials and methods
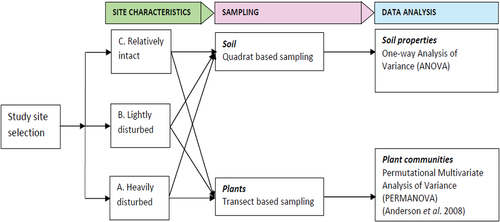
illustrates a flow chart summarizing the research methodology. Details of the methodology follow in sections 2.1 to 2.4.
Figure 1. Flow chart of research methodology used in the study (authors construct).
2.1. Study area
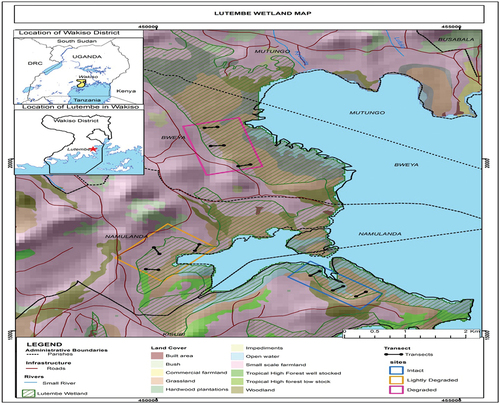
The research was performed in the Lutembe Bay Wetland, Uganda (). The Afrotropical wetland (latitude 00° 10’ N and longitude 32° 34’ E) is situated in Wakiso District (central Uganda) in the sub-counties of Ssisa and Katabi, and in the parishes of Namulanda, Bweya and Kisubi. It covers about 98 ha (Kalema, Citation2005; WMD, Citation2015) and is located approximately 25 km south of Kampala (Uganda’s capital city), at altitudes ranging from 1140 to 1160 metres above sea level. The mean annual rainfall is 1320 mm, though in many areas of the lake zone it ranges between 1750 and 2000 mm. Lutembe Bay is a Ramsar site (No. 1637) and an Important Bird Area (IBA). It is situated at the Murchison Bay (also known as the mouth of Lake Victoria), between Kampala and Entebbe urban areas where the Kinawataka Stream flows into Lake Victoria and has several tributaries draining into it from, for example, Lumpewo, Kisubi bay and Kachindo wetlands. This shallow area is almost completely cut off from the main body of Lake Victoria by Cyperus papyrus islands. Lutembe Bay Wetland has been affected by industrial and commercial developments and conversion of land for agriculture and settlements, and sand and clay mining. Some parts on the northwest of the landward side of Lutembe Bay Wetland have been recently cleared for horticultural farming, hence resulting in reduction in wetland cover, changes in wetland hydrology, pollution and sedimentation. With urban populations increasing, food production from the uplands cannot meet increasing food demand due to soil exhaustion and reduced fertility associated with the upland farming; thus, wetlands are seen as the most coherent environment in which to close this gap (Tijani et al., Citation2011).
Figure 2. Location of transects and study sites in the Lutembe Bay Wetland, Uganda (adapted from WMD, Citation2015).
Although there is an urgent need to prevent wetland loss and degradation in this biodiversity hotspot, the effects of anthropogenic degradation on physico-chemical soil properties and patterns of plant species communities within the Lutembe Bay Wetland have been under-studied, and standardized plant species to monitor their ecological conditions is lacking. Since most studies published have been on wetlands either outside the Afrotropical realm (Behn et al., Citation2018), or require multiple variables not routinely assessed by wetland management field practitioners (Behn et al., Citation2018; Macfarlane et al., Citation2020), this is a common knowledge gap in Afrotropical wetlands. This study was designed to address the knowledge gap, providing wetland managers with indicator plants to rapidly infer the level of degradation of a wetland for evidence-based management.
2.2. Site selection
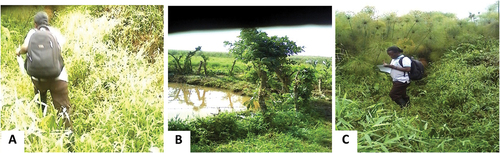
Soils and plant species were sampled from three differently disturbed wetland sites, i.e. the lightly disturbed located in Namulanda Parish, heavily disturbed in Bweya Parish and relatively intact site in Kisubi Parish (). These sites were identified based on the topographic map and Google Earth remote sensing imagery of Lutembe Bay Wetland.
Figure 3. (A) Heavily disturbed with food crop cultivation, (B) lightly disturbed with a fishpond, and (C) relatively intact wetland of Lutembe Bay (author shown in photos for scale).
In the context of this study, the definition of wetland degradation followed Harding (Citation2005) and was based on the percentage cover of wetland perimeter with native and exotic vegetation plant species. A heavily disturbed wetland was defined as a wetland with <30% of native vegetation cover and with ≥75% of exotic species (Harding, Citation2005). A lightly or moderately disturbed wetland was defined as a wetland having between 30% and 75% native vegetation cover with few exotics, whereas a ‘relatively intact wetland’ was defined as a permanent wetland with ≥75% of native vegetation cover. An ecotone was defined herein as a wetland area within the 200 m boundary of the low water mark (The Uganda National Environment-Wetlands, River Bank and Lake Shores Management regulations, No. 3/2000, under section 107 of the National Environmental Act Cap 153).
2.3. Vegetation and soil sampling
In each study site, three transects of 100 m long were established. Six plots (quadrats) of 2 m × 2 m were laid systematically on alternating sides along each transect, separated by a distance of 16 m, resulting in 18 plots per site. Within each quadrat, the plant species occurring were identified and recorded. The majority of the plant species were identified in the field by a qualified botanist, and for a few cases the voucher specimen was collected and identified at the Makerere University Herbarium. The plant species and family names were confirmed using the online database Tropicos (www.tropicos.org) and the APG IV (Citation2016) respectively.
Samples of soil were systematically collected from three quadrats, i.e. from the first, third and sixth quadrats along each transect. Soil samples were scooped from a depth of 10 cm using a 2-cm-diameter soil auger. The samples from the three plots were thoroughly mixed to yield one composite sample per transect (resulting in nine soil samples, three samples per study site). Samples were air-dried for 48 h to halt biological transformation, ground with a pestle and mortar, and sieved through a 2-mm-mesh screen to remove coarse debris and stones. The air-dried soil sample from each transect were analysed for pH (measured by a digital pH meter in a suspension of 1:2.5 soil:water ratio), particle size or texture (Hydrometer method), organic matter (OM; potassium dichromate wet acid oxidation method), N (Total N by Kjeldahl method digestion), Average available P (Bray P1 method) and the exchangeable bases (Al, K, Na by Flame Photometry; Ca and Mg by Atomic Absorption Spectrophotometry). The soil analyses were conducted at the Soil Science Laboratory of Makerere University, Kampala.
2.4. Data analysis
One-way analysis of variance (ANOVA) with Tukey’s HSD test was used to determine the statistical significance of locations on soil physico-chemical properties. To assess sample completeness and to compare patterns of total wetland plant species richness among the three study sites (heavily disturbed, lightly disturbed, and relatively intact), we generated sample-based species accumulation plots (and their 95% confidence intervals) with Estimate S 9.1 (Colwell, Citation2013). For each study plot, the number of species per plot (species density) was calculated with PRIMER-E, version 6 (Clarke & Gorley, Citation2006). Differences among the three sites in species density were tested with one-way ANOVA followed by Tukey post-hoc tests with IBM SPSS Statistics, Version 23 (IBM Corporation, Armonk, NY, USA).
The study employed a Permutational Multivariate Analysis of Variance (PERMANOVA) + routine of program Primer-E, with distance Jaccard Similarity Index (Anderson et al., Citation2008) to determine whether there were differences in plant communities among the three wetland sites. PERMANOVA was conducted with 999 random permutations using method ‘unrestricted permutation of raw data’ and Type III sums of squares. The Non-metric MultiDimensional Scaling (NMDS) ordination was used to visualize the patterns in plant community composition among the three study sites. NMDS was performed using species presence-absence per site matrix and the Jaccard Index similarity matrix. To assess the variance represented by each axis, we calculated the coefficient of determination (expressed as a percentage) between distances in the ordination space and distances in the original space using the Jaccard similarity matrix (McCune & Grace, Citation2002). A similarity percentages routine (SIMPER, in PRIMER-E, version 6 (Clarke & Warwick, Citation2001)) was used to identify plant species that contributed most to the average dissimilarity between paired sites.
To identify wetland plant species that characterize each of the sites, calculations were based on a simplified indicator species analysis based on binary (presence-absence) data (Bakker, Citation2008), using the formula proposed by Dufrêne and Legendre (Citation1997) as follows:
Indicator species (IVij) = Aij × Bij ×100
Where Aij is the positive predictive value of a species (also called specificity) calculated as = nij/ni, where nij is the number of samples in group j occupied by species i, ni is the total number of samples occupied by species i. Bij is the relative frequency of the species, and is calculated from the formula = nij/nj, where nij is the number of samples in group j occupied by species i, and nj is the total number of samples in group j. Indicator Values (IV) range between 0 and 1, with higher values for stronger indicators. Only species with IV > 0.25 were considered good indicators (Dufrêne & Legendre, Citation1997).
3. Results
3.1. Soil physico-chemical properties
shows the soil pH range and the mean values of the nutrients for the three wetland habitat sites and shows the actual values of soil parameters. Results were compared with the critical levels recommended by Okalebo et al. (Citation2002). The pH values significantly differed only marginally (p = 0.046, ) among the three wetland sites. The soil pH of all the sites was less than 7 and ranged from 4.6 in the relatively intact wetland site to 5.9 in the heavily degraded site. The pH values at the relatively intact wetland site were within the recommended range (5.5-6-5) while for the heavily degraded site all the pH values were within the recommended range. However, for the lightly degraded site, all the pH values were generally below the recommended range.
Table 1. Soil pH range and statistical significance of the effects of sites on soil properties based on one-way ANOVA (ns = not significant; s*= significant with p < 0.05; s**= significant with p < 0.01). Values are means ± SE
Table 2. Soil analysis results in the three study wetland sites (mean values from transects)
The nitrogen content showed a highly significant difference (p = 0.024) among the three wetland sites. The total nitrogen content ranged from 0.15% in the heavily degraded wetland to 0.25% in the lightly degraded wetland. A pairwise comparison indicated that there was no significant difference in the mean values between the relatively intact and lightly degraded sites. However, the lightly degraded site recorded a higher nitrogen content than the heavily degraded site (p < 0.05, Tukey HSD). Generally, the nitrogen content was slightly above the recommended critical value of >0.2% in the relatively intact wetland, whereas it was below the recommended levels in both the heavily degraded and lightly degraded sites (). There were no significant differences in the mean values of Sand, Clay, Sodium, Magnesium, Potassium, Calcium and average Phosphorous among the three wetland sites (). All the transects in the three sites had below the recommended Potassium levels (>3 moles/kg) in the soil. The results revealed a similar trend for Calcium, Magnesium and Sodium. However, for Phosphorous, the values were above the recommended levels of >15 ppm in the heavily degraded site. In the relatively intact site, Phosphorous was generally low, i.e. below the recommended level of >15ppm. The Phosphorous concentration in the rest of the sites was above the critical limit of >15 ppm (). The Organic Matter content varied significantly among the three sites (p = 0.022). The mean values of Organic Matter content ranged from 4.4% in the lightly degraded site to 2.5% in the heavily degraded site, respectively. The Organic Matter content in both the lightly and heavily degraded sites was below the recommended level of 3%, but it was above the recommended level (3%) in the relatively intact wetland. The mean values for silt in the heavily degraded sites were significantly higher than in the lightly degraded and relatively intact wetland sites ().
3.2. Wetland plant communities and potential indicator species
A total of 114 plant species, representing 33 families, were sampled in the 54 plots ( in Appendix). The species accumulation curves of the three study areas nearly reached asymptotes for all the three sites (). Based on the eighteen samples of rarefied species richness (the largest shared number of plots across study areas) and their 95% confidence interval (CI), the total species richness was significantly higher in the heavily disturbed and in the lightly disturbed wetland sites compared to the relatively intact wetland (). However, there was no significant difference in the plant species density among the three wetland sites (one-way ANOVA: F 2, 51 = 2.2, p = 0.119).
Figure 4. Sample-based rarefaction curves for the three wetland sites in the Lutembe Bay Wetland, Uganda. Samples represent plant species recorded in each quadrat.
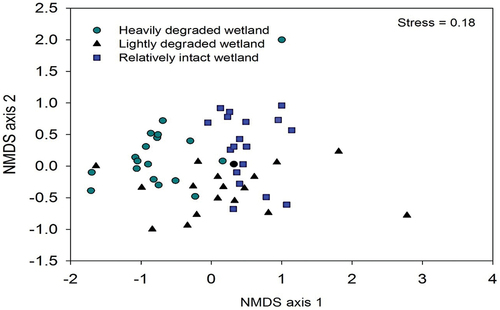
The community composition of plants differed significantly among the three wetland sites (PERMANOVA, pseudo-F2,51 = 7.8, p = 0.001, stress = 0.18) as illustrated by the NMDS ordination (), and wetland site explained 38% of the variation in communities of plants. The first two axes of this ordination accounted for 35% of the variation (axis 1 = 23%, axis 2 = 12%). According to the pair-wise tests, all wetland sites differed from each other significantly (p < 0.001). From SIMPER analysis, three plant species that made the strongest contributions to differences in the species composition between the heavily disturbed and lightly disturbed wetland sites were Bidens pilosa (4.9%), Commelina benghalensis (4.2%) and Cyperus papyrus (4.0%). Pteridium aquilinium (4.6%), Cyperus papyrus (3.8%) and Leersia hexandra (3.7%) contributed most to the observed differences between the lightly disturbed and relatively intact sites. The plant species that made the strongest contributions to differences between the heavily disturbed and relatively intact sites were Bidens pilosa (5.1%), Pteridium aquilinium (4.1%), Commelina benghalensis (3.9%) and Cyperus papyrus (3.8%).
Figure 5. Non-metric MultiDimensional Scaling (NMDS) ordination of plant communities using species presence-absence data and a Jaccard distance matrix among the three wetland sites in the Lutembe Bay Wetland in Wakiso, Uganda. Each point is a single plot (n = 18 for each wetland site).
Dufrêne-Legendre Indicator species analysis showed that three species, namely: Cyperus papyrus (indicator value, IV = 0.33), Pultenaea setulosa (0.33) and Fuirena umbellata (0.25) (13% of total indicator species in all the sites) characterized the lightly disturbed wetland site (). Thirteen plant species (57% of the total indicator species) characterized the heavily disturbed site; the strongest indicators included Bidens pilosa (0.69), Commelina benghalensis (0.67) and Ageratum conyzoides (0.52) (). Others included: Euphorbia heterophylla (0.45), Phragmites mauritianus (0.41), Digitaria abyssinica (0.34), Amaranthus hybridus subsp. cruentus (0.33), Kyllinga alba (0.33), Leersia hexandra (0.31), Adenostemma caffrum (0.28), Cyperus luteus (0.28), Glycine wightii (0.28) and Cyperus cyperoides (0.27) (). Seven species (30% of the total indicator species), namely, Pteridium aquilinum (0.52), Spermacoce latifolia (0.39), Miscanthus violaceus (0.30), Cyphostemma adenocaule (0.29), Cyperus papyrus (0.28), Pentarrhinum insipidum (0.28) and Phyllanthus niruri (0.28) characterized the relatively intact wetland site ().
4. Discussion
4.1. Effect of degradation on soil physico-chemical characteristics
The lower values of OM and the rest of the soil parameters tested in the three wetland sites could be due to the presence of human activities (in the relatively degraded and heavily degraded sites) or past human activities in the relatively intact wetland. The impact of human activities, especially cultivation, has also been reported in the Lubigi Wetland and elsewhere (Kadoma et al., Citation2023; Omagor & Barasa, Citation2018; Nyombi, Citation2008). Clearing of the wetland vegetation exposes the land to solar radiation resulting in increased temperatures, groundwater loss, and eventually rapid decomposition of organic matter (Salimi et al., Citation2021). In agreement with results of this study, a decrease in organic matter content was similarly observed under conversion of salt marshes to dry lands in a similarly degraded environment elsewhere (Li et al., Citation2022; Mirabito & Chambers, Citation2023). In addition, several previous studies (Asongwe et al., Citation2016; Głowacz & Niżnikowski, Citation2018; Hailu et al., Citation2020; Osinuga & Oyegoke, Citation2019) have shown that replacement of natural vegetation with agriculture or grazing often leads to de-stabilization of soils. Consequently, various forms of anthropogenic habitat transformation in the heavily degraded wetland might explain the high sediment/silt inputs through increased surface runoff flows and erosion during rain events. Overall, the wetland degradation is consistent with results of the significant change in the percentage of silt among the three sites ().
Results in a pH range of 4.6 to 5.9 reflect a suitability for maximum phosphorus availability to plants, soil moisture content, Phosphorus-absorbing capacity of soils and the clay contents (Tisdale and Rucker 1964 in Okalebo et al., Citation2002). Hence, total nitrogen decreased markedly following wetland degradation, but total phosphorous (an indicator of soil fertility) was not affected. The total Nitrogen () was generally low to medium following the ratings provided by Landon (Citation1984), where values below 0.2% are low, between 0.2% and 0.5% medium, above 0.5% high. The total nitrogen content was low in the relatively intact and the heavily degraded but moderate in the lightly degraded sites. The low to moderate Nitrogen content indicates that the soils are very poor. These results are consistent with those of Li et al. (Citation2014) and Ye et al. (Citation2022), in coastal wetlands of northern China, where long-term reclamation significantly decreased total nitrogen at the surface layer (0–30 cm) but had no significant effect on total Phosphorous. The soil storages of total Nitrogen and total Phosphorous are a counterbalance of inputs (such as productivity and fertilizer) and outputs (e.g. loss of mineralization and harvest) during a certain period. The rate of inputs and outputs in soils is sensitive to environmental changes and human disturbances.
Wetland degradation substantially alters the soil environmental conditions by breaking the balance of inputs and outputs. Thus, the decrease in total nitrogen observed in this study suggests that the outputs were much larger than inputs. The reasons for the identified difference in total phosphorous among the three wetland sites can be attributed to application of fertilizers during cultivation of crops, especially in the heavily degraded and lightly degraded wetland sites. Additionally, phosphorous has poor mobility and is easily fixed in the soil when the pH is high or low. The input and output of Phosphorous in the soil is usually a result of fertilizer application and crop harvesting, respectively (Jamal et al., Citation2023; Lu et al., Citation2020). Thus, results of the difference in the impacts of wetland degradation on total Phosphorous may be explained by fertilizer application and crop harvesting in the wetlands.
4.2. Effect of degradation on wetland plant communities and identification of indicator species
The results indicate that wetland degradation significantly increased the total plant species richness. This finding tends to suggest that following degradation, several new species emerge as secondary vegetation. This result coincides with a study in South-Bench district, Southwest Ethiopia (Mulatu et al., Citation2014), where a higher number of species (48 species) were recorded in cultivated wetland site than in the uncultivated sites (29 species). According to Tijani et al. (Citation2011), emergence of secondary vegetation introduces several other new species into the wetland ecosystem. These new species mostly emerge after human activities such as farming, brick making, construction, and other practices that result into clearance of native vegetation. Like Nyombi (Citation2008), Omagor and Barasa (Citation2018) reported that after several seasons of cultivation in the Lubigi Wetland (another tropical wetland in Uganda), several weeds such as Bidens pilosa and Commelina benghalensis subsequently emerged. Furthermore, a new grass species Vossia cuspidata also emerged due to the altered hydrology (i.e. fluctuation in water level, depths and duration of water detention) of the wetlands. Species richness may increase tropical wetland plant community resilience after disturbance (Carvalho et al., Citation2013), and this will need to be studied further in the Lutembe Bay Wetland. However, one major limitation of this study was that only one observation site was sampled for each wetland degraded site. Nevertheless, our observation sites demarcated were large enough and were well sampled. According to Hulbert (Citation1984), in studies involving very large-scale systems (i.e. whole wetland system) such as this study when replication is costly, experiments involving un-replicated sites may be the only option.
Additionally, the results provide evidence that anthropogenic wetland degradation can lead to changes in wetland plant species composition. Such compositional differences could be due to differences in the species-specific traits (Suding et al., Citation2008; Wang et al., Citation2022); for example, the recolonization efficiency of individual plant species, and the extent and degree of degradation among the sites. These results are consistent with others (Chen et al., Citation2019; Hotaiba et al., Citation2023; Imdad et al., Citation2023; Li et al., Citation2014; Mohler et al., Citation2006) who present evidence that wetland vegetation types and species compositions can be used to assess ecosystem health and the wetland’s ability to fulfill ecological functions. Thus, impacts on the hydrological regime—especially changes in water level, flood frequency and duration mainly through digging of drainage channels and reduction in groundwater—can, in turn, affect wetland vegetation (Engida et al., Citation2021; Phethi & Gumbo, Citation2019; Zhang et al., Citation2023), and wildlife habitats (Hatamkhani & Moridi, Citation2023). In conjunction with all the above, studies by Vesselly et al. (Citation2022) in Uganda, and Kalema (Citation2008) in Africa’s Sio-Siteko trans-boundary wetland ecosystem between Kenya and Uganda, noted significant variations in the composition of plant communities across encroached and intact wetlands, including those that were within the same locality.
Finally, the results showed that different wetland sites in Lutembe Bay are characterized by different specific wetland plant species, which could be employed in future wetland management, especially in Afrotropical areas. Applying this finding to rapidly assess a wetland and infer the level of degradation for evidence-based management is a new observation. The heavily disturbed site was characterized by early successional wetland annuals such as Bidens pilosa, perennial species Commelina benghalensis and the introduced/invasive Ageratum conyzoides, agreeing with results from studies in other wetlands (e.g. Napaldet & Buot, Citation2019; Twesigye et al., Citation2011). Meanwhile, the relatively intact and lightly disturbed sites were characterized by native perennial emergent macrophyte sedges, Cyperus papyrus and Miscanthidium violaceum, which are known to dominate in permanently flooded swamps in tropical Africa (Kayima & Mayo, Citation2018; Saunders et al., Citation2012; Twesigye et al., Citation2011).
5. Conclusion and policy implications
The present study has revealed that continued unsustainable wetland degradation can lead to changes in soil properties and plant species composition, emphasizing the need to restore the anthropogenically disturbed parts of the wetlands and to prevent further degradation of less degraded areas. Differently disturbed wetland sites in Lutembe Bay are characterized by different specific wetland plant species, which could be employed as indicator species in future sustainable wetland management, especially in Afrotropical areas.
While most of the soil properties (pH, OM, N, P, Na, K, Ca and Mg) were identified to be below or within the recommended ranges; the most affected wetland study site was the ‘heavily degraded’ which confirms a correlation between wetland degradation and loss in soil nutrient status. Where there was observed degradation of the natural wetland, there was also evidence of cultivation of crops; this implies that the degradation was a result of human activities rather than natural causes. The study highlights that anthropogenic disturbance is one of the main reasons for wetland degradation.
Based on the findings, strategic restoration efforts of wetlands can be undertaken. Information generated by this study can enrich a Wetland Information System to be useful in the formulation of scientifically sound management conservation strategies based on the rapid identification of indicator species to infer and categorize degradation status. Similar approaches can be used for other Afrotropical wetlands for which information is lacking.
Disclosure statement
No potential conflict of interest was reported by the author(s).
Data availability statement
All related data is contained within the article.
Additional information
Funding
References
- Achieng, A. O., Arhonditsis, G. B., Mandrak, N., Febria, C., Opaa, B., Coffey, T. J., Masese, F. O., Irvine, K., Ajode, Z. M., Obiero, K., Barasa, J. E., & Kaunda-Arara, B. (2023). Monitoring biodiversity loss in rapidly changing Afrotropical ecosystems: An emerging imperative for governance and research. Philosophical Transactions of the Royal Society of London Series B, Biological Sciences, 378(1881), 20220271. https://doi.org/10.1098/rstb.2022.0271
- Alikhani, S., Nummi, P., & Ojala, A. (2021). Urban Wetlands: A review on ecological and cultural values. Water, 13(22), 3301. 47pp. https://doi.org/10.3390/w13223301
- Anderson, M. J., Gorley, R. N., & Clarke, K. R. (2008). PERMANOVA+ for PRIMER: Guide to software and statistical methods. PRIMER-E, Ltd.
- APG IV. (2016). An update of the angiosperm phylogeny group classification for the orders and families of flowering plants: APG IV. Botanical Journal of the Linnean Society, 181(1), 1–14. https://doi.org/10.1111/boj.12385
- Asongwe, G. A., Yerima, B. P. K., & Tening, A. S. (2016). Spatial variability of selected physico-chemical properties of soils under vegetable cultivation in urban and peri-urban wetland gardens of Bamenda municipality, Cameroon. African Journal of Agricultural Research, 11(2), 74–86. https://doi.org/10.5897/AJAR2015.10401
- Asumadu, G., Quaigrain, R., Owusu-Manu, D., Edwards, D. J., Oduro-Ofori, E., Kukah, A. S. K., & Nsafoah, S. K. (2023). Analysis of risks factors associated with construction projects in urban wetlands ecosystem. International Journal of Sustainable Development and World Ecology, 30(2), 198–210. https://doi.org/10.1080/13504509.2022.2130465
- Bakker, J. D. (2008). Increasing the utility of indicator species analysis. Journal of Applied Ecology, 45(6), 1829–1835. https://doi.org/10.1111/j.1365-2664.2008.01571.x
- Barakagira, A., & de Wit, A. H. (2019). The role of wetland management agencies within the local community in the conservation of wetlands in Uganda. Environmental & Socio-Economic Studies, 7(1), 59–74. https://doi.org/10.2478/environ-2019-0006
- Behn, K., Becker, M., Burghof, S., Möseler, B., Kyalo, D., & Alvarez, M. (2018). Using vegetation attributes to rapidly assess degradation of East African wetlands. Ecological Indicators, 89, 250–259. https://doi.org/10.1016/j.ecolind.2018.02.017
- Bosma, C., Glenk, K., & Novo, P. (2017). How do individuals and groups perceive wetland functioning? Fuzzy cognitive mapping of wetland perceptions in Uganda. Land Use Policy, 60, 181–196, ISSN 0264-8377, https://doi.org/10.1016/j.landusepol.2016.10.010
- Businge, Z. (2017). Drivers of wetland degradation in Western Uganda and Iceland, and how they are addressed in current policies and legal frameworks. United Nations University Land Restoration Training Programme [ final project] http://www.unulrt.is/static/fellows/document/businge2017.pdf
- Byamukama, W., & Kiyawa, S. A. (2019). Sustainable Management and Conservation of Wetland Resources in Uganda: A Review. Journal of Environment and Health Science, 5(1), 47–51. https://doi.org/10.15436/2378-6841.19.2479
- Carvalho, P., Thomaz, S. M., Kobayashi, J. T., & Bini, L. M. (2013). Species richness increases the resilience of wetland plant communities in a tropical floodplain. Austral Ecology, 38(5), 592–598. https://doi.org/10.1111/aec.12003
- Chen, W., Cao, C., Liu, D., Tian, R., Wu, C., Wang, Y., Qian, Y., Ma, G., & Bao, D. (2019). An evaluating system for wetland ecological health: Case study on nineteen major wetlands in Beijing-Tianjin-Hebei region, China. Science of the Total Environment, 666, 1080–1088. https://doi.org/10.1016/j.scitotenv.2019.02.325
- Clarke, K. R., & Gorley, R. N. (2006). PRIMER v6: User Manual/Tutorial. PRIMER-E, Ltd.
- Clarke, K. R., & Warwick, R. M. (2001). Change in Marine Communities: An Approach to Statistical Analysis and Interpretation (2nd ed.). PRIMER-E, Ltd.
- Colwell, R. K. (2013). EstimateS9.1.0 User Guide. http://purl.oclc.org/estimates
- Dufrêne, M., & Legendre, P. (1997). Species assemblages and indicator species: The need for a flexible asymmetrical approach. Ecological Monographs, 67(3), 345–366. https://doi.org/10.1890/0012-9615(1997)067[0345:SAAIST]2.0.CO;2
- Engida, T. G., Nigussie, T. A., Aneseyee, A. N., Barnabas, J., & Abakumov, E. (2021). Land use/land cover change impact on hydrological process in the upper baro basin, Ethiopia. Applied and Environmental Soil Science Volume 2021, Article ID, 2021, 6617541. https://doi.org/10.1155/2021/6617541
- Finlayson, C. (2007). Managing Wetland Ecosystems: Balancing the water needs of ecosystems with those for people and agriculture. In C. King, J. Ramkissoon, M. Clüsener-Godt, & Z. Adeel (Eds.), Water and Ecosystems: Managing Water in Diverse Ecosystems to Ensure Human Well-being (2 edn., pp. 23–38). UNU-INWEH.
- Głowacz, K., & Niżnikowski, R. (2018). The effect of animal grazing on vegetation and soil and element cycling in nature. Environmental Science and Pollution Research International, 25(4), 3565–3570. https://doi.org/10.1007/s11356-017-0740-5
- Hailu, A., Mammo, S., & Kidane, M. (2020). Dynamics of land use, land cover change trend and its drivers in Jimma Geneti District, Western Ethiopia. Land Use Policy, 99, 105011. https://doi.org/10.1016/j.landusepol.2020.105011
- Harding, C. L. (2005). Wetland Inventory for the Fleurieu Peninsula, South Australia. Department for Environment and Heritage, Adelaide, 64.
- Hatamkhani, A., & Moridi, A. (2023). A Simulation Optimization Approach for Wetland Conservation and Management in an Agricultural Basin. Sustainability, 15(18), 13926. https://doi.org/10.3390/su151813926
- Hotaiba, A. M., Salem, B. B., & Halmy, M. W. A. (2023). Assessment of Wetland ecosystem’s health using remote sensing – case study: Burullus wetland – ramsar site. Estuaries & Coasts, 47(1), 201–215. https://doi.org/10.1007/s12237-023-01274-y
- Hulbert, S. H. (1984). Pseudoreplication and the design of ecological field experiments. Ecological Monographs, 54(2), 197–211. https://doi.org/10.2307/1942661
- Imdad, K., Sahana, M., Ravetz, J., Areendran, G., Gautam, O., Dwivedi, S., Chaudhary, A., & Sajjad, H. (2023). A sustainable solution to manage ecosystem health of wetlands in urban and peri-urban areas of Lucknow district, India using geospatial techniques and community based pragmatic approach. Journal of Cleaner Production, 414, 137646. https://doi.org/10.1016/j.jclepro.2023.137646
- Jamal, A., Saeed, M. F., Mihoub, A., Hopkins, B. G., Ahmad, I., & Naeem, A. (2023). Integrated use of phosphorus fertilizer and farmyard manure improves wheat productivity by improving soil quality and P availability in calcareous soil under subhumid conditions. Frontiers in Plant Science, 14, 1034421. https://doi.org/10.3389/fpls.2023.1034421
- Kabiri, S., Allen, M., Okuonzia, J. T., Akello, B., Ssabaganzi, R., & Mubiru, D. N. (2020). Detecting level of wetland encroachment for urban agriculture in Uganda using hyper-temporal remote sensing. AAS Open Research, 3, 18. https://doi.org/10.12688/aasopenres.13040.2
- Kadoma, A., Perry, M., & Renaud, F. G. (2023). Stakeholders’ perceptions of wetland conservation and restoration in Wakiso District, Uganda. Environment, Development and Sustainability. Environment, Development and Sustainability. https://doi.org/10.1007/s10668-023-04008-z
- Kaffashi, S., Shamsudin, M. N., Radam, A., Rahim, K. A., & Yacob, M. R. (2013). We are willing to pay to support wetland conservation: Local users’ perspective. International Journal of Sustainable Development World Ecology, 20(4), 325–335. https://doi.org/10.1080/13504509.2013.800612
- Kakuru, W., Turyahabwe, N., & Mugisha, J. (2013). Total Economic Value of Wetlands Products and Services in Uganda. The Scientific World Journal, 2013, 192656. https://doi.org/10.1155/2013/192656
- Kalema, J. (2005). Diversity and Distribution of Vascular Plants in Uganda’s Important Bird Areas [ Doctoral Dissertation]. Makerere University,
- Kalema, J. (2008). Assessment of plants of the Sio-Siteko wetland system, a trans-boundary ecosystem in the Busia Districts of Uganda and Kenya. Unpublished report to the nile basin initiative for management planning of the sio-siteko wetland system.
- Kayima, J. K., & Mayo, A. W. (2018). Characteristics of macrophytes in the Lubigi Wetland in Uganda. International Journal of Biodiversity and Conservation, 10(10), 394–406. https://doi.org/10.5897/IJBC2018.1206
- Landon, J. R. (1984). Booker Tropical Soil Manual: A Handbook for Soil Survey and Agriculture Evaluation in the Tropics and Sub-Tropics. Longman.
- Li, M., Zhang, K., Yan, Z., Liu, L., Kang, E., & Kang, X. (2022). Soil water content shapes microbial community along gradients of wetland degradation on the Tibetan plateau. Frontiers in Microbiology, 13, 824267. https://doi.org/10.3389/fmicb.2022.824267
- Li, W., Tan, R., Yang, Y., & Wang, J. (2014). Plant diversity as a good indicator of vegetation stability in a typical plateau wetland. Journal of Mountain Science, 11(2), 464–474. https://doi.org/10.1007/s11629-013-2864-5
- Lu, X., Mahdi, A. K., Han, X. Z., Chen, X., Yan, J., Biswas, A., & Zou, W. X. (2020). Long-term application of fertilizer and manures affect P fractions in Mollisol. Scientific Reports, 10(1), 14793. https://doi.org/10.1038/s41598-020-71448-2
- Macfarlane, D. J., Ollis, D. J., & Kotze, D. C. (2020). WET-Health 2.0 a refined suite of tools for assessing the present ecological state of wetland ecosystems – Technical Guide. WRC Report No. TT 820/20 Water Research Commission.
- Malick, A. K. J. (2004). Environmental and social management framework for Kampala industrial business park (KIBP) at Namanve. Uganda Investment Authority, E936, 13–15.
- McCune, B., & Grace, J. B. (2002). Analysis of ecological communities (p. 300). MjM Software Design.
- Mehari, A. K. (2023). Ecological State of Tropical Wetlands Under Different Human Disturbances (Lake Tana, Ethiopia) [ PhD Thesis]. Vrije Universiteit Brussel,
- Mirabito, A. J., & Chambers, L. G. (2023). Quantifying mineral-associated organic matter in wetlands as an indicator of the degree of soil carbon protection. Geoderma, 430, 116237. https://doi.org/10.1016/j.geoderma.2023.116327
- Mkonda, M. Y. (2022). Sustainable management of wetlands in east Africa: A case of Akagera Wetland in the north-western Tanzania. Environmental and Sustainability Indicators, 16(100210, ISSN 2665-9727, 100210. https://doi.org/10.1016/j.indic.2022.100210
- Mohler, C. L., Marks, P. L., & Gardescu, S. (2006). Guide to the plant communities of the Central Finger Lakes region. New York State Agricultural Experiment Station.
- Mulatu, K., Hunde, D., & Kissi, E. (2014). Impacts of wetland cultivation on plant diversity and soil fertility in South-Bench District, Southwest Ethiopia. African Journal of Agricultural Research, 9(39), 2936–2947. https://doi.org/10.5897/AJAR2013.7986
- Napaldet, J., & Buot, J. I. (2019). Diversity of aquatic macrophytes in balili river, la Trinidad, Benguet, Philippines as potential phytoremediators. Biodiversitas Journal of Biological Diversity, 20(4), 1048–1054. https://doi.org/10.13057/biodiv/d200416
- Ndiyoi, M., Wood, A. (2008). Striking a Balance (SAB): Maintaining seasonal wetlands and their livelihood contributions in Central Southern Africa. Proceedings of a lessons learning and advocacy workshop. Wetland Action, Self-Help Africa, FAIR, MALEZA, NLWCCDP. Lusaka, Zambia. Available via http://gjournals.org/GJEMPS/Publication/2014/July/HTML/1212131026%20Hardlife%20et%20al.htm#sthash.Sbr3NUhw.dpuf.
- Nyombi, M. (2008). Assessment of Threats to Flora and Fauna in Wetland Ecosystems. A Case Study of Lubigi Wetland [ M.Sc. Thesis]. Makerere University,
- Okalebo, J. R., Gathua, K. W., & Woomer, P. L. (2002). Laboratory Methods for Soil and Plant Analysis: A Working Manual. Tropical Soil Biology and Fertility Programme (TSBF).
- Omagor, G., & Barasa, B. (2018). Effects of Human Wetland Encroachment on the Degradation of Lubigi Wetland System, Kampala City Uganda. Environment and Ecology Research, 6(6), 562–570. https://doi.org/10.13189/eer.2018.060606
- Osinuga, O. A., & Oyegoke, C. O. (2019). Degradation assessment of wetlands under different uses: Implications on soil quality and productivity. African Journal of Agricultural Research, 14(1), 10–17. https://doi.org/10.5897/AJAR2018.12981
- Phethi, M. D., & Gumbo, J. R. (2019). Assessment of impact of land use change on the wetland in Makhitha village, Limpopo province, South Africa. Jamba (Potchefstroom, South Africa), 11(2), 693. https://doi.org/10.4102/jamba.v11i2.693
- Salimi, S., Saaan, A., & Scholz, M. (2021). Impact of climate change on wetland ecosystems: A critical review of experimental wetlands. Journal of Environmental Management, 286, 112160. https://doi.org/10.1016/j.jenvman.2021.112160
- Saunders, M. J., Kansiime, F., & Jones, M. B. (2012). Agricultural encroachment: Implications for carbon sequestration in tropical African wetlands. Global Change Biology, 18(4), 1312–1321. https://doi.org/10.1111/j.1365-2486.2011.02633.x
- Suding, K. N., Lavorel, S., Chapin, F. S., III, Cornelissen, J. H. C., Diaz, S., Garnier, E., Goldberg, D., Hooper, D. U., Jackson, S. T., & Navas, M.-L. (2008). Scaling environmental change through the community-level: A trait-based response-and-effect framework for plants. Global Change Biology, 14(5), 1125–1140. https://doi.org/10.1111/j.1365-2486.2008.01557.x
- Tijani, M. N., Olaleye, A. O., & Olubanjo, O. O. (2011). Impact of Urbanization on Wetland Degradation: A Case Study of Eleyele Wetland, Ibadan, South West, Nigeria. Proceedings of the Environmental Management Conference (pp. 435). Federal University of Agriculture, Abeokuta, Nigeria.
- Twesigye, C. K., Onywere, S. M., Getenga, Z. M., Mwakalila, S. S., & Nakiranda, J. K. (2011). The impact of land use activities on vegetation cover and water quality in the lake victoria watershed. The Open Environmental Engineering Journal, 4(1), 66–77. https://doi.org/10.2174/1874829501104010066
- UNDP. (2016). Uganda Wetlands Atlas. Government of Uganda.
- USEPA. (2013). Why wetlands are important. United States Environmental Protection Agency. Available via http://www.epa.gov/wetlands
- Vesselly, K. B., Opio, A., Mwanjalolo, M., & Kansiime, F. (2022). Effects of water level on plant characteristics in a restored wetland and referenced natural wetland in Wakiso, Uganda. African Journal of Environmental Science and Technology, 16(5), 155–163. https://doi.org/10.5897/AJEST2018.2637
- Wang, L., Wang, X., An, Y., Song, T., Tong, S., & Wang, X. (2022). Effects of Land Use Changes on the Plant Community Characteristics in the Wetlands of the Semi-Arid Regions. Diversity, 14(12), 1049. https://doi.org/10.3390/d14121049
- WMD. (2015). Wetlands Day Commemoration Programme. Wetlands Management Department, Ministry of Water and Environment.
- WRI. (2005). Millenium Ecosystem Assessment. Ecosystems and human well-being: Wetlands and water synthesis. World Resources Institute.
- Ye, S., Pei, L., He, L., Xie, L., Zhao, G., Yuan, H., Ding, X., Pei, S., Yang, S., Li, X., & Laws, E. A. (2022). Wetlands in China: Evolution, Carbon Sequestrations and Services, Threats, and Preservation/Restoration. Water, 14(7), 1152. https://doi.org/10.3390/w14071152
- Zhang, G. (2012). The effects of changes in hydrological regimes and salinity on wetland vegetation: A review. Shengtai Xuebao/Acta Ecologica Sinica, 32(13), 4254–4260. https://doi.org/10.5846/stxb201106140791
- Zhang, K. F., Li, X. W., Zhou, W. H., Zhang, D. X., & Yu, Z. R. (2006). Land resource degradation in China: Analysis of status, trends and strategy. International Journal of Sustainable Development & World Ecology, 13(5), 397–408. https://doi.org/10.1080/13504500609469689
- Zhang, X., Liu, Y., Zhao, W., Li, J., Xie, S., Zhang, C., He, X., Yan, D., & Wang, M. (2023). Impact of Hydrological Changes on Wetland Landscape Dynamics and Implications for Ecohydrological Restoration in Honghe National Nature Reserve, Northeast China. Water, 15(19), 3350. https://doi.org/10.3390/w15193350
Appendix
Table A1. Wetland plant species and their Dufrêne and Legendre’s (Citation1997) indicator value indices (IndVal) in each study site in the Lutembe Bay Wetland, Uganda. Indicator plant species in each wetland site are highlighted in bold.