
 ?Mathematical formulae have been encoded as MathML and are displayed in this HTML version using MathJax in order to improve their display. Uncheck the box to turn MathJax off. This feature requires Javascript. Click on a formula to zoom.
ABSTRACT
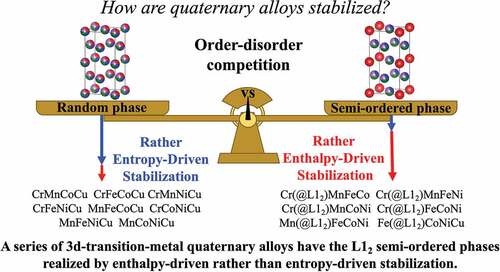
We use high-throughput first-principles sampling to investigate competitive factors that determine the crystal structure of high-entropy alloys (HEAs) and the energetics dependence of the stable phase on the atomic configuration of ‘semi-ordered’ L12, D022, and random solid solution (RSS) phases of equiatomic quaternary alloys comprising four of the six constituent elements (Cr, Mn, Fe, Co, Ni, and Cu). Note that, generally, an FCC lattice consists of four L12/D022 sublattices. In this study, we call ‘semi-ordered’ phase a FCC lattice where one of the L12/D022 sublattices is fully occupied by a certain element, whereas the others are randomly occupied by the other elements like RSS. Considering the configurational entropy, we demonstrate that valence electron concentration (VEC) and temperature are crucial to determine the phase stability of HEAs at finite temperatures, wherein the ‘rather enthalpy-driven’ ordered phases are energetically more favorable than ‘rather entropy-driven’ RSS phases. Some D022 phases with high VEC are energetically more stable than L12 phases, though both phases are metastable. Furthermore, we explore magnetic configurations to identify the origin of the enthalpy term. The calculations reveal that ordered phases comprising antiferromagnetic atoms surrounded by ferromagnetic atoms are energetically stable. Relationships between magnetic ordering and atomic arrangements are also discussed.
GRAPHICAL ABSTRACT
1. Introduction
High-entropy alloys (HEAs) [Citation1,Citation2] have been gaining increasing attention because of their novel material properties that cater to a wide range of applications. Although HEAs were originally applied to structural materials that required both strength and ductility [Citation3–7], their recent applications have been extended to other functional materials, such as catalysis [Citation8], superconductors [Citation9], radiation resistance materials [Citation10], and magnetic materials [Citation11,Citation12]. These extensions of their applications represent a new direction of materials design based on the fundamental and key concept of ‘high-entropy’. Along with this new direction, the comprehensive understanding of atomic arrangements on HEA crystal structures is crucial for exploiting their potential applications [Citation13]. This implies that the atomistic characterization of HEA structures is challenging for both ‘experiments’ and ‘theories/computations’, in terms of ‘spatial resolutions’ [Citation14] and ‘computational costs for vast amounts of possible atomic configurations’ [Citation15,Citation16], respectively.
It is considered that HEAs have random solid solutions (RSSs) instead of ordered phases. Although disordered face-/body-centered cubic (FCC/BCC) phases (A1/A2) have been reported as single HEA phases [Citation17], ordered FCC/BCC (L12/B2) and hexagonal close-packed (HCP, A3) have also been found [Citation18–20]. For example, the L12 phase of HEA means a FCC lattice having of four L12 sublattices where one of the L12 sublattices is fully occupied by a certain element, whereas the others are randomly occupied by the other elements like RSS. In this study, we call this kind of ordered HEA phases ‘semi-ordered’. Although there are a few examples of semi-ordered phases, perfect randomness in some types of HEAs has been excluded in several studies. For example, short range order (SRO) in HEAs has been reported [Citation21–24]; however, the existence of long-range order (LRO) is rarely discussed and remains a controversial topic [Citation25,Citation26].
In the present study, we systematically elucidate atomistic randomness in HEAs using a simple model of LRO. To the best of our knowledge, there exist several examples. For instance, one of the typical ordered HEA phases is CrFeCoNi, with the L12 structure [Citation26], wherein the antiferromagnetic Cr atoms occupy the ordered lattice sites surrounded by randomly distributed ferromagnetic Ni, Fe, and Co atoms. This can be interpreted as a spin-driven stabilization of the atomic configuration, which indicates that enthalpy enhancement by magnetization cooperates partial randomness and then overcomes the entropy because of perfect randomness. This was theoretically predicted [Citation26–28] and verified experimentally only for the ‘surface’ using scanning transmission electron microscopy (STEM) [Citation26]; experimental verifications for the ‘bulk’ have not been feasible because the constituent atoms are adjoining elements in the periodic table and have similar chemical properties and comparable radii, which makes them indistinguishable when using spectroscopic methods [Citation14]. Thus, the question arises if the spin-driven stabilization is unique for CrFeCoNi or if it generally holds for other quaternary alloys. To address this issue from a microscopic perspective, instead of experiments, first-principles approaches are the most relevant for identifying atomistic structures of HEAs and investigating their various properties [Citation29–32], though the previous studies dealt with only single composites.
We systematically focus on 3d-transition-metal-based quaternary alloys with Cr, Mn, Fe, Co, Ni, and Cu as the constituent elements by ‘high-throughput’ first-principles sampling: a total of different types of composites with nine phases are considered (shown later in ), for each of which 100 structures are generated. These elements are the most commonly used magnetic HEA constituents [Citation19], and all quaternary alloy combinations that results from them can be speculated to have the FCC phase [Citation33]. Therefore, they are expected to be disordered/RSSs as their atomic sizes and the nature of chemical bonds formed by them are similar. Our first-principles study revealed that differences in their magnetic properties with respect to CrFeCoNi lead to different magnetic orderings: our target phases were not restricted to only RSSs and L12 ordered phases; they extended to the D022 ordered phases as well (shown later in ), motivated by well-known studies on order–disorder phase competition in ordered alloys [Citation34–39]. The L12 and D022 phases are ordered crystal structures for 25:75 at.% FCC alloys. As prototype systems for the ordered phases, their phase competition has been well investigated for conventional alloys in terms of valence electron concentration (VEC) [Citation34,Citation35]. For example, the L12 phase of intermetallic compounds is observed for VEC
7.5. However, to the best of our knowledge, there is no previously reported study on their counterpart for HEAs; in HEAs, VEC values are known to correlate well with structure types (FCC/BCC structures prefer higher/lower VEC values) [Citation40–43]. Thus, we analyze the RSS–L12–D022 thermodynamical competition in the 3d-transition-metal quaternary system in terms of VEC. In order to systematically understand the RSS–L12–D022 competition for the 15 different composites, we performed the high-throughput first-principles sampling from one RSS phase and four types of L12 and D022, i.e. 8 semi-ordered phases. For example, in the case of MnCoNiCu case, Mn, Co, Ni, and Cu can be occupied on the ordered sites in semi-ordered phases for L12 and D022, respectively. (See the horizontal axis of ). We found that composites with lower VEC values tend to have semi-ordered phases over wide temperature ranges; however, for higher VEC values, RSSs emerge as the temperature increases. In addition, we discuss the distribution of the magnetic moment at the first nearest neighbor site and the constituent elements in our HEAs.
Figure 1. Crystal structures of (a) L12 (Cu3Au-type, space group , no. 221), (b) D022 (Al3Ti-type, space group
, no. 139), and (c) RSS for quaternary alloys. Labels indicate the first, second, third, and fourth nearest neighbor sites from the red site located at the cubic corner.
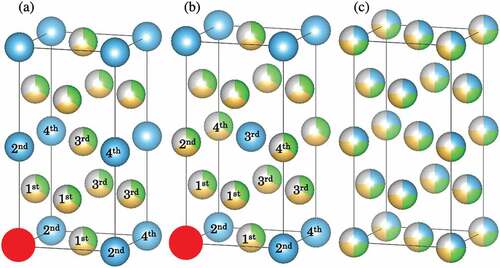
Figure 2. Free energy of formation at 1,000 K for MnCoNiCu. Error bars indicate the standard deviations (SD) for each phase. The free energies of formation for the other 14 alloys are shown in Figure S-3 (Supplementary Information).
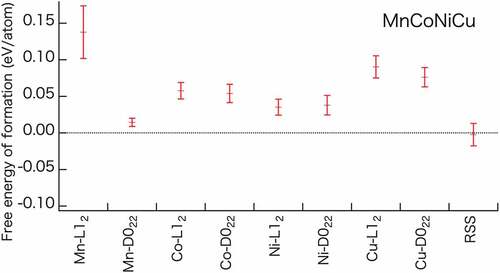
Table 1. Temperature dependence of the most stable structures for 15 cases of equiatomic quaternary systems (column name: ‘Composite’) investigated in the present study. VECave corresponds to the average valence electron concentration of the composite, where Cr, Mn, Fe, Co, Ni, and Cu have VEC values of 6, 7, 8, 9, 10, and 11, respectively. represents the average melting temperature of the four elements that comprise the composite. OP0 represents the semi-ordered phase possessing the lowest energy at 0 K. For example, Cr-L12 indicates the semi-ordered phase wherein the semi-ordered lattice positions are occupied by Cr. (NB: This does not necessarily mean the semi-ordered phase has a lower energy than the RSS.)
(X = L12, D022, RSS) indicates the temperature at which phase
is stabilized, i.e. its free energy of formation becomes zero.
represents a ‘crossover’ temperature between the semi-ordered phase OP0 and RSS.
(eV/atom) denotes the free energy of formation at
.
represents the temperature range up to
, wherein either one of the semi-ordered phases or the RSS phase is realized as the most stable solid phase (MSSP). All temperatures are listed in Kelvin (K).
The paper is organized as follows: Computational details in the present study are given in ‘Methods’. In ‘Results’, we start with our main finding ‘Order–disorder competition’, followed by ‘Energetics’, ‘Magnetic ordering’, and ‘Relationship between structures and properties’. ‘Summary and future prospects’ summarizes our findings and their significance towards further investigation in HEAs.
2. Methods
2.1. HEA structural models
HEAs have been regarded as solid solutions, wherein every site in the crystal structure is randomly occupied by the constituent elements. However, it is difficult to reproduce such a random configuration with a small simulation cell size. Therefore, finding an appropriate method to mimic the configuration of HEAs under a limited periodic condition is crucial for theoretical investigations. This problem can be solved by evaluating the correlation functions of the atomic configurations in HEAs. For instance, Zunger et al. proposed the concept of special quasirandom structures (SQSs) [Citation44], which are supercell approximations for a disordered system optimized to mimic the random local atomic environment. Therefore, the SQS approach is widely applied to HEA research because it provides a good approximation for the RSS phase. However, it is difficult to discuss the energetics and phase stability of HEAs in detail using only one configuration obtained from the SQS model. It has previously been reported that applying several SQS configurations of HEAs leads to non-negligible energy fluctuations (0.01–0.02 eV/atom) [Citation1,Citation45]. For example, several sampling calculations are required to discuss the phase stability of HCP and FCC phases in CrCoNi and CrMnFeCoNi (cf. (a,b) in Ref [Citation45]). We performed high-throughput first-principles sampling to provide insights regarding the phase stability of HEAs with high accuracy and reliability for overcoming the disadvantage of using a single configuration in the SQS approach. For detail, see the next Section 2.2.
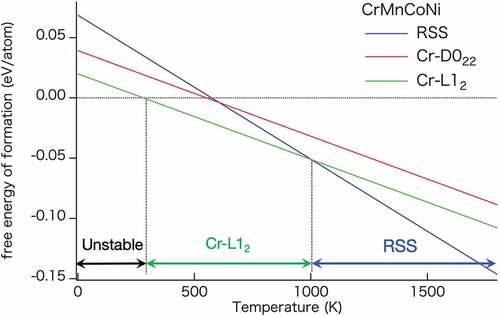
Figure 3. Free energy of formation of CrMnCoNi quaternary alloy as a function of temperature up to its melting temperature (1,799 K). Blue, red, and green lines indicate the RSS, Cr-D022, and Cr-L12 semi-ordered phases, respectively.
In addition to the RSS phases, our main concern is to investigate semi-ordered phases, L12 and D022. Crystal structures of the ordered and disordered phases are shown in , which were drawn using the VESTA software [Citation46]. The L12 and D022 phases have typical ordered crystal structures in the 25:75 (at.%) FCC binary alloys. For example, the L12 structure can be observed in many alloys with a 3:1 composition, such as Cu3Au, Ni3Al, and TiPt3; similarly, the D022 structure can be observed in trialuminides Al3 (Sc, Ti, V) and Ni3V. Although the appearance of the L12 and D022 phases in FCC binary alloys has been discussed previously, only a few studies have focused on the configuration of the neighboring sites in multiprincipal-element alloys [Citation26]. The number of first, second, third, and fourth nearest neighbor sites in the L12 and D022 phases are 12, 6, 24, and 12, respectively (shown later in ). The 25 at.% element in the L12 and D022 phases is not located at the first nearest neighbor sites, and thus, they can be isolated from each other and surrounded by the 75 at.% elements. For instance, Au atoms in the L12 phase of Cu3Au are not located at their first nearest neighbor sites and are surrounded by 12 Cu atoms. In our equiatomic quaternary alloys, the 25 at.% element occupies the ordered sublattice site, whereas the 75 at.% elements consist of three different 25 at.% elements occupying atomic sites besides the ordered sites, similar to the RSS phases. Thus, instead of using the SQS approach, their structural models were also determined by our procedure shown below.
Table 2. Comparison of the site occupancies of L12, D022, and RSS phases containing 25 at.% of ordered elements. For each neighbor site therein, the number of the ordered elements over the total number of the sites is given with its percentage in brackets. For the RSS phase, the site occupancy for any site is 25 at.% on average (shown in brackets).
Two-, three-, and four-body clusters were selected for a correlation function, with a short-range order (SRO) parameter [Citation47,Citation48]. Since the SRO parameter is defined for a pair of elements, an alloy with component is characterized by the set of
SRO parameters. Therefore, our quaternary alloy system involves six kinds of SRO parameters in general. In the present study, we dealt with a pair of same or different elements as four kinds of constituent elements to reduce the number of SRO parameters: The present study adopted a simplified Warren-Cowley SRO (WC-SRO) parameters (
) [Citation49] as our SRO parameters, which is defined as
where is the probability of finding an
pair of
-th and
-th elements in the
-body cluster, and
is the concentration of
-th elements. To describe the WC-SRO parameters for semi-ordered phases, L12 and D022, of equiatomic quaternary alloys, we set
and
to be the concentrations of same and different elements with
and
, respectively. The range of the WC-SRO parameters was restricted to the fourth nearest neighbor site for two-body clusters and to the third nearest neighbor site for three- and four-body clusters to reduce the computational time. The tetrahedron-octahedron approximation in the cluster expansion method for phase diagram calculation has been well established for FCC [Citation50], where only first and second nearest neighbor sites are considered. The present correlation function takes into account sites with more longer distances than those in the approximation. For the RSS phase, the configurations of four elements were explored to realize a better correlation function using the Metropolis algorithm [Citation51]. For both the semi-ordered and RSS phases, four elements were considered for evaluating the correlation function. In the L12 semi-ordered phase, one element was fixed at the cubic corner (CC) sites in the FCC lattice, while the other three elements in the quaternary system occupied the face-centered sites to realize an ideal L12 semi-ordered phase with a good correlation function. The D022 phase was also constructed in a similar manner.
A wide range of site occupancies was used to elucidate the influence of the number of first nearest neighbor sites on the formation energy. Accordingly, a large number of atomic configurations were randomly generated for RSS structures (shown later in ). To compute the formation energies and distributions of magnetic moments, our structural models of the quaternary alloys were set to be supercells with 32 sites (each element occupies 8 sites). To investigate dependence of the formation energies of semi-ordered and RSS phases on site occupancy, we also used
supercells with 256 sites (each element occupies 64 sites). We confirmed that their formation energy difference between the
and
supercells is much less than 0.001 eV/atom in the formation energy (e.g. 0.0002 eV/atom for CrFeCoNi). Note that the
supercell with less computational costs was used to achieve statistically reliable results, while the
supercell with higher costs was used to evaluate physical properties involving longer spatial correlations.
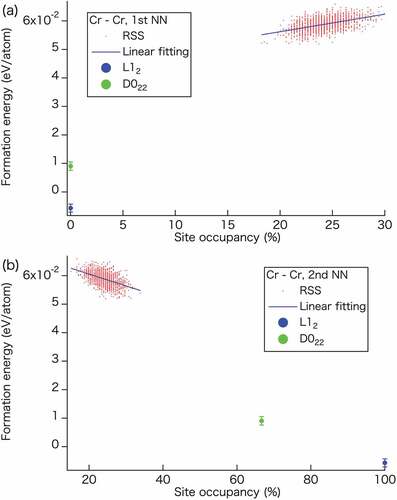
Figure 4. Dependence of the formation energies of semi-ordered and RSS phases in the CrFeCoNi alloy on the site occupancy of the Cr–Cr pairs at the (a) first and (b) second nearest neighbor sites. The red dots represent the RSS phase obtained using 1,500 samples, whereas the blue lines serve as guidelines. The blue and green dots indicate the Cr-L12 and Cr-D022 semi-ordered phases, respectively.
2.2. High-throughput first-principles sampling
The free energy of formation (shown later in ) for each phase was evaluated by the average and its standard deviation over 100 samples (configurations with a supercell). This statistical evaluation is more reliable than one sampling based on SQS. The same sampling dataset was used to obtain distributions of magnetic moments of the most stable semi-ordered phases for the 15 quaternary alloys (shown later in for (a) CrFeCoNi, (b) CrMnCoNi, (c) MnFeCoNi, and those for all alloys are given in Supplementary Information (SI)). To the best of our knowledge, we have, for the first time, discussed the phase stabilities in HEA from the viewpoint of the first-principles sampling. Figure S-2 shows the formation-free energies obtained using 100 configurations. The dependence of the formation energy on the site occupancy (shown later in ) and the bond-length distributions (shown later in ) for the CrFeCoNi quaternary alloy were obtained based on 1,500 and 100 configurations, respectively, using a
supercell.
Figure 5. Distribution of magnetic moments as a function of the average magnetic moment at the first nearest neighbor site in the most energetically stable semi-ordered phase for (a) CrFeCoNi, (b) CrMnCoNi, and (c) MnFeCoNi listed in as OP0. Red, orange, green, light blue, and dark blue indicate Cr, Mn, Fe, Co, and Ni, respectively. and
represent the magnetic moment for each atom and the average magnetic moment of the 12 first nearest neighbor sites, respectively. The corresponding distributions for the other 12 alloys are shown in Figure S-4 (Supplementary Information).
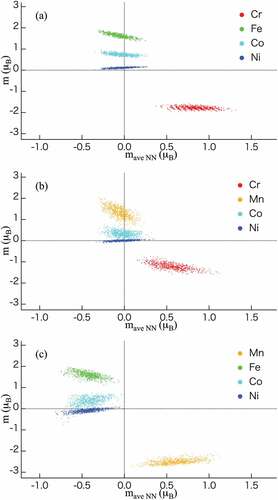
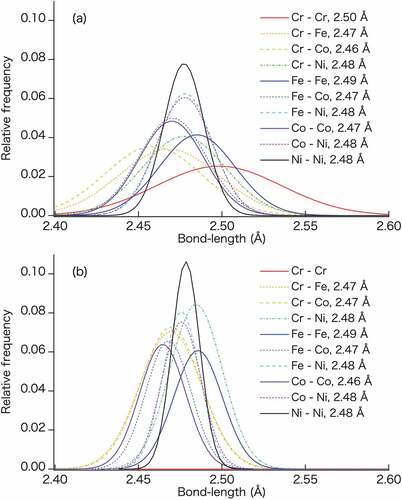
Figure 6. Relative frequency distribution of bond-lengths fitted with Gaussian function for each element pair in the (a) RSS phase and (b) Cr-L12 semi-ordered phase of the CrFeCoNi quaternary alloy after structure optimization. The bond lengths in the legends indicate the average values obtained upon fitting with the Gaussian function.
We carried out the high-throughput spin-polarized first-principles simulations based on DFT [Citation52] using the Vienna ab initio simulation package (VASP) by inputing all generated HEA models above [Citation53,Citation54]. The PBEsol functional [Citation55] was selected for the electronic structure calculations and geometry relaxation. Projector-augmented wave (PAW) [Citation56,Citation57] potentials were used to consider the interactions between the ion cores and valence electrons. The Brillouin zone was integrated using the Monkhorst–Pack method [Citation58] with a grid mesh for both the
and
supercells; this grid size was chosen by testing the convergence for
,
,
, and
; their differences are less than 0.001 eV/atom in the formation energy. In addition, the convergence of the relative energies were confirmed for cut-off energy, and the default values are large enough to achieve the 0.001 eV/atom accuracy with regard to the formation energy. For structural optimization, the convergence criteria for energy and force were set to be
eV and
eV/Å, respectively. The lattice parameter was set at 3.495 Å as an initial condition for structural optimization. As an initial condition, Fe, Co, Ni, and Cu were set as ferromagnetic, whereas Cr was set as antiferromagnetic. For systems without Cr, Mn was set as antiferromagnetic; otherwise, Mn was set as ferromagnetic as an initial condition because its magnetism is affected by Cr. The present computational method based on DFT is only eligible for obtaining the magnetic moments of constituent elements at 0 K. Therefore, we note that magnetization at finite temperature is beyond the scope.
2.3. Formation energy and free energy of formation
To discuss phase stability, the formation energy is defined as
Here, denotes the total energy per atom of the HEA with the alloying elements;
represents the fractions of the alloying elements; and
denote the energies per atom of the alloying elements
in their ground state structures, i.e. BCC Cr,
Mn, BCC Fe, HCP Co, FCC Ni, and FCC Cu, which are estimated by referring to the Open Quantum Materials Database [Citation59,Citation60]. A negative value of the formation energy implies that the HEA is stable, whereas a positive value implies that it is less stable than the ground states of the pure alloying elements.
Temperature is one of the most important factors that governs the phase stability of materials because most materials are used in a finite temperature range instead of being used at absolute zero [Citation61]. Here, the Helmholtz free energy is defined as
where denotes the internal energy, and the phonon vibration contribution includes the lattice vibration energy, i.e.
, and lattice vibration entropy, i.e.
. Further,
represents the atomic configurational entropy, and the last term
denotes the electronic-scale entropy contribution, which includes thermal excitation and spin polarization. In the current work, the total energy of each cell was computed within the DFT framework at 0 K, and no vibrational entropy was considered, because the vibrational contributions for both the semi-ordered and RSS phases were estimated and found to be comparable [Citation24,Citation62]. In previous studies [Citation24,Citation63,Citation64], contributions from the electronic (magnetic) entropy term were found to be negligibly small compared with the configurational entropy. Thus, the present study does not consider these entropy terms.
in the configurational entropy term is given by
, where
denotes the ratio between the number of atoms of a disordered component and the total number of disordered atoms, and
represents the gas constant. In this study, we introduced an equiatomic quaternary system and calculated
for the semi-ordered phases and
for the RSS phase. In other words, the RSS phase has a greater configurational entropy contribution. Therefore, the free energy of formation is calculated by
By definition, means that the corresponding phase is thermodynamically unstable (see ), thereby giving rise to the phase separation or the appearance of the other phases rather than those investigated in the present study: Although one of the investigated semi-ordered phases, L12, has been observed experimentally [Citation1,Citation26], there could exist the occurrence of phase separation and then the appearance of other phases with ordered structures in equiatomic high entropy alloys. In this sense, this study addresses the relative stability restricted to the RSS and the two semi-ordered phases.
3. Results
3.1. Order–disorder competition
One of the main objectives of this study is to investigate whether a semi-ordered phase (OP0) is more stabilized than the corresponding RSS for each studied quaternary alloy. That is, we intended to determine the ‘crossover’ temperature () at which the phase transition between the OP0 and RSS occurs for each composite of the quaternary alloy. Therefore, it is important to consider the configurational entropy term to discuss phase stability in HEAs in the finite temperature region. It is imperative to quantitatively analyze the influences of VEC and temperature on the stable HEA crystal structures for investigating the order–disorder competition and phase stability. This is because the enthalpy term defined at the absolute zero temperature correlates with VEC, whereas the entropy effect is temperature dependent; the most stable phase is determined by free energy, i.e. the sum of the enthalpy and entropy terms. Guo et al [Citation40,Citation41]. reported several HEA systems wherein the single FCC phase was stable in the region of VEC
, the single BCC phase was stable in the region of VEC
, and the mixed FCC and BCC phases appeared in the region of
. The average VEC values of magnetic HEAs are greater than 7.50, and therefore, they possess the FCC structure. The present study considers only single FCC phases in order to systematically elucidate a VEC dependence of their relative stability within the FCC crystal system, thereby clarifying our discussion. Hence, this study does not focus on the lattice type of magnetic HEAs, but on their magnetic orderings.
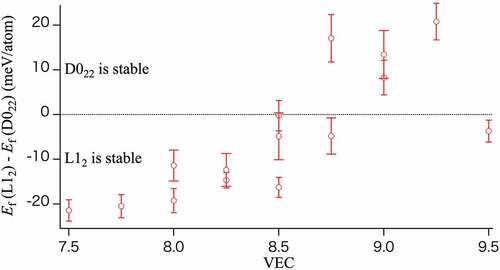
As a starting point, we shall look at the VEC-dependent stabilities within the semi-ordered phases, L12 and D022. indicates the difference of formation energy at 0 K between L12 and D022 for each composite as a function of VEC: , where
(L12) and
(D022) are, respectively, formation energies for L12 and D022, as given in EquationEquation (2)
(2)
(2) . Note that
(L12) and
(D022) involve error bars because each of them was averaged over 100 samples of the atomic configurations. From this figure, we can point out a trend that the D022 phases have lower energies than the L12 ones as the VEC value increases. At finite temperatures, the entropy terms contribute to this trend as temperature effects.
Figure 7. Difference of formation energy at 0 K between the L12 and D022 semi-ordered phases for each composite as a function of VEC.
lists the quaternary alloy composites investigated in this study (Composite), VEC and melting temperature averaged over the four constituent elements in the alloy (VECave and ), semi-ordered phase with the lowest energy at 0 K (OP0), temperature at which stability is attained for each phase (TS(X) (X = L12, D022, RSS)), ‘crossover’ temperature between the semi-ordered phase OP0 and RSS (
), and the corresponding free energy of formation at
(
). The most stable solid phase (MSSP) of each composite below
and the corresponding temperature range (
) are also listed in the table. To estimate the free energy of formation in EquationEquation (4)
(4)
(4) , we can consider the semi-ordered phases as a 75 at.% equiatomic ternary alloy for the configurational entropy term because one of the elements is completely located at a specific site (. Consequently, one element of the semi-ordered phases can be ignored for the number of the elements considering the configurational entropy term. Alternatively, the RSS phases need to be treated as a quaternary alloy. Accordingly, the slope of the free energy of formation for the RSS phase is steeper than that for the semi-ordered phases. The semi-ordered phases consequently appear gradually as the temperature increases (rather enthalpy-driven stabilization), and this is followed by the appearance of the RSS phases at higher temperatures (rather entropy-driven stabilization). The above discussion presupposes thermal equilibrium. Note that semi-ordered phases that thermally equilibrate at higher temperatures can appear even at ambient temperatures by non-equilibrium processing, i.e. rapid solidification and cooling [Citation65].
Herein we investigate the temperature dependence of the free energy of formation, , for the semi-ordered and disordered phases. As an example,
of CrMnCoNi is shown in ; the results for the other alloys as well as CrMnCoNi are shown in Figure S-1 (Supplementary Information). For the both semi-ordered phases, Cr-L12 and Cr-D022 are the most stable phase of each semi-ordered phase (Figure S-3 (3)). Therefore, we compare the free energies of formation of the Cr-L12 and Cr-D022 semi-ordered phases and the RSS phase up to
(1,799 K). The temperature dependence can be seen as follows:
Within the low-temperature region (up to 282 K), all semi-ordered and RSS phases exhibit a positive free energy of formation, and they are less stable than the corresponding ground state of each pure element.
At 282–1,003 K, Cr-L12 shows a negative free energy of formation, which is lower than those of the Cr-D022 and RSS phases. Therefore, Cr-L12 is the most stable phase in this temperature region.
Beyond 1,003 K, the RSS phase shows a lower free energy of formation than Cr-L12 and becomes a stable phase in the high-temperature region.
Meanwhile, the Cr-D022 phase does not appear as the most stable phase in the entire temperature range. Consequently, in the case of the CrMnCoNi quaternary alloy (), the L12 crystal structure appears as a semi-ordered phase in a specific temperature region.
Further, as shown in Figure S-1 and , the CrMnFeCo (1; ), CrMnFeNi (2;
), CrFeCoNi (5;
), MnFeCoNi (9;
), and FeCoNiCu (15;
) quaternary alloys exhibit the same phase transition between the L12 semi-ordered phase and RSS phase at a specific temperature. However, the CrFeCoNi (5;
) and MnFeCoNi (9;
) quaternary alloys exhibited the L12 structure at 0 K. Furthermore, the CrMnCoCu (6;
), CrFeCoCu (7;
), CrMnNiCu (8;
), CrFeNiCu (10;
), MnFeCoCu (11;
), CrCoNiCu (12;
), MnFeNiCu (13; VEC
), and MnCoNiCu (14;
), quaternary alloys show the RSS phase only below the melting temperature because of the small difference in the free energy of formation at 0 K (Figures S-1 (6)–(8) and (10)–(14)). The CrMnFeCu (4;
) quaternary alloy is unstable in the entire temperature range.
The results of this study are summarized as follows: The alloys without Cu as a constituent prefer the L12 semi-ordered phases for VEC values . The Mn-L12 semi-ordered MnFeCoNi (9) and the Fe- L12 semi-ordered FeCoNiCu (15) are also stable under a specific temperature. The free energy of formation of the D022 semi-ordered phases are lower than L12 semi-ordered phases for VEC values
, except for MnFeCoCu (11) and FeCoNiCu (15). However, D022 semi-ordered phases do not appear as the most stable structure, because there is no condition that the free energy of formation is negative and smaller than the RSS in the entire temperature range. In contrast, alloys with large VEC values and Cu as a constituent exhibit the RSS phases.
3.2. Energetics
A clear understanding of the energetics of each phase is important to determine the free energy of formation at a finite temperature for discussing the phase stability of HEAs. shows the average free energies of formation over 100 different configurations, with the standard deviation at 1,000 K for the MnCoNiCu alloy, each of which has eight types of semi-ordered phases and the RSS phase. Semi-ordered phases with the lowest energy at 0 K (OP0) for each quaternary alloy are listed in . For all quaternary alloys (Figure S-1), the free energy of formation of at least one semi-ordered phase is lower than that of the RSS phase at 0 K. Interestingly, the D022 semi-ordered phases exhibit a lower free energy of formation than the L12 semi-ordered phases in the high VEC region in some alloys. However, because the free energy of formation of D022 semi-ordered phases is not negative below the RSS value, the D022 phases are not stable phase in the entire temperature range.
Four alloys with relatively high VEC values, CrFeNiCu (10; ), CrCoNiCu (12;
), MnFeNiCu (13;
), and MnCoNiCu (14;
) exhibit D022 semi-ordered phases with relatively lower energies than that of the L12 semi-ordered phases (see Figure S-3). These alloys demonstrate that the free energy of L12 increases remarkably, as a result, these free energies of formation show a positive value at 1,000 K. This result means that these semi-ordered structures are thermodynamically unstable, however, we compare the free energies of L12 and D022 to get insight of their competitions. Similar competitive behavior between the phase stability of L12 and D022 for a wide range of VECs was previously reported for Ni3V, Pd3V, and Pt3V, which are fundamental binary alloys, in contrast with HEAs [Citation35]. The VEC at which the crossover of the energy difference between the L12 and D022 phases occurs in this study (
) is comparable to the value reported for the previously studied binary system [Citation35]. One key result obtained from Figure S-3 is that the systems comprising Cu have high free energies of formation. Moreover, quaternary alloys in which Cu forms the semi-ordered phase entail higher free energies of formation of the semi-ordered phase than those of the RSS phase. We attribute the high energies of formation associated with Cu to the positive formation energies exhibited by the least energetic structures of the binary compounds consisting of Cu and 3d transition metals (Cr, Mn, Fe, Co, and Ni) [Citation66–68]. The present results are consistent with previous studies because as the number of bonding pairs between Cu and other 3d transition metals increased in the Cu-ordered phases (cf. ).
3.3. Magnetic ordering
illustrates the distribution of magnetic moments as a function of the average magnetic moment at the first nearest neighbor sites in the most stable semi-ordered phase for the CrFeCoNi alloy (Cr-L12). The results of other quaternary alloys are shown in Figure S-4 (Supplementary Information). It is worth pointing out the present calculation scheme can produce the distribution of magnetic moments of CrFeCoNi that is the similar result by Niu et al [Citation26]. In - 4, we observe certain common trends: ‘Cr’ and ‘Mn without Cr (see )’ show antiferromagnetic properties, ‘Mn with Cr (see )’, ‘Fe’, and ‘Co’ show ferromagnetic properties, and ‘Mn with a ferromagnetic moment’ shows values that can be compared to those of Fe. In contrast, Mn with antiferromagnetic properties behave similar to Cr. Therefore, the magnetic nature of Mn depends on the presence or absence of Cr. Ni and Cu exhibit nonmagnetic (paramagnetic) behavior in all systems. Ni in the MnFeCoNi (), MnFeNiCu (Figure S-4 (13)), and MnCoNiCu (Figure S-4 (14)) composites show a slightly negative magnetic moment as an exception. Although the magnetic moments are mostly similar, the magnetic moment distributions of some alloys show that the average magnetic moments at the first nearest neighbor sites are discrete; for example, at Cr and Fe in CrFeNiCu (), as shown in Figure S-4 (10). Such a discrete distribution can be attributed to the number of ferromagnetic or antiferromagnetic atoms located at the first nearest neighbor sites of the FCC lattice ( in [Citation26]). For example, the antiferromagnetic atoms in the semi-ordered phases are surrounded by four ferromagnetic atoms on average (see ).
Niu et al [Citation26] previously evaluated the magnetic moment of each element and the average magnetic moment of the 12 first nearest neighbor sites for the RSS and Cr-L12 semi-ordered phases of the CrFeCoNi quaternary alloy (), and they are the same as that of the composite shown in . The results obtained in this study demonstrate that Fe and Co exhibit ferromagnetic properties, whereas Cr exhibits anti-ferromagnetic properties. Since the results obtained are consistent with those reported previously [Citation26], the validity of the calculation methods described herein can be confirmed. Moreover, Niu et al. reported a discrete distribution of the average magnetic moments at the first nearest neighbor sites in the Cr-L12 semi-ordered phase. They revealed that the magnetism of Cr in the CrFeCoNi alloy is strongly influenced by the magnetism of the first nearest neighbor sites [Citation26]. For RSS phases of FCC-MnFeCoNi and FCC-CrMnFeCoNi alloys [Citation69], their magnetic moments of the individual atoms were investigated: Fe has a higher magnetic moment than Co; Ni and Cr exhibit a near-zero magnetic moment and antiferromagnetism, respectively; Mn atoms exhibit both ferromagnetism and antiferromagnetism with a wider distribution.
Ghazisaeidi et al. reported a similar magnetism distribution in the hexagonal close packed (HCP) and FCC phases of CrCoNi, FeCoNi, MnFeNi, MnCoNi, and CrMnFeCoNi [Citation45]. The magnetism of Cr and Mn atoms ranges from ferromagnetism to antiferromagnetism in the RSS phase. Fedorov et al [Citation70] and Schönfeld et al [Citation71] pointed out that the magnetic properties of the constituent elements are key factors governing phase stability and the formation of semi-ordered phases in 3d-transition-metal-based alloys.
3.4. Relationship between structures and properties
shows the relationship between the formation energy and site occupancy of Cr–Cr pairs at the first and second nearest neighbor sites in the RSS phase of the CrFeCoNi alloy. In the RSS phase, site occupancy by the same element can remain at 25 at.% on average at any nearest neighbor site. Meanwhile, the site occupancies for the semi-ordered phases depend on the nearest neighbor site, as can be seen in . For the first nearest neighbor sites (), the calculated results reveal a lowering of the energy with a decreasing site occupancy, such that the energy approaches the values corresponding to the L12 and D022 semi-ordered phases on extrapolation of the site occupancy to zero. However, for the second nearest neighbor sites (), an opposite trend is observed, i.e. the formation energies decrease with increasing site occupancy. The values for both semi-ordered phases can be found on the extrapolation line. These results imply that the configurations at the first and second nearest neighbor sites affect the formation energy of the CrFeCoNi alloy. Furthermore, the lower formation energies of the semi-ordered phases can be attributed to their unique site occupancies.
show the bond-length distributions in the RSS and Cr-L12 semi-ordered phases, respectively. In , the solid lines indicate pairs of same elements, whereas the dotted and dashed lines indicate those of different elements. Many 3d transition metals, especially Cr, Fe, Co, and Ni, exhibit comparable atomic radii. However, the CrFeCoNi alloy shows a different bond-length distribution. These results indicate that these element pairs have different interatomic distances. As shown in , the Cr–Cr pairs in the RSS phase exhibit a broad bond-length distribution and longer bond lengths than those corresponding to the first nearest neighbor sites, as estimated by the lattice constant. The bond lengths of the homogeneous element pairs are in a decreasing order of Cr, Fe, Ni, and Co. The same trend is observed for the Cr-L12 semi-ordered phase in . Notably, there are no Cr–Cr pairs in the Cr-L12 semi-ordered phase because Cr atoms occupy the sites constructing the framework of the L12 semi-ordered phase, and they are not located at the first nearest neighbor sites (). Although the structure optimization process is applied to all atoms in the Cr-L12 semi-ordered and RSS phases, the bond-length distributions of the Cr-L12 semi-ordered phase are narrower than those of the RSS phase.
Let us consider the half widths at half maximum (HWHM) of the fitted Gaussian functions. The HWHMs of Fe–Fe, Co–Co, and Ni–Ni in the L12 semi-ordered phases are 64.5%, 71.2%, and 68.6%, respectively, of the corresponding RSS phases. It is presumed that the Cr occupancy at the second nearest neighbor sites results in a small bond-length distribution with regularity. Gao and Alman used ab initio molecular dynamics (AIMD) simulations [Citation72] and reported that the Al1.3CrFeCoNiCu senary alloy exhibits a different distribution for each element pair, which is similar to the results obtained in this study for 3d-transition-metal-based equiatomic quaternary alloys. However, the HfNbTaTiZr quinary alloys show almost the same distribution for all its constituent elements without a 3d transition metal [Citation72]. In this study, we conclude that the bond-length distributions of the described systems are significantly different because each 3d transition metal has an individual magnetic behavior.
Summary and future prospects
Since 3d-transition-metal quaternary systems are base alloys for their extension to more multicomponent systems, a comprehensive understanding of their structures would serve as a stepping stone toward efficient HEA design. In this study, we performed first-principles calculations considering the configurational entropy term to investigate the effect of VEC and temperature on the stabilities of the two semi-ordered phases: L12 and D022. Further, we drew a comparison with the disordered atomic configurations in equiatomic quaternary alloys comprising Cr, Mn, Fe, Co, Ni, and Cu. We found that the VEC is a significant factor controlling phase stability in both semi-ordered phases. In the high-VEC region, the D022 semi-ordered phase is energetically more stable than the L12 semi-ordered phase, though both phases are metastable. The magnetic moments indicate that the anti-ferromagnetic Cr and Mn atoms are surrounded by the ferromagnetic Fe, Co, and Ni atoms located at the first nearest neighbor sites. Antiferromagnetic correlations tend to occupy positions more distant than the first nearest neighbor, which may be promoting ordering of L12/D022. Since the constituent elements corresponding to 25 at.% in the L12 and D022 semi-ordered phases exhibit no bonding between the first nearest neighbor sites, the extent of the combination of anti-ferromagnetic and ferromagnetic elements can be increased in the L12 and D022 phases. The bond-length distribution results reveal that the Cr–Cr distances are longer and the distributions are broader than those of other element pairs, which suggests that the high formation energy of the RSS phase can be attributed to the abnormal bond length between the anti-ferromagnetic atoms.
In this study, the enthalpy terms that describe structural properties were evaluated by first-principles calculations to obtain insight into an atomistic origin of the energetics of the 3d-transition-element HEAs. Since the entropy term is as important as the enthalpy term, the addition of a configurational entropy term in the density functional theory (DFT) calculations is effective for determining the crystal structure of HEAs. This enables us to estimate the transition temperatures between the semi-ordered and RSS phases, which is useful for obtaining the relationship between structure and processing. It is already widely recognized in the materials science field that the relationship among structures, properties, and processing methods is a crucial factor in realizing outstanding structural materials [Citation73]. For example, Kenel et al. designed a 3d-transition-metal HEA using a 3D printing technique [Citation74] with oxide nanopowder, which exhibits prominent mechanical properties at ambient and cryogenic temperatures [Citation75]. Furthermore, it is necessary to predict an accurate phase diagram of HEA by combining the calculation of the phase diagram (CALPHAD) [Citation76] and the first-principles based thermodynamic assessment [Citation77]. We believe that the systematic investigation described herein will be helpful for realizing such an assessment and for predicting the microstructures of HEA by performing model simulations such as ‘first-principles phase field model’ without any thermodynamic empirical parameters [Citation78].
Finally, we note that our theoretical approach is applicable to ‘ceramics’, ‘oxides’, and ‘carbide’, as well because the ‘high-entropy’ concept has been adopted even in them [Citation79–86]. Furthermore, the approach can be extended to the constituent phases of even multiprincipal element alloys (MPEAs) [Citation87,Citation88] and multiphase compositionally complex alloys (CCAs) [Citation89]. Thus, our finding and approach can encourage both experimentalists and theoreticians to investigate the microscopic identification of their structures.
Supplemental Material
Download PDF (1.1 MB)Disclosure statement
No potential conflict of interest was reported by the authors.
Supplementary material
Supplemental data for this article can be accessed online at https://doi.org/10.1080/27660400.2022.2153632.
Additional information
Funding
References
- Gao MC, Yeh JW, Liaw P, et al., editors. High-entropy alloys: fundamentals and applications. Switzerland: Springer; 2016.
- George E, Curtin W, Tasan C. High entropy alloys: a focused review of mechanical properties and deformation mechanisms. Acta Materialia. 2020;188:435–14. DOI:10.1016/j.actamat.2019.12.015.
- Varvenne C, Luque A, Curtin WA. Theory of strengthening in fcc high entropy alloys. Acta Materialia. 2016;118:164–176. DOI:10.1016/j.actamat.2016.07.040.
- Varvenne C, Leyson G, Ghazisaeidi M, et al. Solute strengthening in random alloys. Acta Materialia. 2017;124: 660–683. DOI: 10.1016/j.actamat.2016.09.046.
- Wei D, Li X, Schönecker S, et al. Development of strong and ductile metastable face-centered cubic single-phase high-entropy alloys. Acta Materialia. 2019;181: 318–330. DOI: 10.1016/j.actamat.2019.09.050.
- Maresca F, Curtin WA. Mechanistic origin of high strength in refractory bcc high entropy alloys up to 1900K. Acta Materialia. 2020;182:235–249. DOI:10.1016/j.actamat.2019.10.015.
- Han L, Rao Z, Souza Filho IR, et al. Ultrastrong and ductile soft magnetic high-entropy alloys via coherent ordered nanoprecipitates. Adv Mater. 2021;33(37):2102139. Available from: https://onlinelibrary.wiley.com/doi/abs/10.1002/adma.202102139
- Sun Y, Dai S. High-entropy materials for catalysis: a new frontier. Sci Adv. 2021;7(20). DOI:10.1126/sciadv.abg1600.
- Mizuguchi Y, Kasem MR, Matsuda TD. Superconductivity in CuAl2-type Co0.2Ni0.1Cu0.1Rh0.3Ir0.3Zr2 with a high-entropy-alloy transition metal site. Mater Res Lett. 2021;9(3):141–147. DOI:10.1080/21663831.2020.1860147.
- El-Atwani O, Li N, Li M, et al. Outstanding radiation resistance of tungsten-based high-entropy alloys. Sci Adv. 2019;5(3): DOI:10.1126/sciadv.aav2002.
- Kozak R, Sologubenko A, Steurer W. Single-phase high-entropy alloys – an overview. Z Kristallogr Cryst Mater. 2015;230(1):55–68. DOI:10.1515/zkri-2014-1739.
- Ma Y, Wang Q, Zhou X, et al. A novel soft-magnetic B2-based multiprincipal-element alloy with a uniform distribution of coherent body-centered-cubic nanoprecipitates. Adv Mater. 2021;33(14):2006723. Available from: https://onlinelibrary.wiley.com/doi/abs/10.1002/adma.202006723
- Savage N. Striking a balance with high-entropy alloys. Nature. 2021;595(7865):S4–S5. Available from: https://media.nature.com/original/magazine-assets/d41586-021-01788-0/d41586-021-01788-0.pdf
- Yao Y, Huang Z, Xie P, et al. Carbothermal shock synthesis of high-entropy-alloy nanoparticles. Science. 2018;359(6383):1489–1494. DOI:10.1126/science.aan5412.
- Lederer Y, Toher C, Vecchio KS, et al. The search for high entropy alloys: a high-throughput ab-initio approach. Acta Materialia. 2018;159: 364–383. DOI:10.1016/j.actamat.2018.07.042.
- Utimula K, Prayogo GI, Nakano K, et al. Stochastic estimations of the total number of classes for a clustering having extremely large samples to be included in the clustering engine. Adv Theory Simul. 2021;4(5):2000301. DOI:10.1002/adts.202000301.
- Chang X, Zeng M, Liu K, et al. Phase engineering of high-entropy alloys. Adv Mater. 2020;32(14):1907226. Available from: https://onlinelibrary.wiley.com/doi/abs/10.1002/adma.201907226
- Zhang Y, Zuo TT, Tang Z, et al. Microstructures and properties of high-entropy alloys. Pro Mater Sci. 2014;61:1–93.
- Miracle D, Senkov O. A critical review of high entropy alloys and related concepts. Acta Materialia. 2017;122:448–511.
- Rogal L, Bobrowski P, Körmann F, et al. Computationally-driven engineering of sublattice ordering in a hexagonal AlHfScTiZr high entropy alloy. Sci Rep. 2017;7(1):2209. DOI:10.1038/s41598-017-02385-w.
- Ding J, Yu Q, Asta M, et al. Tunable stacking fault energies by tailoring local chemical order in CrCoNi medium-entropy alloys. Proc Nat Acad Sci. 2018;115(36):8919–8924. Available from: https://www.pnas.org/content/115/36/8919
- Li QJ, Sheng H, Ma E. Strengthening in multi-principal element alloys with local-chemical-order roughened dislocation pathways. Nat Commun. 2019;10(1):3563. DOI:10.1038/s41467-019-11464-7.
- Zhang R, Zhao S, Ding J, et al. Short-range order and its impact on the CrCoNi medium-entropy alloy. Nature. 2020;581(7808):283–287. DOI:10.1038/s41586-020-2275-z.
- Sobieraj D, Wróbel JS, Rygier T, et al. Chemical short-range order in derivative Cr-Ta-Ti-V-W high entropy alloys from the first-principles thermodynamic study. Phys Chem Chem Phys. 2020;22:23929–23951. DOI:10.1039/D0CP03764H.
- Lucas MS, Wilks GB, Mauger L, et al. Absence of long-range chemical ordering in equimolar FeCoCrNi. Appl Phys Lett. 2012;100(25):251907. DOI:10.1063/1.4730327.
- Niu C, Zaddach AJ, Oni AA, et al. Spin-driven ordering of Cr in the equiatomic high entropy alloy NiFeCrCo. Appl Phys Lett. 2015;106(16):161906. DOI:10.1063/1.4918996.
- Middleburgh S, King D, Lumpkin G, et al. Segregation and migration of species in the CrCoFeNi high entropy alloy. J Alloys Compd. 2014;599: 179–182. DOI:10.1016/j.jallcom.2014.01.135.
- Fukushima T, Katayama-Yoshida H, Sato K, et al. Local energies and energy fluctuations — applied to the high entropy alloy CrFeCoNi. J Phys Soc Jpn. 2017;86(11):114704. Available from: https://doi.org/10.7566/JPSJ.86.114704
- Choi WM, Jo YH, Sohn SS, et al. Understanding the physical metallurgy of the CoCrFeMnNi high-entropy alloy: an atomistic simulation study. NPJ Comput Mater. 2018;4(1):1. DOI:10.1038/s41524-017-0060-9.
- Rickman JM, Chan HM, Harmer MP, et al. Materials informatics for the screening of multi-principal elements and high-entropy alloys. Nat Commun. 2019;10(1):2618. DOI:10.1038/s41467-019-10533-1.
- Yin B, Curtin WA. First-principles-based prediction of yield strength in the RhIrPdPtNiCu high-entropy alloy. NPJ Comput Mater. 2019;5(1):14. DOI:10.1038/s41524-019-0151-x.
- Witman M, Ek G, Ling S, et al. Data-driven discovery and synthesis of high entropy alloy hydrides with targeted thermodynamic stability. Chem Mater. 2021;33(11):4067–4076. DOI:10.1021/acs.chemmater.1c00647.
- Diao H, Feng R, Dahmen K, et al. Fundamental deformation behavior in high-entropy alloys: an overview. Curr Opin Solid State Mater Sci. 2017;21(5):252–266. Concentrated Solid Solution Alloys Perspective. Available from: https://www.sciencedirect.com/science/article/pii/S135902861730147X
- Bieber A, Ducastelle F, Gautier F, et al. Electronic structure and relative stabilities of L12 and D022 ordered structures occuring in transition metal alloys. Solid State Commun. 1983;45(7):585–590. Available from: https://www.sciencedirect.com/science/article/pii/0038109883904325
- Cabet E, Pasturel A, Ducastelle F, et al. L12-D022 competition in the pseudobinary (Pt,Rh)3, Pt3(V,Ti), and (Pd, Rh)3v alloys: phase stability and electronic structure. Phys Rev Lett. 1996 Apr;76(17):3140–3143. Available from: https://link.aps.org/doi/10.1103/PhysRevLett.76.3140
- Stolze K, Tao J, von Rohr FO, et al. Sc-Zr-Nb-Rh-Pd and Sc-Zr-Nb-Ta-Rh-Pd high-entropy alloy superconductors on a CsCl-type lattice. Chem Mater. 2018;30(3):906–914. DOI:10.1021/acs.chemmater.7b04578.
- He F, Chen D, Han B, et al. Design of D022 superlattice with superior strengthening effect in high entropy alloys. Acta Materialia. 2019;167: 275–286. DOI:10.1016/j.actamat.2019.01.048.
- Zhou N, Jiang S, Huang T, et al. Single-phase high-entropy intermetallic compounds (heics): bridging high-entropy alloys and ceramics. Sci Bull. 2019;64(12):856–864. SPECIAL TOPIC: Electromagnetic Metasurfaces: from Concept to Applications. Available from: https://www.sciencedirect.com/science/article/pii/S2095927319302919
- Zhang J, Yan J, Calder S, et al. Long-range antiferromagnetic order in a rocksalt high entropy oxide. Chem Mater. 2019;31(10):3705–3711. DOI:10.1021/acs.chemmater.9b00624.
- Guo S, Ng C, Lu J, et al. Effect of valence electron concentration on stability of fcc or bcc phase in high entropy alloys. J Appl Phys. 2011;109(10):103505. DOI:10.1063/1.3587228.
- Guo S, Liu C. Phase stability in high entropy alloys: formation of solid-solution phase or amorphous phase. Prog Nat Sci Mater Int. 2011;21(6):433–446. DOI:10.1016/S1002-0071(12)60080-X.
- Tian F, Varga LK, Chen N, et al. Empirical design of single phase high-entropy alloys with high hardness. Intermetallics. 2015;58: 1–6. DOI:10.1016/j.intermet.2014.10.010.
- Leong Z, Wróbel JS, Dudarev SL, et al. The effect of electronic structure on the phases present in high entropy alloys. Sci Rep. 2017;7(1):39803. DOI:10.1038/srep39803.
- Zunger A, Wei S-H, Ferreira LG, et al. Special quasirandom structures. Phys Rev Lett. 1990 Jul;65(3):353–356. DOI:10.1103/PhysRevLett.65.353.
- Niu C, LaRosa CR, Miao J, et al. Magnetically-driven phase transformation strengthening in high entropy alloys. Nat Commun. 2018;9(1):1363. DOI:10.1038/s41467-018-03846-0.
- Momma K, Izumi F. VESTA3 for three-dimensional visualization of crystal, volumetric and morphology data. J Appl Crystallogr. 2011 Dec;44(6):1272–1276. DOI:10.1107/S0021889811038970.
- Cowley JM. Short- and long-range order parameters in disordered solid solutions. Phys Rev. 1960 Dec;120(5):1648–1657. DOI:10.1103/PhysRev.120.1648.
- Cowley JM. Short-range order and long-range order parameters. Phys Rev. 1965 May;138(5A):A1384–A1389. DOI:10.1103/PhysRev.138.A1384.
- Ikeda Y, Grabowski B, Körmann F. Ab initio phase stabilities and mechanical properties of multicomponent alloys: a comprehensive review for high entropy alloys and compositionally complex alloys. Mater Charact. 2019;147:464–511. DOI:10.1016/j.matchar.2018.06.019.
- Sanchez JM, de Fontaine D. The fee ising model in the cluster variation approximation. Phys Rev B. 1978 Apr;17(7):2926–2936. DOI:10.1103/PhysRevB.17.2926.
- Metropolis N, Rosenbluth AW, Rosenbluth MN, et al. Equation of state calculations by fast computing machines. J Chem Phys. 1953;21(6):1087–1092. DOI:10.1063/1.1699114.
- Kohn W, Sham LJ. Self-consistent equations including exchange and correlation effects. Phys Rev. 1965 Nov;140(4A):A1133–A1138. DOI:10.1103/PhysRev.140.A1133.
- Kresse G, Furthmüller J. Efficiency of ab-initio total energy calculations for metals and semiconductors using a plane-wave basis set. Comput Mater Sci. 1996;6(1):15–50. DOI:10.1016/0927-0256(96)00008-0.
- Kresse G, Furthmüller J. Efficient iterative schemes for ab initio total-energy calculations using a plane-wave basis set. Phys Rev B. 1996 Oct;54(16):11169–11186. DOI:10.1103/PhysRevB.54.11169.
- Perdew JP, Ruzsinszky A, Csonka GI, et al. Restoring the density-gradient expansion for exchange in solids and surfaces. Phys Rev Lett. 2008 Apr;100(13):136406. DOI:10.1103/PhysRevLett.100.136406.
- Blöchl PE. Projector augmented-wave method. Phys Rev B. 1994 Dec;50(24):17953–17979. DOI:10.1103/PhysRevB.50.17953.
- Kresse G, Joubert D. From ultrasoft pseudopotentials to the projector augmented-wave method. Phys Rev B. 1999 Jan;59(3):1758–1775. DOI:10.1103/PhysRevB.59.1758.
- Monkhorst HJ, Pack JD. Special points for brillouin-zone integrations. Phys Rev B. 1976 Jun;13(12):5188–5192. DOI:10.1103/PhysRevB.13.5188.
- Saal JE, Kirklin S, Aykol M, et al. Materials design and discovery with high-throughput density functional theory: the open quantum materials database (oqmd). JOM. 2013;65(11):1501–1509. DOI:10.1007/s11837-013-0755-4.
- Kirklin S, Saal JE, Meredig B, et al. The open quantum materials database (oqmd): assessing the accuracy of DFT formation energies. NPJ Comput Mater. 2015;1(1):15010. DOI:10.1038/npjcompumats.2015.10.
- Zhou W, Sahara R, Tsuchiya K. First-principles study of the phase stability and elastic properties of Ti-X alloys (X = Mo, Nb, Al, Sn, Fe, Co, and O). J Alloys Compd. 2017;727:579–595. DOI:10.1016/j.jallcom.2017.08.128.
- van de Walle A, Ceder G, Waghmare UV. First-principles computation of the vibrational entropy of ordered and disordered Ni3Al. Phys Rev Lett. 1998 Jun;80(22):4911–4914. Available from: https://link.aps.org/doi/10.1103/PhysRevLett.80.4911
- Ma D, Grabowski B, Körmann F, et al. Ab initio thermodynamics of the cocrfemnni high entropy alloy: importance of entropy contributions beyond the configurational one. Acta Materialia. 2015;100: 90–97. DOI:10.1016/j.actamat.2015.08.050.
- Niu C, Rao Y, Windl W, et al. Multi-cell Monte Carlo method for phase prediction. NPJ Comput Mater. 2019;5(1):120. DOI:10.1038/s41524-019-0259-z.
- Yeh JW. Alloy design strategies and future trends in high-entropy alloys. JOM. 2013;65(12):1759–1771. DOI:10.1007/s11837-013-0761-6.
- Troparevsky MC, Morris JR, Kent PRC, et al. Criteria for predicting the formation of single-phase high-entropy alloys. Phys Rev X. 2015 Mar;5(1):011041. Available from: https://link.aps.org/doi/10.1103/PhysRevX.5.011041
- Kucza W. High entropy alloys and thermodynamically derived high stability alloys; a compositional comparative study of all 3–7 element systems composed of ten 3d metals at 1273 k. J Alloys Compd. 2022;894:162443. DOI:10.1016/j.jallcom.2021.162443.
- Takeuchi A, Inoue A. Classification of bulk metallic glasses by atomic size difference, heat of mixing and period of constituent elements and its application to characterization of the main alloying element. Mater Trans. 2005;46(12):2817–2829.
- Zuo T, Gao MC, Ouyang L, et al. Tailoring magnetic behavior of cofemnnix (X = Al, Cr, Ga, and Sn) high entropy alloys by metal doping. Acta Materialia. 2017;130: 10–18. DOI:10.1016/j.actamat.2017.03.013.
- Fedorov M, Wróbel JS, Fernández-Caballero A, et al. Phase stability and magnetic properties in Fe-Cr-Mn-Ni alloys from first-principles modeling. Phys Rev B. 2020 May;101(17):174416. DOI:10.1103/PhysRevB.101.174416.
- Schönfeld B, Sax CR, Zemp J, et al. Local order in Cr-Fe-Co-Ni: experiment and electronic structure calculations. Phys Rev B. 2019 Jan;99(1):014206. DOI:10.1103/PhysRevB.99.014206.
- Gao MC, Alman DE. Searching for next single-phase high-entropy alloy compositions. Entropy. 2013;15(10):4504–4519. Available from: https://www.mdpi.com/1099-4300/15/10/4504
- Xiong W, Olson GB. Cybermaterials: materials by design and accelerated insertion of materials. NPJ Comput Mater. 2016;2(1):15009. DOI:10.1038/npjcompumats.2015.9.
- Han C, Fang Q, Shi Y, et al. Recent advances on high-entropy alloys for 3d printing. Adv Mater. 2020;32(26):1903855. DOI:10.1002/adma.201903855.
- Kenel C, Casati NPM, Dunand DC. 3D ink-extrusion additive manufacturing of cocrfeni high-entropy alloy micro-lattices. Nat Commun. 2019;10(1):904. DOI:10.1038/s41467-019-08763-4.
- Saunders N, Miodownik A. Calphad (calculation of phase diagrams): a comprehensive guide. Elsevier Science; 1998. Available from: https://books.google.co.jp/books?id=ROnQVsNLZUAC
- Hanindriyo AT, Sridar S, Kumar KH, et al. Ab initio thermodynamic properties of certain compounds in Nd-Fe-B system. Comput Mater Sci. 2020;180:109696 Available from: https://www.sciencedirect.com/science/article/pii/S0927025620301877
- Bhattacharyya S, Sahara R, Ohno K. A first-principles phase field method for quantitatively predicting multi-composition phase separation without thermodynamic empirical parameter. Nat Commun. 2019;10(1):3451. DOI:10.1038/s41467-019-11248-z.
- Anand G, Wynn AP, Handley CM, et al. Phase stability and distortion in high-entropy oxides. Acta Materialia. 2018;146: 119–125. DOI:10.1016/j.actamat.2017.12.037.
- Sarkar A, Wang Q, Schiele A, et al. High-entropy oxides: fundamental aspects and electrochemical properties. Adv Mater. 2019;31(26):1806236. DOI:10.1002/adma.201806236.
- Harrington TJ, Gild J, Sarker P, et al. Phase stability and mechanical properties of novel high entropy transition metal carbides. Acta Materialia. 2019;166: 271–280. DOI:10.1016/j.actamat.2018.12.054.
- Ye B, Wen T, Nguyen MC, et al. First-principles study, fabrication and characterization of (Zr0.25Nb0.25Ti0.25V0.25)C high-entropy ceramics. Acta Materialia. 2019;170: 15–23. DOI:10.1016/j.actamat.2019.03.021.
- Oses C, Toher C, Curtarolo S. High-entropy ceramics. Nature Rev Mater. 2020;5(4):295–309. DOI:10.1038/s41578-019-0170-8.
- Kaufmann K, Maryanovsky D, Mellor WM, et al. Discovery of high-entropy ceramics via machine learning. NPJ Comput Mater. 2020;6(1):42. DOI:10.1038/s41524-020-0317-6.
- McCormack SJ, Navrotsky A. Thermodynamics of high entropy oxides. Acta Materialia. 2021;202:1–21. DOI:10.1016/j.actamat.2020.10.043.
- Hossain MD, Borman T, Oses C, et al. Entropy landscaping of high-entropy carbides. Adv Mater. 2021;33(42):2102904. DOI:10.1002/adma.202102904.
- Senkov ON, Miller JD, Miracle DB, et al. Accelerated exploration of multi-principal element alloys with solid solution phases. Nat Commun. 2015;6(1):6529. DOI:10.1038/ncomms7529.
- Zheng M, Ding W, Cao W, et al. A quick screening approach for design of multi-principal element alloy with solid solution phase. Materials Des. 2019;179: 107882. DOI:10.1016/j.matdes.2019.107882.
- Manzoni AM, Glatzel U. New multiphase compositionally complex alloys driven by the high entropy alloy approach. Mater Charact. 2019;147:512–532. DOI:10.1016/j.matchar.2018.06.036.