
ABSTRACT
To improve the charge – discharge properties of an LiMn2O4 positive electrode active material for a lithium-ion battery, the effect of additive elements was investigated using high-throughput experiments and materials informatics techniques. First, the material libraries of LiMn1.4NixAyBzO4±δ (A, B = Mo, Ir, Bi, Eu, Zn, Y, Ce, and Ru, x + y + z = 0.6, x, y, z = 0, 0.2, 0.4, 0.6) were synthesized by the ink-jet technique, and the properties were estimated using X-ray diffraction and X-ray absorption near-edge structure (XANES) spectroscopy at SPring-8. Appropriate additives were searched for by machine learning models using composition-based explanatory and experimentally obtained objective variables without completing the lithium-ion battery cell. Next, LiMn2O4 specimens containing the additives were synthesized by the solid-state reaction method, and then the charge – discharge properties were verified using the sandwich-type electrochemical cell. Based on the results, LiMn1.6Ni0.2Ir0.1Mo0.1O4±δ, LiMn1.6Ni0.2Pd0.1W0.1O4±δ, LiMn1.6Ni0.2Ir0.1W0.1O4±δ, LiMn1.6Ni0.3W0.1O4±δ, and LiMn1.6Ni0.2Ru0.1W0.1O4±δ had approximately 10% larger current capacity and approximately 0.1 V higher average charge – discharge potential than LiMn2O4 without additives. The charge compensation of lithiation and delithiation could be caused by the valence change of Mn (Mn4+ ⇌ Mn3+) and Ni ions (Ni3+ ⇌ Ni2+), which was estimated by XANES spectroscopy.
GRAPHICAL ABSTRACT

IMPACT STATEMENT
The appropriate additives for LiMn2O4-based materials (cathode material for LIBs) were searched for using high-throughput experiments and machine learning without fabricating electrochemical cells, which were laborious experiments.
1. Introduction
Materials informatics (MI) techniques [Citation1,Citation2] are being used to improve the properties of materials in a short period of time [Citation3–10]. Sufficient data are required for MI. However, using experimental data collected from many studies for MI is difficult because of the large differences in processes and conditions between studies. Moreover, the detailed experimental conditions are typically not stated in many studies, and the instrument-dependent unknown factors may be hidden. Thus, systematic data should be collected by homemade high-throughput (HT) experiments under constant, controlled conditions [Citation11,Citation12]. In this study, we searched for appropriate additives that could improve the current capacity of LiMn2O4 using HT experiments and MI techniques.
The importance of improving the performance of lithium-ion batteries (LIBs) is widely known. One of the key factors is high-performance electrode active materials, especially Co-free materials, because Co is a rare element. In this study, we focus on improving the performance of LiMn2O4 as a positive electrode active material. LiMn2O4 is a candidate material for a Co-free positive electrode for a LIB. Its delithiation potential is approximately 4.0 V, while its current capacity (effective current capacity: 110 mAh/g, theoretical current capacity: 148 mAh/g) [Citation13–16] is lower than that of LiCoO2 (effective current capacity: 150 mAh/g, theoretical current capacity: 274 mAh/g) [Citation17–20]. Therefore, the current capacity of LiMn2O4 must be increased. However, the investigation and assessment of a potential active material require a long time because an LIB cell must be fabricated before its performance can be measured. A method that does not require cell fabrication can expedite the material screening process. In this study, we propose an HT method using synchrotron X-rays that avoids cell fabrication. The obtained experimental data were fed to a machine learning model to screen additive materials for higher current-capacity active materials.
First, the material libraries of LiMn1.4NixAyBzO4±δ (x + y + z = 0.6) were synthesized using the ink-jet method, a widely used method to fabricate compositional materials libraries in combinatorial chemistry [Citation21,Citation22]. The libraries were immersed in HCl aqua. to be chemically delithiated and then characterized by X-ray diffraction (XRD) and X-ray absorption near-edge structure (XANES) spectroscopy. The absorption-edge shift of the XANES spectrum indicates the amount of delithiated Li+; therefore, we can screen additives of the active materials with higher capacity by absorption-edge shift without fabricating LIB cells. This hypothesis would be valid according to the references [Citation12,Citation23–28]. Then, we trained a model to predict the absorption-edge shift from composition-based features and applied it to other additive compositions to obtain candidates with higher capacity.
Next, LiMn2O4 particles with the candidate additives were synthesized through a solid-state reaction method, and their charge – discharge properties were verified using a sandwich-type electrochemical cell. In this study, harmful elements were excluded while rare elements were selected because the main purpose of this study was to prove the effectiveness of performing the additive search using HT experiments and MI. However, the long cycle characteristics and durability were not investigated.
2. Methods
2.1. HT experiments
2.1.1. Materials library formed by the ink-jet method
We fabricated the compositional library films (five rows and six columns) on each alumina substrate (size: 25 mm × 30 mm and t = 0.2 mm (A493, KYOCERA Corp., Kyoto, Japan)) with different compositions by using the ink-jet method. The size of the film was 3.5 mm × 3.5 mm. Films with the same composition were deposited at three different positions (10 compositions × 3 positions = 30 films = 5 rows × 6 columns). The ink-jet instrument was the Labojet-1000Q (MICROJET Corp., Shiojiri, Japan), which had four independent ink-jet heads. shows the ink-jet instrument and the library films. The compositions of the library (LiMn1.4NixAyBzO4±δ) were as follows: (A,B) = (Mo, Ir), (Bi, Eu), (Zn, Y), and (Ce, Ru) (x + y + z = 0.6, and x, y, z = 0, 0.2, 0.4, 0.6). From the formula of repeated combinations (3H3), the number of cases was 10. Therefore, the data of 40 compositions could be collected in this study.
Figure 1. Photographs of (a) ink-jet instrument and (b) typical library (after annealing) made by the instrument. ‘Immersion time’ means the time immersed the library in HCl solution.
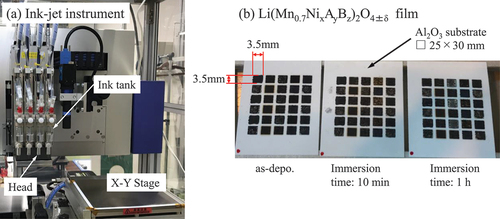
The raw materials for the ink were as follows: LiCH3COO, Mn(CH3COO)2・4H2O, Ni(CH3COO)2・4H2O, (NH4)6Mo7O24・4H2O, Bi(NO3)3・5H2O, Zn(CH3COO)2・2H2O, RuCl3・3H2O, IrCl4, Eu(NO3)3・6H2O, Y(CH3COO)3・H2O, and Ce(CH3COO)3・H2O (Kojundo Chemistry Co., Ltd., Saitama, Japan). The solvent of the ink was deionized water with 5 mass% polyethylene glycol (thickener, average molecular weight: 2700–3300, Fujifilm Wako Pure Chemical Corp., Osaka, Japan) and 0.4 mass% MEGA-8 (surface active agent, DOJIN LABORATORIES, Kumamoto, Japan). A thickener and surface active agent were added to the solvent to prevent the coffee stain effect [Citation29]. The raw materials were dissolved in the ink solvent, and homogeneous aqueous solutions were obtained. The solution concentrations at each tank of the ink-jet head were as follows: (1) LiCH3COO (0.525 M) and Mn(CH3COO)2 (0.7 M); (2) Ni(CH3COO)2 (0.2 M); (3) A-salt (0.2 M); and (4) B-salt (0.2 M) solutions. Considering the evaporation of Li, its amount was set to a value of 5% in excess. The precursor films were automatically deposited on the alumina substrate by printing the appropriate print pattern using the ink-jet instrument.
shows the temperature profile for annealing the precursor library. This profile was estimated by trial and error to obtain high-quality films. Mn and Zn could get evaporated from the library during the annealing; however, the compositional change due to Mn evaporation could be neglected in the case of LiMn2O4 powder [Citation30–33]. In addition, significant changes in the crystal structure at the libraries were not detected by XRD. In this study, we investigated the relationship between the preparation composition and the properties of the libraries; therefore, the effect of the evaporation would be negligible if all samples were calcined under the same conditions and the amount of evaporation was the same.
Figure 2. Temperature profile for annealing the library.
To induce chemical delithiation, the obtained libraries were immersed in 1 M HCl aqueous solution for 10 min, 1 h, and 20 h (HCl treatment) [Citation12,Citation23–25,Citation34]. Therefore, the number of data points in this study was 120 based on the composition and degree of delithiation (including the specimens without delithiation).
2.1.2. Examination of the library using synchrotron
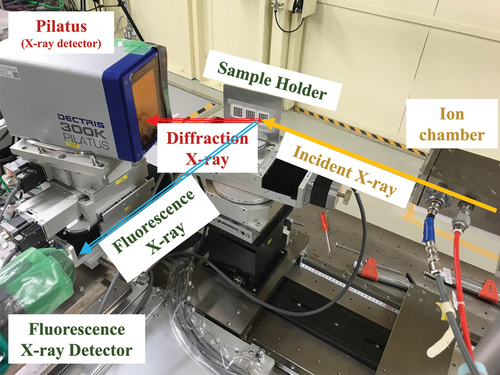
To identify the phase of each library thin film, the synchrotron radiation facility in BL33XU (Toyota Beam Line) at SPring-8 (Hyogo, Japan) was used [Citation35,Citation36]. The system settings are shown in . The library film was attached to a sample holder equipped with an XY stage. The XRD data of the entire composition of the library films were rapidly obtained by irradiating them with X-rays with a wavelength of 0.8 Å (15.5 keV) while scanning the XY stage and detecting the diffracted light using a two-dimensional detector (PILATUS 300K, DECTRIS AG, Switzerland). The compositions were estimated using the X-ray fluorescence spectra (Detector: Vortex-ME4, Hitachi High-Tech Corp., Japan); however, the compositional data were not used for MI because no significant changes in the compositions due to calcination and chemical delithiation were observed.
Figure 3. Schematic of the HT measurement system at SPring-8.
The XANES spectra of Mn, Ni, Mo, Bi, Zn, Ru, Ir, Eu, Y, and Ce in the electrodes were measured to investigate the electronic state of the ions [Citation26,Citation27,Citation35]. The measurements were performed using the fluorescent X-ray method in the air. Athena was used as analysis software [Citation37]. Note that X-ray photoelectron spectroscopy (XPS) cannot estimate the valence changes of Mn and Ni ions in the oxides because the chemical shift of XPS attributed to the valence changes is extremely small [Citation38,Citation39].
2.2. Searching for additives for Li(Mn,Ni)2O4 by MI technique
We evaluated the absorption-edge shift of Mn ions by comparing the XANES spectra before and after chemical delithiation by acid. The absorption-edge shift is related to the current capacity of the LIB; thus, we used the absorption-edge shift as an objective variable for constructing machine learning models. The material composition was determined by the ink concentration used in the ink-jet experiment. We generated composition-based explanatory variables by transforming the composition data to Magpie features using the Python Matminer package [Citation40,Citation41]. The explanatory variables data were cleaned by removing those with low variance on their own and those that were similar to other explanatory variables. Through this process, the number of explanatory variables was reduced to 31. Then, we used the dataset to train machine learning models, including the support vector regression (SVR) and kernel ridge regression (KRR) models, using the Python Scikit-Learn package (see Table S1) and determined their hyper-parameters by the leave-one-out cross validation (LOOCV) method [Citation42]. The root mean squared error (RMSE) was used as a score to search for hyper-parameters. We also trained the random forest regression (RFR) and ordinary linear regression (OLR) models. The trained SVR and KRR models were used for predicting the absorption-edge shift for other unknown additive compositions included in the ‘exploration dataset’. The formula for these was generated as follows: Because the LiMn2O4 spinel was the base material in the training dataset and Ni was contained in all libraries, we included Ni in the exploration dataset; thus, Ni and one or two selected metal elements were added to LiMn2O4, such as LiMn1.4Ni0.2A0.2B0.2O4, LiMn1.4Ni0.4A0.2O4, or LiMn1.4Ni0.2A0.4O4, where A and B = Sc, Ti, V, Cr, Fe, Cu, Zn, Ga, Ge, Y, Zr, Nb, Mo, Ru, Pd, Ag, In, Sn, Sb, La, Ce, Pr, Nd, Pm, Sm, Eu, Gd, Tb, Dy, Ho, Er, Tm, Yb, Lu, Hf, Ta, W, Ir, and Bi. The following elements were removed from the prediction dataset: Pb, Os, Tl, Hg, and Cd because of their harmfulness; Rh and Re because of their extreme rarity; and Au and Pt because of their high resistance to oxidation.
In addition, additive elements for which detailed information had already been reported were also excluded. Notably, Co was not selected because LiMn2O4 was a representative Co-free positive material. Meanwhile, Ir was selected regardless of its extreme rarity because IrO2 was the main material for catalysts and electrodes.
The applicable domain was set to have a three times wider range than the experimental data range in the explanatory variable space to obtain a sufficient number of candidate materials. The predicted shift values for the unknown dataset were not exact, but they can be used to screen and infer the trend of the additives. Thus, a list of candidate additive compositions for a higher current capacity was obtained. We carefully checked the list in terms of chemical affordability and ease of synthesis and selected the additive for the scale-up experiments for experimental verification.
2.3. Experimental verification
2.3.1. Synthesis of LiMn1.6Ni0.2A0.1B0.1O4 particles
The select candidate composition by the machine learning model were synthesized by a conventional solid-state reaction. Li2CO3, Mn2O3, NiO, WO2, MoO2, IrO2, PdO, RuO2, Fe2O3, GeO2, CuO, Bi2O3, and SnO2 (purity above 99.9%, Kojundo Chemicals Labs., Japan) were used as raw materials. The raw materials were weighed and mixed by a mortar. The mixed powders were calcined in air at 1173 K for 10 h twice. The calcined specimens were pulverized in a mortar, and then were calcined in air at 1173 K for 10 h and at 973 K for 30 h again. The obtained powders were used as the active materials. Identification of the obtained phases was performed by the X-ray diffraction (XRD) analysis by Ultima IV (Rigaku Corp., Tokyo, Japan) using Cu Kα.
2.3.2. Electrochemical properties
The electrochemical behavior of the obtained active materials as the working electrode was examined using the sandwich-type electrochemical cell of Type TJ-AC (Tomcell Co. Ltd., Osaka, Japan) with a lithium foil supported on a stainless steel (SUS304) plate as the counter electrode [Citation43–45]. The working and counter electrodes separated by a microporous polypropylene film (E20MMS, Tonen Chemical Corp., Tokyo, Japan) were immersed in 1 M LiTFSI (Lithium Bis(trifluoromethanesulfonyl)imide, Mitsubishi Materials Electronic Chemical Co., Ltd., Akita, Japan) ethylene carbonate (EC)/dimethyl carbonate (DMC)/ethyl methyl carbonate (EMC) (3/4/3; volume ratio, Kishida Chemical Co., Ltd., Osaka, Japan) electrolyte.
A black viscous slurry of the working electrode mix consisting of 80 mass% the obtained active materials, 10 mass% carbon black (TB5500 (average particle diameter: 25 nm, specific surface area: 225 m2/g), Tokai Carbon Co., Ltd., Tokyo, Japan), and 10 mass% polyvinylidene fluoride (PVDF, KF Polymer #1120, Kureha Corp., Tokyo, Japan) binder dissolved in N-methyl-2-pyrrolidone (NMP) was painted on one side of a aluminum foil for the electrochemical cell, and the painted sheets were dried under vacuum at 393 K for 12 h. The sheets were pressed to increase the electrode density and cut to be the working electrodes. The area of the working electrode was 2 cm2 (diameter: 16 mm), and the amount of the active material on the electrode was approximately 10 mg/cm2.
The electrochemical cells were operated in a galvanostatic mode at the approximately C/10-rate in a voltage window of 3.0–4.9 V at Li+/Li reference potential at 298 K to examine the electrochemical reactivity of the obtained active material for the range from four to five cycles. The main purpose in this study is a kind of material search, therefore, the cycle characteristics and durability of the active materials were not estimated.
The XANES spectra of Mn, Ni, W, Ir, Mo, Pd, and Ru in the electrodes was also measured on BL33XU at SPring-8 to confirm the electronic state of the ions [Citation35]. The measurements were carried on by the transmission method. The electrodes estimated by charging-discharging measurement were sealed by polyimide (Kapton) tape in the globe box under Ar, and the XANES spectrum of the specimens were measured in the atmosphere. Athena was used as an analysis software [Citation37]. The changes of the crystal phases were also estimated by XRD during the charging-discharging measurement.
3. Results and discussion
3.1. HT experiments and additive search by the MI technique using collected data
shows the typical XRD patterns of the material libraries, while reveals the absorption edge of the Mn K-edge using the XANES spectra of the material libraries before and after HCl treatment. First, the XRD patterns were analyzed. Several XRD peaks were gradually changed by HCl treatment. If the pattern changed completely from the initial spinel-type structure, we concluded the structure of the material library had been damaged during delithiation and was not applicable to active materials. shows the gradual XRD peak shift of the material library to a higher angle during HCl treatment, which was attributed to the shrinkage of the crystal structure due to delithiation. If their crystal structure changed to something other than spinel after HCl treatment, the compositions were considered unsuitable as positive electrode active materials because the goal of the search in this study was to find appropriate additives that improve the properties of the LiMn2O4 spinel.
Figure 4. Typical XRD patterns of the materials library created using HT measurement.
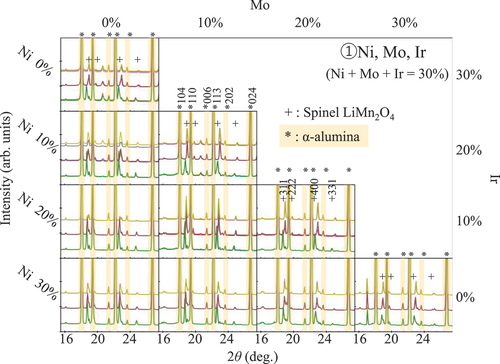
Figure 5. Effect of additives on the absorption energy of Mn K-edge by the XANES spectrum of Mn in the materials library created using HT-XANES measurement.
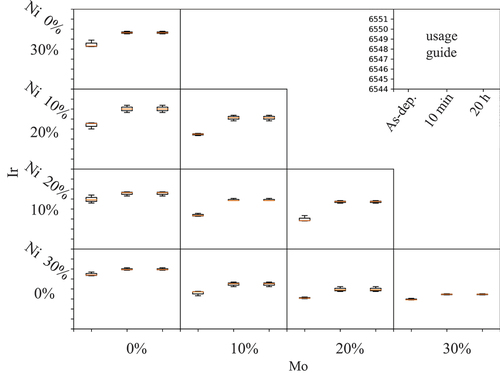
Next, we investigated the magnitude of the absorption-edge shift of Mn in the X-ray absorption fine structure (XAFS) measurement (). A large shift can be attributed to a large amount of delithiation, which may improve the current capacity. The shift does not always indicate an improvement in current capacity but is sufficient for screening additive materials. The shift amount of the absorption edge of Mn was used to estimate the degree of improvement in the current capacity of the LiMn2O4 group.
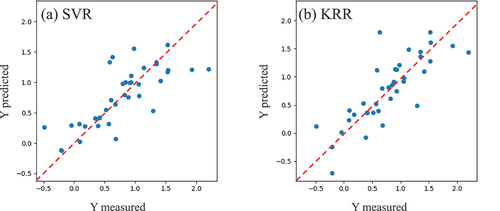
The cross-validation (CV) scores obtained from the KRR and SVR models are similar (see Table S2 for the LOOCV scores). The R2 scores of the KRR, SVR, and RFR models using the full dataset exceeded 0.8 (see Table S3 for all the scores; MAE: mean absolute error); however, these models could be overfitted. shows the predicted versus measured values of each test data set using the LOOCV with the best hyper-parameters. The R2 scores of this plot for KRR and SVR (0.625 and 0.592, respectively) are higher than those of RFR and OLR (see Table S1). These scores are not significantly high because the number of data points is small; however, the model shows a certain relationship between the explanatory and objective variables. In this study, we used a machine learning model to suggest a composition to be synthesized instead of predicting a precise value. Therefore, we used this machine learning model to estimate the absorption-edge shift for the composition dataset of other unknown additives (the exploration dataset). The exploration dataset was generated as described previously. The result was expected to change if another machine learning model was used. The dependence of a synthesis strategy on the model used will be the topic of a future study.
Figure 6. Relationship between the test and predicted data in the LOOCV to search optimal additives for LiMn2O4.
These compositions were transformed into Magpie features and used to predict the absorption-edge shift. Figure S1 shows the distributions of the explanatory values used for the prediction of the exploration dataset. The colored dots indicate the explanatory values in the exploration dataset, and the black dots indicate those in the training dataset of the model. A value in the exploration dataset that is far away from the range of the training dataset would be an ‘extrapolation’, which might result in low reliability. Therefore, we set the applicable domain in the exploration space of the exploration dataset to be three times the size of the initial training dataset. If any value of the explanatory variables is outside of the applicable domain, we reject the predicted value of that composition. By setting a relatively wide exploration space, we aimed to prevent a large reduction in the exploration space and to determine as many candidate materials as possible such that no possible effective additives would be missed.
Table S4 shows the composition candidates with additives ranked in the top 10% of the data predicted by the SVR and KRR models. The experts selected several candidate materials from the list, considering chemical affordability and ease of synthesis. Consequently, the promising additive elements for improving the properties of LiMn2O4 were selected as follows: LiMn1.6Ni0.2Ce0.1Ru0.1O4±δ, LiMn1.6Ni0.2Sn0.1Bi0.1O4±δ, LiMn1.65Ni0.2Cu0.1Bi0.05O4±δ, LiMn1.6Ni0.2Ir0.1Mo0.1O4±δ, LiMn1.6Ni0.2Pd0.1W0.1O4±δ, LiMn1.6Ni0.2Ge0.1W0.1O4±δ, LiMn1.6Ni0.2Fe0.1W0.1O4±δ, LiMn1.6Ni0.2Mo0.1W0.1O4±δ, LiMn1.6Ni0.2Ir0.1W0.1O4±δ, LiMn1.6Ni0.3W0.1O4±δ, and LiMn1.6Ni0.2Ru0.1W0.1O4±δ.
3.2. Experimental verification
3.2.1. Synthesis of candidate materials
The specimens with the compositions proposed by the MI were synthesized. For comparison, LiMn2O4 and LiMn1.8Ni0.2O4 were synthesized as standard materials. Figure S2 shows the XRD pattern of the standard materials [Citation13,Citation14,Citation46,Citation47].
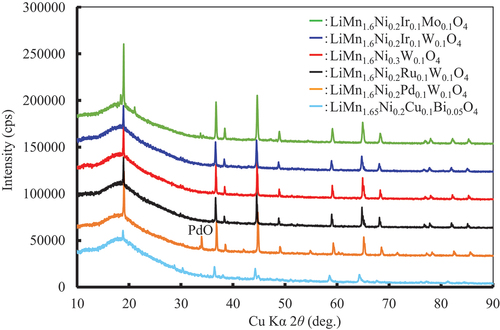
The XRD patterns of all specimens proposed by the MI are shown in Figures S3 and S4. Specimens LiMn1.6Ni0.2Ce0.1Ru0.1O4±δ, LiMn1.6Ni0.2Sn0.1Bi0.1O4±δ, LiMn1.6Ni0.2Ge0.1W0.1O4±δ, LiMn1.6Ni0.2Fe0.1W0.1O4±δ, and LiMn1.6Ni0.2Mo0.1W0.1O4±δ contained large amounts of impurities; therefore, they were not examined further. Consequently, six specimens were investigated in detail, as shown in . shows the XRD patterns of the specimens used for the evaluation of the charge – discharge properties. The main phase of the specimens was spinel-type. However, some peaks of impurities were also observed. The impurities are identified in Figures S3 and S4. In this study, we assumed that the spinel phase could dominate the electrochemical behavior. According to XRD analysis, the amounts of impurities in all specimens except for LiMn1.65Ni0.2Cu0.1Bi0.05O4 were less than 5 mass%. The impurities were composed of heavy elements (in relation to Mn and Ni); therefore, the peak was high. Notably, LiMn1.65Ni0.2Cu0.1Bi0.05O4 was estimated as a representative despite the large amount of impurities it contained.
Figure 7. XRD patterns of LiMn1.6Ni0.2A0.1B0.1O4 (A and B: Ni, W, Mo, Ir, Pd, Ru, Cu, Bi) particles used for the evaluation of the charge – discharge properties.
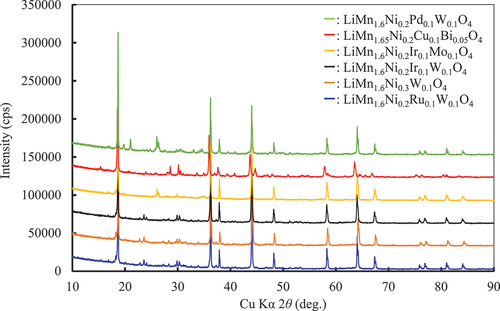
Table 1. Charge – discharge properties of LiMn1.6Ni0.2A0.1B0.1O4 searched using MI (A and B: Ni, W, Mo, Ir, Pd, Ru, Cu, Bi) as the positive electrode active materials.
3.2.2. Charge – discharge properties using electrochemical cell
shows the charge (lithiation) – discharge (delithiation) properties of LiMn1.6Ni0.2A0.1B0.1O4 searched using MI (A and B: Ni, W, Mo, Ir, Pd, Ru, Cu, Bi) as positive electrode active materials. Except for LiMn1.65Ni0.2Cu0.1Bi0.05O4, the remaining five specimens had larger current capacities and higher average potentials than those of LiMn2O4 and LiMn1.8Ni0.2O4. The curves of LiMn2O4 and LiMn1.8Ni0.2O4 as standards are shown in . They are similar to those of LiMn2O4 and LiMn1.8Ni0.2O4 obtained in previous studies [Citation15,Citation16,Citation24,Citation30–34]. Therefore, these materials can be used as standard materials. Notably, LiMn2O4 had poorer cycle characteristics than Li(Mn,Al)2O4 [Citation30]. shows the charge – discharge curves of the active materials with the additives listed in . The shapes of the curves, except for that of LiMn1.65Ni0.2Cu0.1Bi0.05O4, were similar to the shape of the curve for LiMn1.8Ni0.2O4, indicating that the properties changed only minimally over the five-cycle evaluation.
Figure 8. Charge–discharge curves for cells with lithium foil as the negative electrode using synthesized LiMn2O4 and LiMn1.8Ni0.2O4 as the positive electrode active materials. Current density: 0.05 mA/cm2, voltage limits: 3.0 V on delithiation and 4.9 V on lithiation.
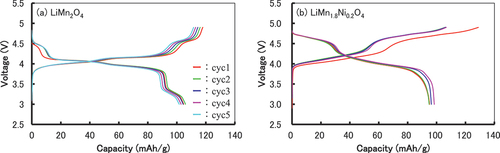
Figure 9. Charge – discharge curves for the cells with lithium foil as the negative electrode using LiMn1.6Ni0.2A0.1B0.1O4 searched using MI (A and B: Ni, W, Mo, Ir, Pd, Ru, Cu, Bi) as the positive electrode active materials. Current density: 0.05 mA/cm2, voltage limits: 3.0 V on delithiation and 4.9 V on lithiation.
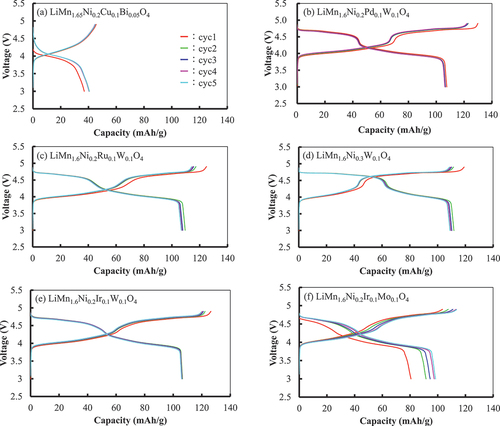
LiMn1.65Ni0.2Cu0.1Bi0.05O4 had an average potential similar to that of LiMn2O4, but its current capacity was remarkably lower than that of LiMn1.8Ni0.2O4, even though its main phase was the spinel phase, as shown in . shows the XRD patterns of the negative electrode with LiMn1.6Ni0.2A0.1B0.1O4 particles after five cycles of lithiation and delithiation. All patterns except that of LiMn1.65Ni0.2Cu0.1Bi0.05O4 were identified as spinel structures. Therefore, the crystal structure of the active materials is retained after the treatment. For LiMn1.65Ni0.2Cu0.1Bi0.05O4, the intensity of the peaks of the spinel phase considerably decreased in relation to those in . The change in diffraction can be attributed to either amorphization or destabilization/precipitation during cycling of the active materials [Citation13,Citation48,Citation49]. Why the small addition of Bi (x = 0.05) caused the observed behavior in this study is unclear; however, a possible explanation of the result is the following: replacing Mn and Ni ions with Bi ions is difficult because the Bi ion radius is larger than the radii of Mn and Ni ions [Citation50]. Therefore, most Bi ions could only form another Bi oxide compound, which possibly interfered with the charging and discharging of the electrodes.
Figure 10. XRD patterns of the negative electrode with LiMn1.6Ni0.2A0.1B0.1O4 particles after five lithiation/delithiation cycles.
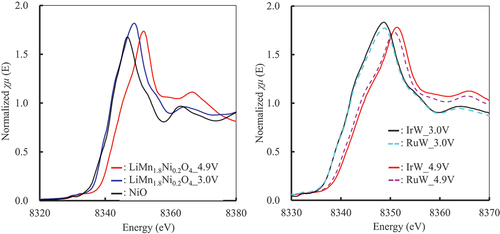
and show the XANES spectra of Mn and Ni in LiMn1.6Ni0.2Ir0.1W0.1O4 and LiMn1.6Ni0.2Ru0.1W0.1O4 in the electrode after five cycles of lithiation and delithiation as representative examples. (All XANES spectra of Mn and Ni are shown in Figure S5 and S6.) The valence of the ions was estimated using the absorption edges by comparing them with those of the standard materials. The valence of the Mn ion in LiMn2O4 changes from 4+ to 3+ by lithiation and from 3+ to 4+ by delithiation [Citation13,Citation27,Citation51]. shows that the differences in the absorption edges of LiMn1.6Ni0.2Ir0.1W0.1O4 and LiMn1.6Ni0.2Ru0.1W0.1O4 due to charging and discharging are the same as those for LiMn2O4. Therefore, the results suggest that the valence of the Mn ion in LiMn1.6Ni0.2Ir0.1W0.1O4 and LiMn1.6Ni0.2Ru0.1W0.1O4 changed between Mn3+ ⇌ Mn4+ during charging and discharging. The valence of the Ni ion also changed with lithiation and delithiation, as shown in [Citation14,Citation27,Citation46]. According to XANES, the valence of the Ni ion in LiMn2O4 changed from 3+ to 2+ by lithiation and from 2+ to 3+ by delithiation. The behavior of the XANES spectra and the change in the valence of the Ni ion in LiMn1.6Ni0.2Ir0.1W0.1O4 and LiMn1.6Ni0.2Ru0.1W0.1O4 were also similar to those in LiMn1.8Ni0.2O4. The valence of the W ion barely changed upon lithiation or delithiation, as shown in Figure S7, thus suggesting that the W ion did not contribute to lithiation or delithiation. Figure S8 and S9 show the XANES spectra of the Ir, Mo, Pd, and Ru ions in LiMn1.6Ni0.2A0.1B0.1O4 in the electrode after five cycles of lithiation and delithiation. The spectra were not changed by the lithiation or delithiation; therefore, the valences of ions also did not change.
Figure 11. XANES spectra of Mn in LiMn1.6Ni0.2A0.1B0.1O4 in the electrode after five lithiation/delithiation cycles (μt: absorbance). IrW: LiMn1.6Ni0.2Ir0.1W0.1O4, RuW: LiMn1.6Ni0.2Ru0.1W0.1O4, 3.0V_dis: lithiated at 3.0 V, 4.9V_charge: delithiated at 4.9 V.
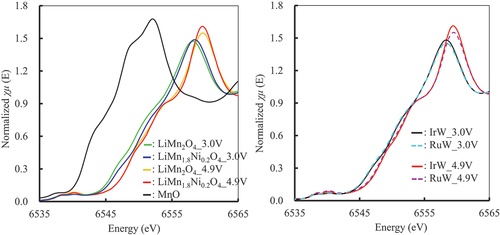
Figure 12. XANES spectra of Ni in LiMn1.6Ni0.2A0.1B0.1O4 in the electrode after five lithiation/delithiation cycles (μt: absorbance). IrW: LiMn1.6Ni0.2Ir0.1W0.1O4, RuW: LiMn1.6Ni0.2Ru0.1W0.1O4, 3.0V_dis: lithiated at 3.0 V, 4.9V_charge: delithiated at 4.9 V.
The XANES spectrum contains important information on the electronic and coordination states of ions; however, the change in the XANES spectrum according to the change in valence is difficult to quantitatively estimate. Recently, methods have been developed to estimate the XANES spectra through first-principles calculations, e. g., FDMNES (finite difference method near-edge structure) [Citation52,Citation53]. The detailed valence and coordination states of the Mn and Ni ions and the explanation of the effect of the additives will be investigated by first-principles calculations in the next project.
In conclusion, the lithiation and delithiation of LiMn1.6Ni0.2A0.1B0.1O4 can be mainly attributed to the change in the valence of the Mn and Ni ions. An increase in the current capacities of the specimens in relation to those of LiMn2O4 and LiMn1.8Ni0.2O4 is caused by the larger valence changes of Mn and Ni ions. However, the reason and mechanism for improvement in the charge – discharge properties by additive elements are not clear because the rationale behind the MI selection has not been explained. The reason why the MI selects the additives is difficult to explain because machine learning models are ‘black boxes’. A large amount of data on the materials can possibly shed light on the reasons. In the next project, we will investigate the reason and the chemical interpretability of the regression results.
4. Conclusion
We have focused on improving the charge – discharge properties of LiMn2O4, which is a positive electrode active material for LIBs, using HT experiments and the MI technique. We demonstrated a screening method for additives for the positive active materials for LIBs without fabricating a LIB cell. First, the necessary data were collected using materials libraries obtained by ink-jet synthesis and HT measurements using the synchrotron. The additives for improving the charge – discharge properties of LiMn2O4 were searched for by the MI technique using the data. LiMn1.6Ni0.2A0.1B0.1O4 particles, along with the candidate additives obtained by the MI model, were synthesized by the solid-state reaction, and the charge – discharge properties of the oxide materials were experimentally estimated. The results showed that LiMn1.6Ni0.2Ir0.1Mo0.1O4±δ, LiMn1.6Ni0.2Pd0.1W0.1O4±δ, LiMn1.6Ni0.2Ir0.1W0.1O4±δ, LiMn1.6Ni0.3W0.1O4±δ, and LiMn1.6Ni0.2Ru0.1W0.1O4±δ had better charge – discharge properties than LiMn2O4 and LiMn1.8Ni0.2O4. These suggest that the combination of the HT experiments and MI technique is an effective method for searching for additives under limited conditions such as those in this study.
Meanwhile, the number of collected data points used in this study was not sufficient to search the entire periodic table. To search for materials with favorable properties in a shorter time, automated experimental equipment is required. Moreover, the chemical interpretability and explanation of the regression results also require a large amount of data.
Author contributions
All authors contributed to the writing of the manuscript and have approved its final version. K.T. oversaw the entire research. M.U. and S.T. carried out the HT experiments. M.U. performed the search for novel materials using the MI technique. S.T. synthesized and measured the materials for the experimental verification.
Supplemental Material
Download PDF (1.9 MB)Acknowledgements
XANES measurements were performed using the BL33XU beam lines at SPring-8 (Hyogo, Japan) with the approval of the Japan Synchrotron Radiation Research Institute (Proposal Nos. 2021A7030, 2021B7030, and 2023A7030). We appreciate the help of Dr. Nonaka and Dr. Miyazaki in conducting the XANES measurements. We also thank Dr. Oka and Dr. Mahara for their fruitful discussions and advice. We would like to thank Editage (www.editage.com) for English-language editing.
Disclosure statement
No potential conflict of interest was reported by the author(s).
Supplementary data
Supplemental data for this article can be accessed online at https://doi.org/10.1080/27660400.2023.2260299
Correction Statement
This article was originally published with errors, which have now been corrected in the online version. Please see Correction (http://dx.doi.org/10.1080/27660400.2024.2317648).
References
- Tabor DP, Roch LM, Saikin SK, et al. Accelerating the discovery of materials for clean energy in the era of smart automation. Nat Rev Mater. 2018;3(5):5–13. doi: 10.1038/s41578-018-0005-z
- Luna PD, Wei J, Bengio Y, et al. Use machine learning to find energy materials. Nature. 2017;552(7683):23–27. doi: 10.1038/d41586-017-07820-6
- Studt F, Abild-Pedersen F, Wu Q, et al. CO hydrogenation to methanol on Cu–Ni catalysts: theory and experiment. J Catal. 2012;293:51–60. doi: 10.1016/j.jcat.2012.06.004
- Gómez-Bombarelli R, Aguilera-Iparraguirre J, Hirzel TD, et al. Design of efficient molecular organic light-emitting diodes by a high-throughput virtual screening and experimental approach. Nat Mater. 2016;15(10):1120–1127. doi: 10.1038/nmat4717
- Seko A, Togo A, Hayashi H, et al. Prediction of low-thermal-conductivity compounds with First-principles anharmonic lattice-dynamics calculations and bayesian optimization. Phys Rev Lett. 2015;115(20):205901. doi: 10.1103/PhysRevLett.115.205901
- Yu L, Kokenyesi RS, Keszler DA, et al. Inverse design of high absorption thin‐film photovoltaic materials. Adv Energy Mater. 2013;3(1):43–48. doi: 10.1002/aenm.201200538
- Hautier G, Jain A, Ong SP, et al. Phosphates as lithium-ion battery cathodes: an evaluation based on high-throughput ab initio calculations. Chem Mater. 2011;23:3495–3508. doi: 10.1021/cm200949v
- Nishijima M, Ootani T, Kamimura Y, et al. Accelerated discovery of cathode materials with prolonged cycle life for lithium-ion battery. Nat Commun. 2014;5(1):4553. doi: 10.1038/ncomms5553
- Chen H, Hautier G, Jain A, et al. Carbonophosphates: a new family of cathode materials for Li-ion batteries identified computationally. Chem Mater. 2012;24(11):2009–2016. doi: 10.1021/cm203243x
- Harada M, Takeda H, Suzuki S, et al. Bayesian-optimization-guided experimental search of NASICON-type solid electrolytes for all-solid-state Li-ion batteries. J Mater Chem A. 2020;8(30):15103–15109. doi: 10.1039/D0TA04441E
- Fujimoto K, Aimi A, Maruyama S. Development of measurement tools for high-throughput experiments of synchrotron radiation XRD and XAFS on powder libraries. ACS Comb Sci. 2020;22(12):734–737. doi: 10.1021/acscombsci.0c00174
- Fujimoto K, Kitajima Y, Aimi A. Effect of chemical oxidation of spinel-type LiNi0.5Mn1.3Ti0.2O4 by soaking in HNO3, HCl and H2SO4. J Solid State Chem. 2021;302:122366. doi: 10.1016/j.jssc.2021.122366
- Tarascon JM, Wang E, Shokoohi FK, et al. The spinel phase of LiMn2O4 as a cathode in secondary lithium cells. J Electrochem Soc. 1991;138(10):2859. doi: 10.1149/1.2085330
- Wei YJ, Yan LY, Wang CZ, et al. Effects of Ni doping on [MnO6] octahedron in LiMn2O4. J Phys Chem B. 2004;108(48):18547–18551. doi: 10.1021/jp0479522
- Zhong Q, Bonakdarpour A, Zhang M, et al. Synthesis and Electrochemistry of LiNixMn2−xO4. J Electrochem Soc. 1997;144(1):205–213. doi: 10.1149/1.1837386
- Guohua L, Ikuta H, Uchida T, et al. The spinel phases LiMyMn2−yO4 (M = Co, Cr, Ni) as the cathode for rechargeable lithium batteries. J Electrochem Soc. 1996;143(1):178–182. doi: 10.1149/1.1836405
- Mizushima K, Jones PC, Wiseman PJ, et al. LixCoO2 (0<x<1): a new cathode material for batteries of high energy density. Mater Res Bull. 1980;15(6):783–789. doi: 10.1016/0025-5408(80)90012-4
- Delmas C. Alkali metal intercalation in layered oxides. Mater Sci Eng B. 1989;3(1–2):97–101. doi: 10.1016/0921-5107(89)90185-2
- Rabou LPLM, Roskam A. Cycle-life improvement of LiLiCoO2 batteries. J Power Sources. 1995;54(2):316–318. doi: 10.1016/0378-7753(94)02091-G
- Takada K, Aotani N, Iwamoto K, et al. Electrochemical behavior of LixMO2 (M = Co, Ni) in all solid state cells using a glass electrolyte. Solid State Ion. 1995;79:284–287. doi: 10.1016/0167-2738(95)00075-H
- Woodhouse M, Parkinson BA. Combinatorial approaches for the identification and optimization of oxide semiconductors for efficient solar photoelectrolysis. Chem Soc Rev. 2009;38(1):197–210. doi: 10.1039/B719545C
- Haber JA, Xiang C, Guevarra D, et al. High-throughput mapping of the electrochemical properties of (Ni-Fe-Co-Ce)Ox oxygen-evolution catalysts. ChemElectrochem. 2014;1(3):524–528. doi: 10.1002/celc.201300229
- Badch A, Campo LD, Albering JH, et al. Chemical delithiation and exfoliation of LixCoO2. J Solid State Chem. 2014;220:102–110. doi: 10.1016/j.jssc.2014.08.011
- Knight JC, Therese S, Manthiram A. Delithiation mechanisms in acid of spinel LiMn2-xMxO4 (M = Cr, Fe, Co, and Ni) cathodes. J Electrochem Soc. 2014;162(3):A426–A431. doi: 10.1149/2.0661503jes
- Endres P, Ott A, Kemmler-Sack S, et al. Extraction of lithium from spinel phases of the system Li1+xMn2−xO4−δ. J Power Sources. 1997;69(1–2):145–156. doi: 10.1016/S0378-7753(97)02604-9
- Society TJX. Foundations and applications of XAFS. Tokyo, Japan: Kodansha Ltd; 2019.
- Terada Y, Yasaka K, Nishikawa F, et al. In situ XAFS analysis of Li(Mn, M)2O4 (M=Cr, Co, Ni) 5V cathode materials for lithium-ion secondary batteries. J Solid State Chem. 2001;156(2):286–291. doi: 10.1006/jssc.2000.8990
- Mahara Y, Nagasako N, Oka H, et al. How fluorine introduction solves the spinel transition, a fundamental problem of Mn-based positive electrodes. ACS Appl Mater Interfaces. 2022;14(21):24321–24331. doi: 10.1021/acsami.2c02868
- Deegan RD, Bakajin O, Dupont TF, et al. Capillary flowasthe cause of ring stains from dried liquid drops. Nature. 1997;389(6653):827–829. doi: 10.1038/39827
- Ariyoshi K, Iwata E, Kuniyoshi M, et al. Lithium aluminum manganese oxide having spinel-framework structure for long-life lithium-ion batteries. Electrochem Solid-State Lett. 2006;9(12):A557–A560. doi: 10.1149/1.2360019
- Ohzuku T, Kitagawa M, Hirai T. Electrochemistry of manganese dioxide in lithium nonaqueous cell: III. X‐ray diffractional study on the reduction of spinel‐related manganese dioxide. J Electrochem Soc. 1990;137(3):769–775. doi: 10.1149/1.2086552
- Palacín MR, Chabre Y, Dupont L, et al. On the origin of the 3.3 and 4.5 V steps observed in LiMn2O4-based spinels. J Electrochem Soc. 2000;147(3):845–853. doi: 10.1149/1.1393281
- Thackeray MM, David WIF, Bruce PG, et al. Lithium insertion into manganese spinels. Mater Res Bull. 1983;18(4):461–472. doi: 10.1016/0025-5408(83)90138-1
- Idemoto Y, Horiko K, Ito Y, et al. Content dependence of crystal structure and electronic structure for chemical delithiation of LixMn2–yMyO4 (M=Mg, Al, Cr, Mn, Co, Zn, Ni) as a cathode active material for Li secondary battery. Electrochemistry. 2004;72:755–762.
- Nonaka T, Dohmae K, Hayashi Y, et al. Toyota beamline (BL33XU) at SPring-8. AIP Conf Proc. 2016;1741:030043.
- Nonaka T, Dohmae K, Araki T, et al. Quick-scanning x-ray absorption spectroscopy system with a servo-motor-driven channel-cut monochromator with a temporal resolution of 10 ms. Rev Sci Instrum. 2012;83(8):083112. doi: 10.1063/1.4746770
- Ravel B, Newville M. Hephaestus: data analysis for X-ray absorption spectroscopy using IFEFFIT. J. Synchrotron Rad. 2005;12(4):537–541. doi: 10.1107/S0909049505012719
- Moulder JF, Stickle WF, Sobol PE, et al. Hand book of X-ray photoelectron spectroscopy. Minnesota: Physical Eectronics, Inc; 1995.
- Briggs D, Seah MP. Practical surface analysis by Auger and X-ray photoelectron spectroscopy. Chichester: John Wiley and Sons Ltd; 1983.
- Ward LT, Agrawal A, Wolverton C. A general-purpose machine learning framework for predicting properties of inorganic materials. NPJ Comput Mater. 2016;2(1):16028. doi: 10.1038/npjcompumats.2016.28
- Ward L, Dunn A, Faghaninia A, et al. Matminer: an open source toolkit for materials data mining. Comput Mater Sci. 2018;152:60–69. doi: 10.1016/j.commatsci.2018.05.018
- Pedregosa F, Varoquaux G, Gramfort A, et al. Scikit-learn: machine learning in Python, Pedregosa et al., JMLR 12. J Mach Learn Res. 2011;12:2825–2830.
- Makimura Y, Sasaki T, Nonaka T, et al. Factors affecting cycling life of LiNi0.8Co0.15Al0.05O2 for lithium-ion batteries. J Mater Chem A. 2016;4(21):8350–8358. doi: 10.1039/C6TA01251E
- Makimura Y, Sasaki T, Nonaka T, et al. Rechargeable capacities and polarizations of LizNi0.75Co0.15Al0.05Mg0.05O2-δ versus LizNi0.8Co0.15Al0.05O2-δ for lithium-ion batteries. J Electrochem Soc. 2017;164(12):A2853–A2860. doi: 10.1149/2.1871712jes
- Makimura Y, Sasaki T, Oka H, et al. Studying the charging process of a lithium-ion battery toward 10 V by in situ X-ray absorption and diffraction: lithium Insertion/Extraction with side reactions at positive and negative electrodes. J Electrochem Soc. 2016;163(7):A1450–A1456. doi: 10.1149/2.1171607jes
- Wu HM, Tu JP, Chen XT, et al. Effects of Ni-ion doping on electrochemical characteristics of spinel LiMn2O4 powders prepared by a spray-drying method. J Solid State Electrochem. 2005;11(2):173–176. doi: 10.1007/s10008-005-0082-y
- Ogihara T, Azuma Y, Katayama K. Synthesis and electrochemical property of LiMnO2 precursor by complexed polymerized method. J Ceram Soc Jpn. 1999;107:465–468.
- Amatucci GG, Pereira N, Zheng T, et al. Failure mechanism and improvement of the elevated temperature cycling of LiMn2O4 compounds through the use of the LiAlxMn2−xO4−zFz solid solution. J Electrochem Soc. 2001;148:A171. doi: 10.1149/1.1342168
- Idemoto Y, Tejima F, Ishida N, et al. Average, electronic, and local structures of LiMn2-xAlxO4 in charge-discharge process by neutron and synchrotron X-ray. J Power Sources. 2019;410-411:38–44. doi: 10.1016/j.jpowsour.2018.10.067
- Shannon RD. Revised effective ionic radii and systematic studies of interatomic distances in halides and chalcogenides. Acta Cryst. 1976;A32(5):751–767. doi: 10.1107/S0567739476001551
- Idemoto Y, Ozawa T, Koura N. Thermodynamic investigation and cathode performance of Li-Mn-O spinel system as cathode active material for lithium secondary battery. J Ceram Soc Jpn. 2001;109:771–776.
- Bunău O, Ramos AY, Joly Y. The FDMNES code international tables for crystallography. Vol. I. 2021.
- Joly Y, Ramos AY, Bunău O. Finite-difference method for the calculation of X-ray spectroscopies international tables for crystallography. Vol. I. 2022.