
ABSTRACT
The new fatigue data sheets, Nos. 135 and 136, disclose the gigacycle fatigue properties of A2017-T4 aluminium alloys. No. 135 shows gigacycle fatigue test results at a stress ratio of R = −1 up to 1010 cycles, obtained by rotating bending fatigue testing at 100 Hz and by ultrasonic fatigue testing at 20 kHz, together with the results obtained by uniaxial loading fatigue testing at 100 Hz up to 108 cycles. No. 136 details the results from high stress ratios obtained by ultrasonic fatigue testing and 100 Hz uniaxial loading fatigue testing. Many specimens failed at over 107 cycles, so conventional fatigue limits were not confirmed, while fatigue failures at over 109 cycles were very rare, suggesting that the fatigue limits are in the gigacycle region. The results of the three types of fatigue tests showed good agreement, indicating the frequency and the stress gradient effects to be negligible. The fatigue strength of the aluminium alloys was proportional to the tensile strength, similar to observations made with low-strength steels at 107 cycles, but lower, at 1010 cycles. The stress ratio effects, which reduced the fatigue strength in stress amplitudes, were not remarkable. The fatigue strengths at high stress ratios were close to the modified Goodman lines, meaning that the stress ratio effects could be estimated using conventional methods.
GRAPHICAL ABSTRACT
IMPACT STATEMENT
This paper presents new fatigue data sheets, titled Nos. 135 and 136, on gigacycle fatigue properties of A2017-T4 aluminium alloy. No. 135 is the gigacycle version at a stress ratio of R = −1 and No.136 is that at high stress ratios.
1. Introduction
NIMS fatigue data sheets comprise a huge database of fatigue properties of structural materials [Citation1]. The total number of fatigue data sheets is currently 133 (Nos. 0–132). This paper describes new fatigue data sheets, titled Nos. 135 and 136.
These fatigue data sheets disclose the gigacycle fatigue properties of A2017-T4, a typical high-strength aluminium alloy, also called Duralumin. It is in wide use because of its high market availability. A series of previous fatigue data sheets disclose the gigacycle fatigue properties of A5083P-O, A7075-T6 and A6061-T6 alloys [Citation2–10]. These comprise three types. The first is low- and high-cycle fatigue properties tested under strain- and load-control conditions, respectively. The second is gigacycle fatigue properties tested by rotating bending and ultrasonic fatigue testing at a stress ratio of R = −1. The third is gigacycle fatigue properties at high stress ratios. The first of the A2017-T4 series, which is a low- and high-cycle version, has already been published [Citation11]. These fatigue data sheets are thus the second and third, i.e. No. 135 is the gigacycle version and No. 136 is that for high stress ratios.
Gigacycle fatigue tests up to 1010 cycles were conducted both by rotating bending at 100 Hz and ultrasonic at 20 kHz, while those at high stress ratios were tested by ultrasonic fatigue testing only. The 100-Hz test takes three years to reach 1010 cycles, whereas 20-kHz testing requires only one week. Uniaxial loading fatigue tests at 100 Hz up to 108 cycles were also conducted for comparison. The materials tested were two heats of bars and one heat of a plate, with anisotropy examined in the plate. Details of the new fatigue data sheets are as follows.
2. Experimental method
2.1. Materials
and show the processing details and chemical compositions of the tested alloys. The tested alloys were a hot-rolled plate and extruded round bars sampled in 2020. shows their mechanical properties. The tensile strengths of the tested alloys ranged from 400 to 539 MPa. The tensile strengths of A2017-T4 were higher than those of A5083P-O and A6061-T6, but lower than those of A7075-T6. The tensile strengths were distributed among the heats. There was minimal anisotropy in the plate.
Table 1. Processing details and related properties of A2017-T4 aluminium alloy.
Table 2. Chemical composition of A2017-T4 aluminium alloy.
Table 3. Mechanical properties of A2017-T4 aluminium alloy.
shows the microstructures of the tested alloys. The microstructures of heats A and C had recrystallized, while those of heat B were fibrous structures with no recrystallization. These fibrous structures were similar to those observed in A7075-T6.
Figure 1. Microstructures of A2017-T4 aluminium alloy.
2.2. Fatigue testing
shows the gigacycle fatigue test conditions. The rotating bending fatigue tests were conducted using a cantilever-type rotating bending fatigue testing machine that had 36 stations to allow the simultaneous testing of multiple specimens. The room temperature and humidity were measured during the rotating bending fatigue tests. The ultrasonic fatigue tests were conducted using a commercial machine that had a very powerful air-cooling system to limit any temperature increase. The uniaxial loading fatigue tests at 100 Hz were conducted using an electromagnetic resonance fatigue testing machine. These fatigue tests were conducted at a stress ratio of R = −1 only.
Table 4. Gigacycle fatigue test conditions.
shows the gigacycle fatigue test conditions at high stress ratios. The fatigue testing machines used were the electromagnetic resonance-type at 100 Hz and the ultrasonic-type at 20 kHz. The stress ratios were R = −1, 0 and 0.3. In addition to these stress ratios, σmax = σy tests were applied, in which the maximum stresses were fixed at 0.2% proof stresses rather than fixing the stress ratio. The σmax = σy test condition corresponded to the highest stress ratio condition, assuming that the materials are used in an elastic region.
Table 5. Gigacycle fatigue test conditions at high stress ratios.
3. Experimental results
3.1. Gigacycle fatigue test results
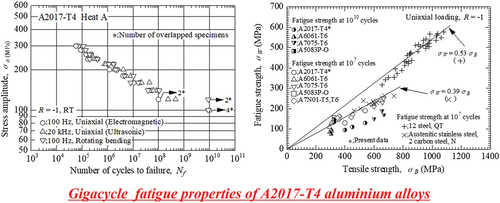
shows the gigacycle fatigue test results. Many specimens failed at over 107 cycles, meaning that fatigue limits were not confirmed during conventional cycles. However, no specimen failed at over 109 cycles, so the fatigue limits appeared to be present in the gigacycle region. The fatigue strength of heat B was the highest, heat A was in between, and heat C was the lowest. This order corresponded to that of tensile strength.
Figure 2. Gigacycle fatigue test results of A2017-T4 aluminium alloy.
shows the humidity measured during the rotating bending fatigue tests. The humidity was high in summer, but low in winter. The highest humidity was 60% or more. There was no obvious correlation between humidity and the fatigue test results. The specimens were exposed to high humidity at over 109 cycles. No specimens failed in that cycle region.
Figure 3. Humidity measured during rotating bending fatigue tests.
shows S-N diagrams that compare the three types of fatigue tests and indicates that differences are very small among the fatigue test types. There are two points to be noted. One is negligible frequency effects, since the 20 kHz test results show good agreement with those at 100 Hz. The other is the very small stress gradient effects in this alloy. The stress gradient effects are typically observed in low-strength steels in which the rotating bending fatigue tests reveal higher fatigue strength than with the uniaxial loading, whereas such differences are not observed in this alloy.
Figure 4. S-N diagram comparing the three types of fatigue tests.
shows the estimated mean fatigue strengths at both 107 and at 1010 cycles. They show average values between the maximum stress amplitude at which no specimen is fractured and that just above it.
Table 6. Estimated mean fatigue strengthsa at 107 and 1010 cycles in A2017-T4 aluminum alloy at R = −1 (stress amplitude in MPa).
shows comparisons of fatigue strengths between aluminium alloys and steels. The fatigue strengths of the aluminium alloys reveal a linear relationship with tensile strength. With uniaxially-loaded steels, the relationship between fatigue strength σW and tensile strength σB is σW = 0.53σB for quenched and tempered (QT) steels and σW = 0.39σB for austenitic stainless steels and normalized (N) carbon steels. The fatigue strength of the aluminium alloys is very close to σW = 0.39σB at 107 cycles but lower at 1010 cycles. On the other hand, with rotating bending, at both 107 cycles and at 1010 cycles, the fatigue strengths of the aluminium alloys are lower than σW = 0.54σB seen in the steels. The reason is that stress gradient effects, which are negligible in the aluminium alloys, increase the rotating bending fatigue strength of austenitic stainless steels and normalized (N) carbon steels. Cyclic yield stress of the aluminium alloys is very high [Citation11], so the rotating bending fatigue strength is coincident with the uniaxially-loaded fatigue strength since both test conditions are completely elastic. However, this is not the case of the low-strength steels. In other words, the rotating bending fatigue strength is a mixture of stress gradient effects and the material’s fatigue performance.
Figure 5. Comparison of fatigue strengths between aluminium alloys and steels.
shows typical fracture surfaces after the gigacycle fatigue tests. All the specimens failed from surface-nucleated fatigue cracks, with the fracture surfaces revealing typical transgranular fatigue fracture morphologies. Differences in fracture surfaces were very small among the fatigue test types, indicating negligible frequency and stress gradient effects.
Figure 6. Typical fracture surfaces obtained in the gigacycle fatigue tests.
3.2. Gigacycle fatigue test results at high stress ratios
and show the results at high stress ratios. These figures include the results at R = −1 for comparison. Trends in the data are similar between R = −1 and at high stress ratios. Many specimens failed at over 107 cycles, whereas fatigue failures at over 109 cycles were very rare, indicating that fatigue limits were not confirmed in conventional cycles but appeared to be present in the gigacycle region. The fatigue strengths were in the order of tensile strength, i.e. the fatigue strength of heat B was the highest, heat A was in between and heat C was the lowest. A unique point at high stress ratios was the occurrence of internal fractures in several specimens. These internal fractures occurred only at high stress ratios and at over 107 cycles. Although the fatigue tests on heat C were conducted in both the longitudinal and in transverse directions, anisotropy was very small.
Figure 7. Uniaxial loading fatigue test results at 100 Hz at high stress ratios.
Figure 8. Ultrasonic fatigue test results at 20 kHz at high stress ratios.
shows S-N diagrams for evaluating frequency and stress ratio effects. The results at 20 kHz show good agreement with those at 100 Hz, indicating negligible frequency effects. The fatigue strengths in stress amplitudes fall with increasing stress ratios, while the degradations of the fatigue strengths were not noteworthy.
Figure 9. S-N diagram for evaluating frequency and stress ratio effects.
shows the estimated mean fatigue strengths at high stress ratios. They show average values between the maximum stress amplitude at which no specimen is fractured and that just above it. The mean fatigue strengths were estimated at both 107 and at 1010 cycles, while in some cases, the fatigue strengths at 107 cycles could not be determined because of a lack of fatigue failure before 107 cycles. The 1010 cycles fatigue strengths were clearly lower than those for 107 cycles. The fatigue strengths were thus degraded even after the 107 cycles, regardless of the stress ratios.
Table 7. Estimated mean fatigue strengthsa at 107 and 1010 cycles in A2017-T4 aluminium alloy at high stress ratios (stress amplitude in MPa).
shows endurance limit diagrams that compare the fatigue strengths with modified Goodman lines. The fatigue strengths were close to the modified Goodman lines at both 107 and at 1010 cycles.
Figure 10. Endurance limit diagrams.
shows typical fracture surfaces at high stress ratios. Both surface and internal fractures were observed. The surface fracture surfaces at high stress ratios were almost identical to those at R = −1. The internal fracture surfaces were observed only at high stress ratios. Fish-eye patterns were not evident, even for internal fractures. Unlike with A6061-T6 [Citation10], no precipitates were observed at the internal fracture origins. Flat regions were observed at the fracture origins, which resembled facets seen, for example, in titanium alloys [Citation12–14]. The differences in fracture surfaces were negligible between frequencies. The differences between heats were insignificant.
Figure 11. Typical fracture surfaces in σmax = σy tests.
4. Discussion
The first point to be noted is the effects of tensile strength on fatigue strength. The tensile strength of the tested A2017-T4 revealed wide scattering that filled the space between A7075-T6 and A6061-T6 (). As a result, it was more clearly confirmed that the fatigue strength of the aluminium alloys was proportional to the tensile strength. The fatigue strength at 107 cycles was close to that of the low-strength steels (σW = 0.39σB), while at 1010 cycles, the fatigue strength was lower than that of the low-strength steels. This trend was confirmed in the results of the uniaxial loading fatigue tests shown in . The rotating bending fatigue test results shown in contain the stress gradient effects that increase the fatigue strength of the low-strength steels. The axial loading fatigue test results were thus more appropriate for comparing the fatigue strength between aluminium alloys and steels.
The second point concerns frequency effects. The present fatigue test results revealed that ultrasonic fatigue testing at 20 kHz was comparable to conventional fatigue testing at 100 Hz (). Ultrasonic fatigue testing, which applies 1010 cycles in a week, is thus applicable to the aluminium alloys tested. However, this conclusion may perhaps apply only to wrought aluminium alloys tested. As discussed in References [Citation15,Citation16], visible frequency effects were reported in several cast aluminium alloys. These visible frequency effects are attributable to the influence of humidity [Citation17,Citation18]. Several cast aluminium alloys are sensitive to humidity, resulting in a shortened fatigue life, but these influences are not apparent at 20 kHz. On the other hand, wrought aluminium alloys tested are insensitive to humidity (), so this type of frequency effect cannot occur.
The third point is the stress ratio effects. A more specific point is the relationship of the fatigue strength with the modified Goodman lines. In past studies, we found serious stress ratio effects on the gigacycle fatigue strength of Ti-6A-4 V alloys [Citation19,Citation20]. With the Ti-6Al-4 V alloys, the stress ratio effects were so large that the gigacycle fatigue strength fell below the modified Goodman lines. This pattern was unusual, since modified Goodman lines generally give safe predictions; this was one reason for our close examination of the stress ratio effects in recent gigacycle fatigue data sheets. This unusual effect was not observed in A2017-T4 (). This was also the case of other aluminium alloys (A5083P-O, A7075-T6 and A6061-T6) [Citation4,Citation7,Citation10]. The stress ratio effects on the aluminium alloys can, therefore, be estimated in conventional ways, such as by using modified Goodman lines.
5. Summary
NIMS fatigue data sheets Nos. 135 and 136 disclose gigacycle fatigue test results for A2017-T4 aluminium alloys. No. 135 is the gigacycle version at a stress ratio of R = −1 and No. 136 is that at high stress ratios. The gigacycle fatigue tests were conducted up to 1010 cycles both by rotating bending fatigue testing at 100 Hz and by ultrasonic fatigue testing at 20 kHz. Uniaxial loading fatigue tests at 100 Hz were also conducted up to 108 cycles for comparison. The fatigue tests at high stress ratios were conducted using ultrasonic and 100-Hz uniaxial load testing.
The gigacycle fatigue test results revealed that fatigue limits were not confirmed at the conventional 107 cycles. They appeared to be present in the gigacycle region, since fatigue failure at over 109 cycles was very rare. The three types of fatigue tests showed comparable results, indicating the effects of frequency and stress gradients to be negligible. The fatigue strength of the aluminium alloys, which was proportional to the tensile strength, was close to that of the low-strength steels at 107 cycles, in spite of being lower at 1010 cycles.
The fatigue strengths in stress amplitudes fell slightly with rising stress ratios. The fatigue strengths were close to the modified Goodman lines, meaning that the stress ratio effects were normal.
Disclosure statement
No potential conflict of interest was reported by the author(s).
References
- Furuya Y, Nishikawa H, Hirukawa H, et al. Catalogue of NIMS fatigue data sheets. Sci Technol Adv Mater (STAM). 2019;20(1):1055–14. doi: 10.1080/14686996.2019.1680574
- Furuya Y, Nishikawa H, Hirukawa H, et al. Data sheets on low-cycle fatigue properties of A5083P-O (Al-4.5Mg-0.6Mn) aluminium alloy plates, NRIM fatigue data sheet, No. 61. Tokyo: National Research Institute for Metals; 1989. doi: 10.11503/nims.1125
- Furuya Y, Nishikawa H, Hirukawa H, et al. Data sheets on giga-cycle fatigue properties of A5083P-O (Al-4.5Mg-0.6Mn) aluminium alloy plates, NIMS fatigue data sheet, No. 119. Tsukuba: National Institute for Materials Science; 2015. doi: 10.11503/nims.1183
- Furuya Y, Nishikawa H, Hirukawa H, et al. Data sheets on giga-cycle fatigue properties of A5083P-O (Al-4.5Mg-0.6Mn) aluminium alloy plates at high stress ratios, NIMS fatigue data sheet, No. 121. Tsukuba: National Institute for Materials Science; 2016. doi: 10.11503/nims.1185
- Furuya Y, Nishikawa H, Hirukawa H, et al. Data sheets on low- and high-cycle fatigue properties of A7075-T6 (Al-5.6Zn-2.5Mg-1.6Cu) aluminium alloy, NIMS fatigue data sheet, No. 123. Tsukuba: National Institute for Materials Science; 2017. doi: 10.11503/nims.1187
- Furuya Y, Nishikawa H, Hirukawa H, et al. Data sheets on giga-cycle fatigue properties of A7075-T6 (Al-5.6Zn-2.5Mg-1.6Cu) aluminium alloy, NIMS fatigue data sheet, No. 125. Tsukuba: National Institute for Materials Science; 2018. doi: 10.11503/nims.1189
- Furuya Y, Nishikawa H, Hirukawa H, et al. Data sheets on giga-cycle fatigue properties of A7075-T6 (Al-5.6Zn-2.5Mg-1.6Cu) aluminium alloy at high stress ratios, NIMS fatigue data sheet, No. 126. Tsukuba: National Institute for Materials Science; 2019.
- Furuya Y, Nishikawa H, Hirukawa H, et al. Data sheets on low- and high-cycle fatigue properties of A6061-T6 (Al-1.0Mg-0.6Si) aluminium alloy, NIMS fatigue data sheet, No. 128. Tsukuba: National Institute for Materials Science; 2020.
- Furuya Y, Nishikawa H, Hirukawa H, et al. Data sheets on giga-cycle fatigue properties of A6061-T6 (Al-1.0Mg-0.6Si) aluminium alloy, NIMS fatigue data sheet, No. 130. Tsukuba: National Institute for Materials Science; 2021.
- Hirukawa H, Furuya Y, Nishikawa H, et al. NIMS fatigue data sheet on gigacycle fatigue properties of A6061-T6 (Al-1.0Mg-0.6Si) aluminium alloy at high stress ratios. Sci Technol Adv Mater: Methods. 2022;2(1):232–249. doi: 10.1080/27660400.2022.2085020
- Furuya Y, Nishikawa H, Hirukawa H, et al. Data sheets on low- and high-cycle fatigue properties of A2017-T4 (Al-4.0Cu-0.6Mg) aluminium alloy. Sci Technol Adv Mater: Methods. 2023;3(1):2234272. doi: 10.1080/27660400.2023.2234272
- Yoshinaka F, Nakamura T, Takeuchi A, et al. Initiation and growth behaviour of small internal fatigue cracks in Ti‐6Al‐4V via synchrotron radiation microcomputed tomography. Fatigue Fract Eng Mater Struct. 2019;42(9):2093–2105. doi: 10.1111/ffe.13085
- Xue G, Nakamura T, Fujimura N, et al. Initiation and propagation processes of internal fatigue cracks in β titanium alloy based on fractographic analysis. Appl Sci. 2021;11(1):131. doi: 10.3390/app11010131
- Xue G, Nakamura T, Fujimura N, et al. Full-life growth behavior of a naturally initiated internal fatigue crack in beta titanium alloy via in situ synchrotron radiation multiscale tomography. Int J Fatigue. 2023;170:107571. doi: 10.1016/j.ijfatigue.2023.107571
- Mayer H. Recent developments in ultrasonic fatigue. Fatigue Fract Eng Mater Struct. 2016;39(1):3–29. doi: 10.1111/ffe.12365
- Furuya Y, Nishikawa H, Hirukawa H, et al. Gigacycle fatigue properties of wrought aluminum alloys. Mater Perform Charact. 2023;12(2):63–77. doi: 10.1520/MPC20220082
- Zhu X, Jones JW, Allison JE. Effect of frequency, environment, and temperature on fatigue behavior of E319 cast aluminum alloy: small crack propagation. Metal Mater Trans. 2008;39A(11):2666–2680. doi: 10.1007/s11661-008-9630-2
- Zhu X, Jones JW, Allison JE. Effect of frequency, environment, and temperature on fatigue behavior of E319 cast aluminum alloy: stress-controlled fatigue life response. Metal Mater Trans. 2008;39A(11):2681–2688. doi: 10.1007/s11661-008-9631-1
- Furuya Y, Takeuchi E. Gigacycle fatigue properties of Ti-6Al-4V alloy under tensile mean stress. Mater Sci Eng A. 2014;598:135–140. doi: 10.1016/j.msea.2014.01.019
- Furuya Y, Nishikawa H, Hirukawa H, et al. Fatigue properties of titanium alloys disclosed in NIMS fatigue data sheets. Sci Technol Adv Mater: Methods. 2023;3(1):2285711. doi: 10.1080/27660400.2023.2285711