
 ?Mathematical formulae have been encoded as MathML and are displayed in this HTML version using MathJax in order to improve their display. Uncheck the box to turn MathJax off. This feature requires Javascript. Click on a formula to zoom.
ABSTRACT
Soft foundations of high embankments exhibit significant time-dependent effect on deformation in decades after construction, and there is a lack of simple method for predicting the creep rate of over-consolidated soft clay under plain strain condition. In this paper, laboratory creep tests under plain strain consolidation with different principal stress ratio were shown. The variation of stress in zero strain direction (σy) under different degree of consolidation was analysed. Linear relationship between (σy) and the applied principal stress σx (or σz) was found. And then, the creep rate of volumetric strain (Cα) and vertical strain (β) were calculated and linked to volumetric stress defined ratio of over-consolidation (OCRp) and stress ratio (K). Finally, the new parameter K∙OCRp was found to have a good correlation with the creep rate (Cα or β).
1. Introduction
Since a booming development of infrastructure constructions from 1980s in China, some unsatisfied performances in many geotechnical projects were exposed after the 30 ~ 40 years’ service period, e.g. large settlement of soft foundations for expressways and buildings without extra applied loading, especially in coastal areas (Chen et al., Citation2014; Li et al., Citation2012). One of the main reasons is the marine clayey foundations exhibited significant time-dependent effect on deformation under a fixed overburden load, termed secondary consolidation or creep. Secondary consolidation is an active topic in the past three decades (Nash et al., Citation1992; Li et al., Citation2009; Zhu, Zhang, et al., Citation2016a; Z.Z. Li et al., Citation2017; Xu et al., Citation2017; Yin & Feng, Citation2017; Gu et al., Citation2019; Lei et al., Citation2020; Sahib & Robinson, Citation2020; Zhou et al., Citation2020) and studied by many researchers considering shear modulus (Mesri et al., Citation1990), swelling behaviour (Feng et al., Citation2017; Vergote et al., Citation2020), freeze–thaw process (J. Li et al., Citation2020), undrained behaviour (Han et al., Citation2021), reconstituted clay (Wu et al., Citation2019) and nonlinear creep (Zhu, Yin, et al., Citation2016b; Feng et al., Citation2017).
Generally, classic existing models of secondary consolidation can be divided into three categories: three-dimensional (3D) model, theoretical model and empirical model. The 3D models, for example, proposed by Adachi and Oka (Citation1982) can capture both deformation and strength characteristics of soil and also be able to consider very complex boundary conditions. However, because of mathematical difficulties the solutions of 3D models need finite element methods (FEM) and might not be applicable to some engineers. The theoretical model was originally developed by Taylor and Merchant (Citation1940) and further studied by Gibson and Lo (Citation1961) and other experts (Kurz et al., Citation2016; Yao & Fang, Citation2020). However, the material parameters used in the theoretical model could not be easily obtained from standard soil tests which hinders its application in engineering. The empirical model based on the simple hypothesis: secondary consolidation separately happens after the end of primary consolidation (EOP), was initially proposed by Buisman (Citation1936). In this model, only the coefficient of secondary consolidation is used, denoted by Cα which is defined as the slope of the compression line in ε-log(t) (or e-log(t)) curve after EOP. Empirical model is widely used by engineers in designing, and during and after construction to evaluate the creep deformation as its simplicity.
As for empirical model, there are two shortcomings being ignored for years. First, the clayey deposits are needed to be preloaded by surcharge, vacuum load or combine surcharge and vacuum load before the construction of the upper pavement in order to reduce the post-construction settlement of soft foundation. This induces an over-consolidated (OC) state of clay after removing the applied load. The soft foundation may have significant deformation even ever experienced a considerable maximum past effective stress (Hu et al., Citation2016; Shi et al., Citation2018; Silvestri, Citation1980; Vergote et al., Citation2020; Yuan et al., Citation2015), i.e. with a large value of over-consolidate ratio (OCR). The second issue is that the soft foundation under high embankment is of plain strain condition typically. Whereas, the current empirical models cannot directly consider the influence of both OCR and plains strain condition in their models yet. This study investigated the creep rate for OC clay under plain strain condition through laboratory tests, and a new simple empirical correlation between the creep rate and the degree of over-consolidation and principal stress ratio (K) was proposed.
2. Test programme
2.1. Apparatus and sample preparation
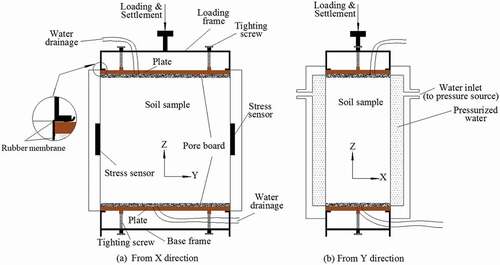
A test equipment for creep under plain strain condition called ‘plain strain creep consolidometer’ (Li et al., Citation2015, Citation2016, Citation2014) was developed as illustrated in . The consolidometer can apply vertical (Z direction) load σz step by step using dead weight and lateral (X direction) load σx through pressurised water contained in a rectangular rubber-chamber to the soil samples. In Y direction, two rigid steel boards were used so that the strain in this direction can be set to zero during test. The stress in Y direction σy can be measured by a stress sensor. The settlement in Z direction and volume of water drained out can be measured and recorded by computer through a data logger.
Figure 1. Illustration of plain strain creep consolidometer
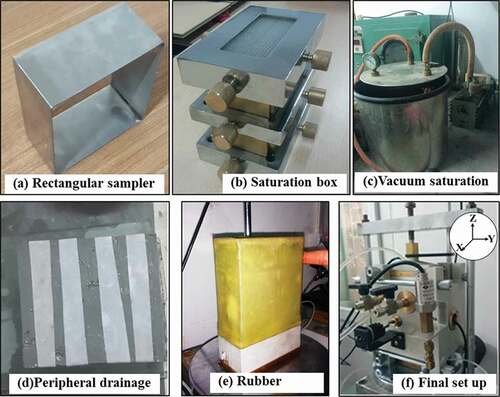
The soil sample adopted in this test has a height of 100 mm in Z direction, width of 100 mm in Y direction and length of 50 mm in X direction. The undisturbed soil samples were cut by a rectangular sampler and then placed into a model box and saturated for more than 24 h before testing. Then, strip pore papers were applied on the sample surface to provide peripheral drainage, and the soil sample was set up into a rubber which has the same dimensions. Finally, the sample was put into the consolidometer and the test was started under two-way drainage conditions. shows the photos of the test process.
Figure 2. Photos of the test process
2.2. Soil used and cases tested
Undisturbed marine clay called Yuedong Clay obtained from Shanfen area in Guangdong province which is located at the southern part of China was used in the tests. Yuedong clay is one of the three typical kinds of clay including Shanghai clay and Tianjin Binhai clay in China. The undisturbed soils were taken from the depth of approximately 6–9 m and sampled using a tube with 140 mm in diameter and 200 mm in height. The two ends of the sampling tube were closed with caps and then moved to the laboratory very soon after sampling. The soil samples were stored in the water to maintain its saturation. The basic soil properties of Yuedong clay are listed in . The cases tested were divided into three groups consisting of seven tests totally. There is only one test conducted in the first group with normally consolidated (NC) sample as comparative test. The rest six tests were separated into two groups in which over-consolidated samples were used, and the principal stress ratio in these two groups was controlled as K = σx/σz = 0.5 and 0.33, respectively. The cases and procedures of the tests are shown in .
Table 1. Basic soil properties of Yuedong clay
Table 2. Detailed steps for reloading
2.3. Test procedure
After preparation of soil sample, the tests were conducted by following the four procedures:
(1) Initial loading: Before the main test, the soil samples were applied an initial load of (σx, σz) = (25, 25) kPa to discharge the extra water and air between the sample and the rubber membrane, and to prepare a uniform initial condition for all tested samples.
(2) Preloading: This procedure only existed in groups 2 and 3. For secondary consolidation tests under OC state in groups 2 and 3, the soil samples were first preloaded to a certain maximum stress by multi-stages under specified stress ratio. The preloading time is 24 h for every loading stage which is enough for completion of primary consolidation. The maximum preloading stress are (200, 400), (150, 300) and (100, 200) kPa corresponding to 2a, 2b and 2 c, and (100,300), (80, 240), (60, 180) kPa corresponding to 3a, 3b, 3 c.
(3) Unloading: In groups 2 and 3, the soil samples were unloaded to (25, 25) kPa again for 24 h.
(4) Consolidation (loading or reloading): After unloading, the soil samples were reloaded step by step to conduct consolidation tests under OC state and every step lasted for 168 h (7 days). In group 1, the 168 hours’ consolidation started immediately after initial loading step. The detailed reloading steps can be found in .
3. Test results and analysis
3.1. Stress in zero stain (Y) direction
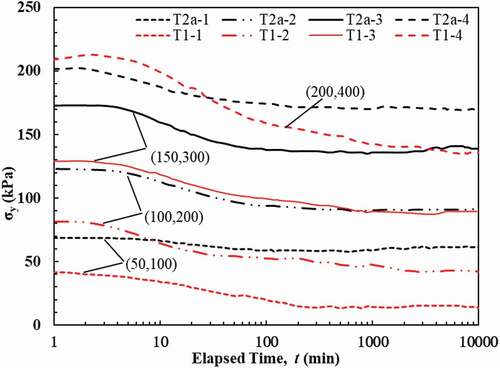
Under plain strain state, the stress in Y direction (σy) reacts as a result of applied stress (σx, σz). shows the results of σy from test T1 for NC soil and T2a for OC soil during consolidation stages. The loading (or reloading) processes in these two tests are exactly the same. First of all, σy decreases with time for both NC and OC soils. After a load of (σx, σz) was applied, the soil will immediately yield a high total stress due to increase of excess pore pressure (u) resulting in a high value of σy. With consolidation process, σy gradually decreases to a steady state finally with dissipation of u. In one-dimensional consolidation test under k0 condition, the lateral stress σh for NC soil is smaller than that for OC soil (Cai et al., Citation2011; El-Sekelly et al., Citation2015). A similar conclusion can be drawn with respect to σy from . Generally, the horizontal stress σy for OC soil is 30 ~ 50 kPa higher than that for NC soil under same external loading.
Figure 3. Comparison of stress in zero strain direction (σy) under normal and over-consolidation states
The results of σy as a function of time during consolidation for OC soils from groups 2 and 3 are shown in , respectively. Under same external loading, e.g. (100,200) kPa in T2a-2, T2b-2 and T2c-2, the sample which experienced larger maximum preloading has higher value of σy. The final value of σy at end of test (i.e, 10000th min) is equal to 91, 79 and 64.5 kPa in T2a-2, T2b-2 and T2c-2, respectively. As well known in one-dimensional consolidation, k0 is increasing with increases of over-consolidation ratio (OCR); thus, σh is bigger corresponding to larger OCR. As for σy under plain strain condition, apparently this conclusion is also true.
Figure 4. Variations of σy with time for OC soils in test 2a, b and c
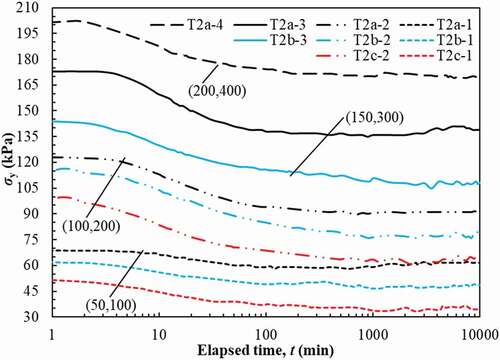
Figure 5. Variations of σy with time for OC soils in test 3a, b and c
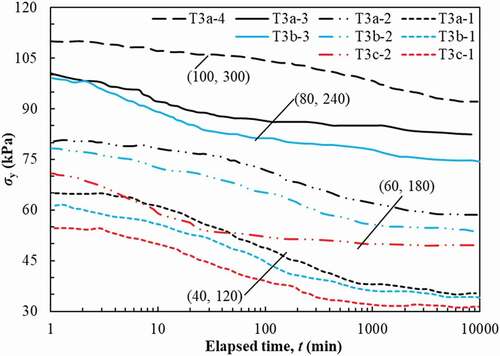
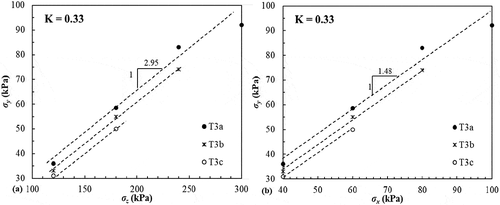
The relationship between final σy (i.e. σy at 10000th min) and σz for K = 0.5 and K = 0.33 are shown in , respectively. First, it can be seen clearly that the σy varies with σz linearly. The slope of σy ~ σz curve is affected uniquely by the stress ratio (K). The slope of σy ~ σz curve for K = 0.5 is about 0.4 () and the value is about 0.34 for K = 0.33 ). In addition, the results from T1, T2 and T3 in indicate that the slope of σy ~ σz curve is independent of consolidated state (NC or OC) and degree of consolidation (i.e. the maximum experienced preload). However, the consolidated state has vital impacts on the magnitude of σy. Under same magnitude of external loading, OC samples (T2a, b, c) have higher values of σy than NC samples (T1). Moreover, comparing T2a, 2b and 2 c in (or T3a, 3b and 3 c in ), it was found that if the sample experienced higher maximum preloading, it yields a larger value of σy. The σy as a function of σx was also shown in ) and ); the slope is 0.8 and 0.67 for K = 0.5 and 0.33, respectively. The value of σy is close to σx in this study. However, σy is the minor principal stress in these two tested cases.
Figure 6. Relationship between final σy and (a) σz, (b) σx for K = 0.5
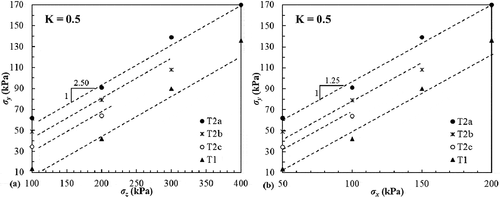
Figure 7. Relationship between final σy and (a) σz, (b) σx for K = 0.33
3.2. Compression and creep coefficient
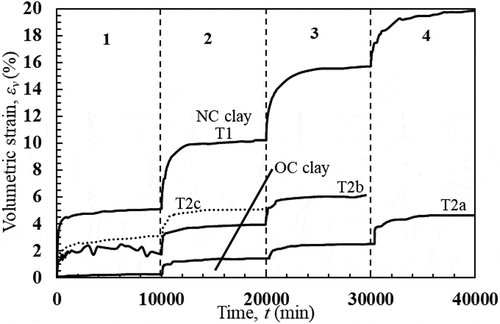
The volumetric strain (εv) was calculated by using the volume of water drained out. εv as a function of time during reloading stages for both T1 and T2 were plotted in . Without surprise, the volumetric strain for NC clay is several times of that for OC clay. And, higher maximum preload in the history yields less volumetric strain under same external loading. Similar results were obtained from tests T3. It is noted here that the friction between the soil sample (membrane) and the rigid board in Y direction was not included in analysis. As mentioned above, for OC clay, the σy is larger than NC clay; thus, OC clay will have larger friction than NC clay. The friction effect on creep deformation was not identical for OC and NC clay, and the creep deformation was underestimated as a result.
Figure 8. Variations of volumetric strain with time for tests T1 and T2 (a, b, c)
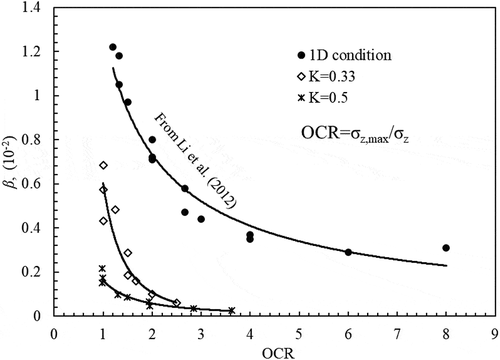
The volumetric creep coefficient, designated as Cα, can be estimated by analysing the εv ~ log (t) curve. The slope of the straight line in the end stage of εv ~ log (t) curve was calculated as Cα. shows an example of the graphical procedure for determining Cα. The values of Cα were evaluated by this graphical method for all steps in groups 2 and 3 (), and the values were used in later section. By the same method, the vertical creep coefficient β was calculated using vertical strain and listed in . In , the variations in β with OCR (σz,max/σz) for tests 2 and 3 together with one-dimensional (1D) creep tests from Li et al. (Citation2012) were plotted. For both plain strain and 1D condition, the creep rate decreases with increase of OCR. However, under 1D condition, the vertical creep rate is generally higher than that under plain strain condition. In plain strain condition, there is an extra active stress, σx, which will compress the soil in X direction and yield lateral compression. As a result, the vertical creep rate under 1D condition is higher than that under plain strain condition with respect to a same magnitude of OCR.
Table 3. Calculated results of volumetric creep coefficient and volumetric stress defined over-consolidation ratio
Table 4. Calculated results of vertical creep coefficient and volumetric stress defined over-consolidation ratio
Figure 9. Graphic procedure for determining Cα: plot the εv ~ log (t) curve firstly, project a straight line along the final linear part of the εv ~ log (t) curve secondly, and calculate the slope of the straight line finally
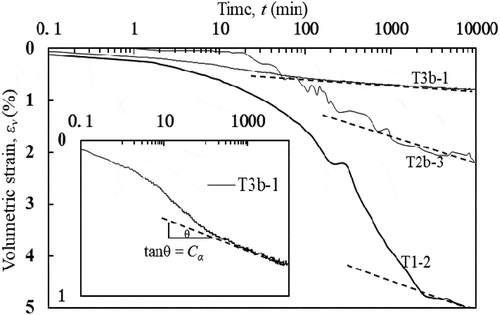
Figure 10. Vertical creep coefficient β for OC clay under plain strain and 1D condition
3.3. New method to predict creep coefficient
In this section, the over-consolidation ratio was innovatively defined using the mean volumetric stress (Li et al., Citation2014) under plane strain condition and designated as OCRP. The novel parameter OCRP can be calculated as
where the subscript ‘MAX’ refers to the maximum stress that the soil experienced before unloading. The representative value of σy used in calculation was obtained at the end of each step (i.e. final σy). The stress history of σx, σy and σz is able to be included into degree of consolidation through this definition.
The values of OCRP for all steps in tests of groups 1, 2 and 3 were calculated by EquationEq. (1)(1)
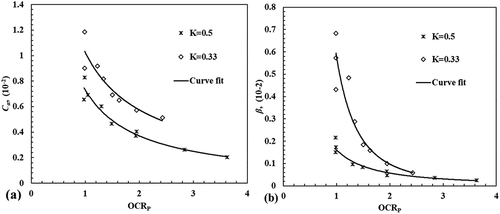
(1) and listed in together with estimated Cα obtained in the above section. The value of OCRp is from 1 to 5 in this study which covers the common range of over-consolidation ratio. The values of Cα and β were linked to OCRP, and the results are shown in ), respectively. In general, Cα and β are decreasing with increase of OCRP significantly for both K = 0.5 and K = 0.33, respectively. The value of Cα decreases by 58.3% as OCRP increases to 2.6 from 1 for K = 0.33. And, Cα decreases by 75% as OCRP increases to 4.9 from 1 for K = 0.5. Similar results were observed in β ~ OCRp curve.
Figure 11. (a) Cα and (b) β as a function of OCRP.
As an indicative result, engineers can control the creep deformation and rate by properly applying a larger magnitude of surcharge preloading in practice. It is also observed that the relationship between Cα and OCRP is nonlinear, and the reduction rate of Cα is decreasing significantly with increase of OCRP. Thus, excessive preloading beyond a certain point might not be an economic and reasonable choice to reinforce the post-construction performance of a soft foundation.
The stress ratio K has significant effect on creep rate under plain strain condition. It is clear that Cα is higher for K = 0.33 than that for K = 0.5. This result indicated that reduction of lateral confining pressure will cause an increase of total volumetric strain. Similar to Cα, β is larger for smaller value of K, i.e. 0.33. As mentioned above, smaller σx yields less lateral compression or more lateral extension, and thus a faster vertical creep rate.
In order to consider the effect of K, we plotted Cα as a function of K∙OCRP for test 1 (NC clay), 2 and 3 (OC clay) in . It was interestingly found that there is a clear correlation between Cα and K∙OCRP which can be expressed by
Figure 12. (a) Cα and (b) β as a function of K∙OCRP.
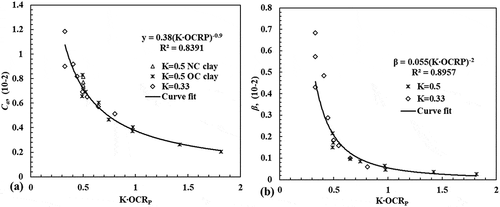
where a and b are constants, equal to 0.38 and −0.9, respectively, for Yuedong clay. By EquationEq. (2(2)
(2) ), the creep coefficient of volumetric strain can be approximated with known value of OCRP and K. Note that EquationEq. (2)
(2)
(2) is also validated for NC clay when OCRp = 1.0.
The relationship between β and K∙OCRP can be expressed as
where m and n are constants, equal to 0.055 and −2.0, respectively. The variations of β are similar to Cα. Based on the analysed results, we can conclude that for the clay used in this study, OCRP ≈ 2.0 is an economic value for preloading design under which the soil yields a relatively acceptable deformation after unloading.
4. Conclusions
In this study, laboratory creep tests were presented and the relationship between the creep rate and stress condition was investigated. Based on the tests results and theoretical study, the following conclusions can be drawn.
(1) The stress in zero strain direction σy for over-consolidated clay is higher than normal consolidated clay, and higher with larger degree of consolidation. The ratio of σy/σz is uniquely related with principal stress ratio (K), and the ratio is 0.4 and 0.34 for K = 0.5 and 0.33, respectively.
(2) The creep rate under one-dimensional k0 condition is larger than those under plain strain condition. Stress ratio K has significant effect on creep rate, and smaller value of K will yield larger creep rate as a result of less lateral constraint.
(3) The creep rate of OC clay under plain strain condition can be predicted reasonably by the novel parameter K∙OCRP, where OCRP is the volumetric stress defined ratio of over-consolidation. OCRP ≈ 2.0 was suggested for economic preloading design.
Disclosure statement
No potential conflict of interest was reported by the authors.
Data availability statement
The data that support the findings of this study are available from the corresponding author, Y. Zhou, upon reasonable request.
Additional information
Funding
References
- Adachi, T., & Oka, F. (1982). Constitutive equations for normally consolidated clay based on elasto-viscoplasticity. Soils and Foundations, 22(4), 57–70. https://doi.org/https://doi.org/10.3208/sandf1972.22.4_57
- Buisman, A. S. K. 1936. Results of long duration settlement tests. Proceedings of the 1st international conference of soil mechanical foundation engineering, 1: 103–107.
- Cai, G. J., Liu, S. Y., Puppala, A. J., & Tong, L. Y. (2011). Assessment of the coefficient of lateral earth pressure at rest (K0) from in situ seismic tests. Geotechnical Testing Journal, 34(4), 310–320. https://doi.org/https://doi.org/10.1520/GTJ102520
- Chen, J. F., Liu, J. X., Xue, J. F., & Shi, Z. M. (2014). Failure analyses of a reinforced embankment by strength reduction and limit equilibrium methods considering hardening of soft clay. KSCE Journal of Civil Engineering, 18(7), 2043–2050. https://doi.org/https://doi.org/10.1007/s12205-014-0288-6
- El-Sekelly, W., Abdoun, T. H., & Dobry, R. (2015). Effect of overconsolidation on K0 in centrifuge models using CPT and tactile pressure sensor. Geotechnical Testing Journal, 38(2), 150–165. https://doi.org/https://doi.org/10.1520/GTJ20140101
- Feng, W. Q., Lalit, B., Yin, Z. Y., & Yin, J. H. (2017). Long-term non-linear creep and swelling behavior of Hong Kong marine deposits in oedometer condition. Computers and Geotechnics, 84(Apirl), 1–15. https://doi.org/https://doi.org/10.1016/j.compgeo.2016.11.009
- Gibson, R. E., & Lo, K. Y. (1961). A theory of consolidation for soils exhibiting secondary compression. Publication No. 41. Norwegian Geotechnical Institute.
- Gu, C., Wang, Y. Z., Cai, Y. Q., & Wang, J. (2019). Deformation characteristics of saturated clay in three-dimensional cyclic stress state. Canadian Geotechnical Journal, 56(12), 1789–1802. https://doi.org/https://doi.org/10.1139/cgj-2018-0634
- Han, J., Yin, Z. Y., Dano, C., & Hicher, P. Y. (2021). Cyclic and creep combination effects on the long-term undrained behavior of overconsolidated clay. Acta Geotechnica, 16(4), 1027–1041. https://doi.org/https://doi.org/10.1007/s11440-020-01078-5
- Hu, Y. Y., Yang, P., & Yu, Q. Z. (2016). Time effect of secondary consolidation coefficient of over-consolidated soil. China Journal of Highway and Transport, 29(9), 29–37. https://doi.org/https://doi.org/10.19721/j.cnki.1001-7372.2016.09.003
- Kurz, D. R., Sharma, J., Alfaro, M., & Graham, J. (2016). Semi-empirical elastic–thermoviscoplastic model for clay. Canadian Geotechnical Journal, 53(10), 1583–1599. https://doi.org/https://doi.org/10.1139/cgj-2015-0598
- Lei, H. Y., Liu, M., Jiang, Y., & Sun, X. F. (2020). Deformation of Tianjin soft clay and corresponding micromechanism under cyclic loading. Canadian Geotechnical Journal, 57(12), 1893–1902. https://doi.org/https://doi.org/10.1139/cgj-2019-0352
- Li, G. W., Hu, J., Lu, X. C., & Zhou, Y. (2012). One-dimensional secondary consolidation coefficient and lateral pressure coefficient of overconsolidated soft clay. Chinese Journal of Geotechnical Engineering, 34(12), 2198–2205.
- Li, G. W., Huang, K., Ruan, Y. S., Li, X., & Yin, J. H. (2015). The effect of principal stress ratio on creep behavior of over-consolidated clay under plane strain. Chinese Journal of Rock Mechanics and Engineering, 34(12), 2550–2558. https://doi.org/https://doi.org/10.13722/j.cnki.jrme.2014.1579
- Li, G. W., Li, X., Ruan, Y. S., Hou, Y. Z., & Yin, J. H. (2016). Creep model of over-consolidated soft clay under plane strain. Chinese Journal of Rock Mechanics and Engineering, 35(11), 2307–2315. https://doi.org/https://doi.org/10.13722/j.cnki.jrme.2015.1395
- Li, G. W., Sheng, W. G., Jiang, H. Z., & Yin, Z. Z. (2009). Secondary compression characteristics and settlement calculation of soft clay under overloading-unloading and reloading. Chinese Journal of Geotechnical Engineering, 31(1), 118–123. https://doi.org/https://doi.org/10.1016/S1874-8651(10)60073-7
- Li, G. W., Zhou, Y., Ruan, Y. S., Huang, K., & Yin, J. H. (2014). Plane strain tests on creep characteristics of over-consolidated clay. Chinese Journal of Geotechnical Engineering, 36(6), 1028–1035. https://doi.org/https://doi.org/10.11779/CJGE201406006
- Li, J., Tang, Y. Q., & Feng, W. (2020). Creep behavior of soft clay subjected to artificial freeze-thaw from multiple-scale perspectives. Acta Geotechnica, 15(10), 2849–2864. https://doi.org/https://doi.org/10.1007/s11440-020-00980-2
- Li, Z. Z., Nguyen, T. S., Su, G., Labrie, D., & Barnichon, J. D. (2017). Development of a viscoelastoplastic model for a bedded argillaceous rock from laboratory triaxial tests. Canadian Geotechnical Journal, 54(3), 359–372. https://doi.org/https://doi.org/10.1139/cgj-2016-0100
- Mesri, G., Feng, T. W., & Benak, J. M. (1990). Postdensification penetration resistance of clean sands. Journal of Geotechnical Engineering, 116(7), 1095–1115. https://doi.org/https://doi.org/10.1061/(ASCE)0733-9410(1990)116:7(1095)
- Nash, D. F. T., Sills, G. C., & Davison, L. R. (1992). One-dimensional consolidation testing of soft clay from Bothkennar. Geotechnique, 42(2), 241–256. https://doi.org/https://doi.org/10.1680/geot.1992.42.2.241
- Sahib, A. A., & Robinson, R. G. (2020). A review of isotache modeling and secondary consolidation behavior of soft clays. IOP Conference Series: Earth and Environmental Science, 491(1), 012050. https://doi.org/https://doi.org/10.1088/1755-1315/491/1/012050
- Shi, W. J., Wang, J., Guo, L., Hu, X. Q., Fu, H. T., Jin, J. Q., & Jin, F. Y. (2018). Undrained cyclic behavior of overconsolidated marine soft clay under a traffic-load-induced stress path. Marine Georesources and Geotechnology, 36(1), 163–172. https://doi.org/https://doi.org/10.1080/1064119X.2017.1355343
- Silvestri, V. (1980). The long-term stability of a cutting slope in an overconsolidated sensitive clay. Canadian Geotechnical Journal, 17(3), 337–351. https://doi.org/https://doi.org/10.1139/t80-041
- Taylor, D. W., & Merchant, W. (1940). A theory of clay consolidation accounting for secondary compression. Journal of Mathematics and Physics, 19(1–4), 167–185. https://doi.org/https://doi.org/10.1002/sapm1940191167
- Vergote, T. A., Leung, C. F., & Chian, S. C. (2020). Modelling creep and swelling after unloading under constant load and relaxation with Bayesian updating. Géotechnique. https://doi.org/https://doi.org/10.1680/jgeot.20.P.106
- Wu, Z. L., Deng, Y. F., Cui, Y. J., Zhou, A., Feng, Q., & Xue, H. C. (2019). Experimental study on creep behavior in oedometer tests of reconstituted soft clays. International Journal of Geomechanics, 19(3), 04018198.1–04018198.10. https://doi.org/https://doi.org/10.1061/(ASCE)GM.1943-5622.0001357
- Xu, G. F., Peng, C., Wu, W., & Qi, J. L. (2017). Combined constitutive model for creep and steady flow rate of frozen soil in an unconfined condition. Canadian Geotechnical Journal, 54(7), 907–914. https://doi.org/https://doi.org/10.1139/cgj-2016-0139
- Yao, Y. P., & Fang, Y. F. (2020). Negative creep of soils. Canadian Geotechnical Journal, 57(1), 1–16. https://doi.org/https://doi.org/10.1139/cgj-2018-0624
- Yin, J. H., & Feng, W. Q. (2017). A new simplified method and its verification for calculation of consolidation settlement of a clayey soil with creep. Canadian Geotechnical Journal, 54(3), 333–347. https://doi.org/https://doi.org/10.1139/cgj-2015-0290
- Yuan, Y. X., Whittle, A. J., & Nash, D. F. T. 2015. Model for predicting and controlling creep settlements with surcharge loading. 6th International Symposium on Deformation Characteristics of Geomaterials. 931–938. https://doi.org/https://doi.org/10.3233/978-1-61499-601-9-931
- Zhou, Q. J., Chen, X. P., Liu, Z. X., Liu, G. W., & Ma, L. J. 2020. Test study on secondary consolidation behavior of soft soil under different loading paths. IOP Conference Series Earth and Environmental Science 510: 052050. https://doi.org/https://doi.org/10.1088/1755-1315/510/5/052050
- Zhu, H. H., Zhang, C. C., Mei, G. X., Shi, B., & Gao, L. (2016a). Prediction of one-dimensional compression behavior of Nansha clay using fractional derivatives. Marine Georesources & Geotechnology, 35(5), 688–697. https://doi.org/https://doi.org/10.1080/1064119X.2016.1217958
- Zhu, Q. Y., Yin, Z. Y., Hicher, P. Y., & Shen, S. L. (2016b). Nonlinearity of one-dimensional creep characteristics of soft clays. Acta Geotechnica, 11(4), 887–900. https://doi.org/https://doi.org/10.1007/s11440-015-0411-y