
 ?Mathematical formulae have been encoded as MathML and are displayed in this HTML version using MathJax in order to improve their display. Uncheck the box to turn MathJax off. This feature requires Javascript. Click on a formula to zoom.
ABSTRACT
Sea surface temperature (SST) is an important indicator of marine system. In this study, the hybrid physically-statistically based air2water model was modified for the forecasting of SST. The hybrid model combines empiricism and theory, and balances the complexity and accuracy between the process-based physical models and statistical models. Daily observed SST data (2009–2019) from six stations in the Baltic Sea were used for the evaluation of model performance. Two metrics including the root mean squared error (RMSE) and the Nash-Sutcliffe efficiency coefficient (NSE) were used for model assessment. With the increase of air temperature, SST presents a clear warming trend (0.133°C/year–0.166°C/year), and air temperature warms faster than SST in the studied stations. The modelling results indicated that the model performs well for SST forecasting (in the validation period, mean value of RMSE is 1.245°C, and mean value of NSE is 0.961). Cross-validation results showed that the model is transferable in unknown stations. However, the model works a little bit worse in the warm period due to the impact of the upwelling phenomenon. Overall, the model is a promising tool for the prediction of SST.
1. Introduction
Water temperature (WT) is a key variable controlling many processes in estuaries and oceans. With the impact of climate warming, increasing WT will inevitably affect marine ecosystem. For example, Baird et al. (Citation2019) found that the marine ecosystem (Sylt-Rømø Bight, Wadden Sea) becomes less organised and more dissipative with higher WT; Parravicini et al. (Citation2010) found that thermal anomalies up to 4°C above the climatological mean may lead to mortalities of benthic species of the NW Mediterranean during thermal events. In this regard, having a good knowledge of thermal dynamics in marine systems is of great significance.
Sea surface temperature (SST) is an important index as the surface layer interacts directly with the atmosphere. Surface water temperature is a good indicator to show the impact of climate warming and thus it is always used for climate change studies (e.g. Pei et al., Citation2017; Piccolroaz et al., Citation2020, Citation2021). It impacts the energy balance of the other layers as well. In order to have a comprehensive understanding of the thermal dynamics in the marine system, it is important to have a good knowledge of SST variations.
Mathematical models provide good tools for the forecasting of SST. In the past decades, different categories of models were developed, and they include process-based deterministic models (e.g. Brassington, Citation2013) and statistical models (e.g. Jahanbakht et al., Citation2022; Landman & Mason, Citation2001; Wolff et al., Citation2020). Process-based deterministic models are based on energy balance, and they are complex by coupling the atmosphere with the ocean system, which require large computational efforts. Additionally, they need a lot of data as model inputs, such as a full set of meteorological variables, flow, wave, etc. Statistical models are simpler, and by developing the relations of SST with the other impact factors (e.g. air temperature, solar radiation, wind, humidity), they can obtain the approximated estimates of SST. However, they lack of clear physical meaning. To compromise between the above two methods, we propose whether it is possible to have a hybrid physically-statistically based model, which has clear physical meaning and is easy to use, especially for the projection of climate change.
Despite the complexity of the impact of various factors on SST (Shaltout, Citation2019), air temperature is generally a parameter of key importance. Galbraith et al. (Citation2012), by analysing SST in the Gulf of Saint Lawrence, pointed to a strong correlation between SST and air temperature, which is useful in predicting the response of water temperature to changing climate. Positive and high correlations between SST and surface air temperature in the case of the Arabian Sea and Indian Ocean were evidenced in research by Jaswal et al. (Citation2012). An increase in water temperature in all regions of the Baltic Sea is a natural consequence of changes in air temperature and atmospheric circulation (Rukseniene et al., Citation2017). Moreover, it should be emphasised that data regarding air temperature show a high level of record detail, and are publicly available.
In this study, we simply modified the hybrid air2water model, which was initially developed for the forecasting of lake surface water temperatures (Piccolroaz et al., Citation2013). Since its first release, it has been widely used and well justified in different regions (e.g. Heddam et al., Citation2020; Piccolroaz et al., Citation2018, Citation2021; Zhu et al., Citation2021, Citation2020). The model is easy to use and accurate, and it needs only the information of air temperature (Heddam et al., Citation2020; Piccolroaz et al., Citation2021; Zhu et al., Citation2021, Citation2020). We tested the modified model by using the observed SST data from six gauge stations in the Baltic Sea. Water temperature modelling in the Baltic Sea is relatively limited, with several available studies employing very complex models, such as the coupling of circulation and wave models in Alari et al. (Citation2016). These studies mainly focused on the spatial variation of water temperatures (e.g. vertical profile), thus using these models for the prediction of SST is overqualified. For the projection of climate change, we often need only the information of surface water temperatures (e.g. Piccolroaz et al., Citation2020, Citation2021; Woolway et al., Citation2020). In this regard, investigation of simple method is of great significance, which is the aim of this study.
The rest of this paper is organised as follows: Section 2 describes the study area and the data used for model evaluation, and the hybrid model used in this study. Section 3 introduces the results of trend analysis and model performance. Section 4 discusses the results. The primary conclusions are summarised in Section 5.
2. Materials and methods
2.1. Study area and data
The Baltic Sea is an inland shelf sea in North Europe, connected with the North Sea, and further with the World Ocean with a system of the narrow Danish Straits. The surface area of the Baltic Sea is about 415 thousand km2, with a relative depth of 52 m and water resources of 21 thousand km3. The Baltic Sea catchment has an area of 1.7 million km2, accounting for 17% of Europe. A total of 250 rivers flow into the sea, supplying an annual average of 470 km3 of freshwater. The Baltic Sea is characterised by a low rate of water exchange with the World Ocean. Water exchange with the North Sea can be described as estuarial, i.e. with inflows of heavier near-bottom waters and outflow of lighter freshwaters in the surface zone. The climate of the Southern Baltic Sea is mostly determined by the Atlantic Ocean and the East European continent. Except for the northern direction, land surrounding the Baltic Sea favours free movement of air masses from all directions. Due to this, the area constitutes a zone of very frequent exchanges of air masses, resulting in exceptionally high weather variability.
The data concerning sea water temperature come from observations by the Institute of Meteorology and Water Management in Poland. The observations were conducted in the years 2009–2019 in six stations () at a depth of 0.5 m, daily at 6:00 UTC. Daily mean air temperatures from three nearby meteorological stations along the coastal belt were used ().
Figure 1. Study area showing the gauge stations and the corresponding meteorological stations (the numbers and characters are referred to ).
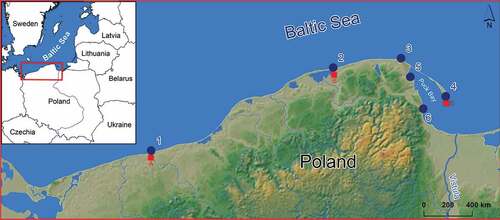
Table 1. The studied gauge stations and the corresponding meteorological stations (Designation according to ).
For all the six studied stations, the observed daily SST is available between 2009 and 2019. Time series data of daily SST and air temperature are shown in . For all the stations, data from 2009 to 2016 were used for model calibration (around 70%), and the remaining data (2017–2019) were used for model validation (around 30%). To check the performance of the model in unknown stations, cross-validation is conducted by training the model using data from five stations (No. 1–5) and using data from the remaining one station (No. 6) as validation.
Figure 2. Time series data of daily sea surface temperature (SST) and air temperature (Ta) for the six studied stations: (1) Kołobrzeg, (2) Łeba, (3) Władysławowo, (4) Hel, (5) Puck, and (6) Gdynia.
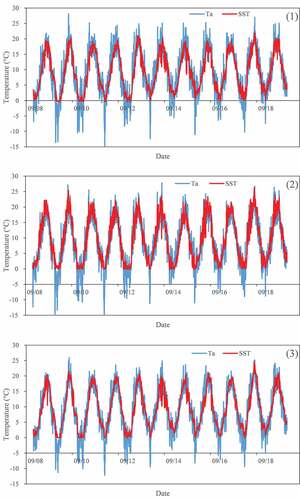
Figure 2. (Continued).
2.2. The hybrid air2water model
The air2water model is a hybrid physically-statistically based model that has been developed initially for the forecasting of lake surface water temperatures. It has been widely used in lakes worldwide, including some very large lakes as Great Lakes (Piccolroaz, Citation2016; Piccolroaz et al., Citation2013) and Lake Baikal (Toffolon et al., Citation2014).
It is based on the energy balance equation of the surface layer (here, we modified the equation for SST forecasting):
where: ρs is density of sea water (1025 kg m−3), cp is heat capacity of water (4186 J kg−1 °C−1), A is the surface area (m2), Vs is the surface volume (m3), is the variation of sea surface temperature (SST) in time (t: days), and Hnet is the net heat flux at the air–water interface (J m−2 day−1). Hnet is the summary of several terms: net shortwave radiation, net longwave radiation, latent and sensible heat fluxes, etc. More detailed information about the term Hnet can be found in Piccolroaz (Citation2016).
By considering air temperature (Ta) as a proxy for the integrated effect of the external forcing following that of Livingstone and Padisák (Citation2007), and using Taylor expansion to expand Hnet as a linear form of Ta and SST, a version with eight parameters can be deduced:
where: a1 to a8 are parameters that can be determined in the calibration period using trial and error method, and their initial ranges can be determined using the method in Toffolon et al. (Citation2014), δ is a dimensionless ratio and it is a function of SST and a reference water temperature of the deep layer (Th; see, EquationEquation (3)(3)
(3) ). Here, Th can be assumed as 5°C for deep ocean layers (as a comparison, Th is assumed as 4°C for dimictic lakes in the original version for the forecasting of lake surface water temperatures). More detailed information can be found in Piccolroaz (Citation2016).
Two metrics are used for the evaluation of model performance: the root mean squared error (RMSE) and the Nash-Sutcliffe efficiency coefficient (NSE; Graf et al., Citation2019). Detailed descriptions of these two metrics can be found in Graf et al. (Citation2019).
where N is the number of data samples, SSTO and SSTM are the observed and modelled sea water temperature at time i, and SSTAV is the average value of SSTO.
3. Results
3.1. Trend analysis
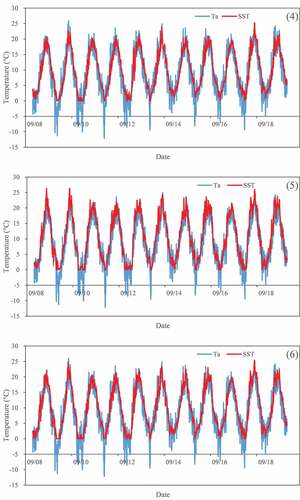
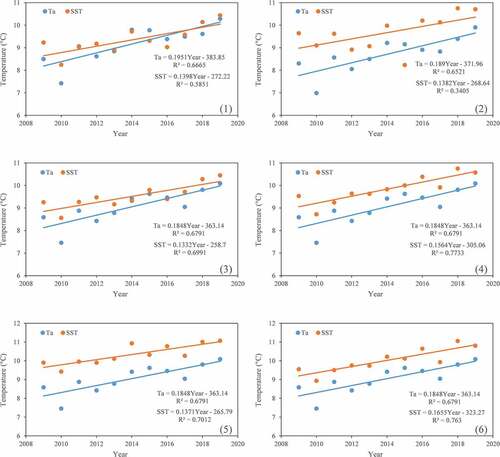
Analysis of the varying trend of annual average SST and Ta is shown in . As seen, for the three meteorological stations, Ta shows clear warming trend with the warming rate ranging from 0.185°C/year to 0.195°C/year. With the increase of Ta, SST presents clear warming trend as well. For the six stations, the warming rate of SST varies between 0.133°C/year and 0.166°C/year. Here, we also analysed the thermal sensitivity of SST to Ta, which is the ratio of the warming rate of SST and Ta. From the results, we found that for all the stations, the thermal sensitivity is below 1.0, and varies between 0.717 and 0.896. The result indicates that Ta warms faster than SST, which is also clearly shown in .
Figure 3. Trend analysis of annual average sea surface temperature (SST) and air temperature (Ta) for the six studied stations: (1) Kołobrzeg, (2) Łeba, (3) Władysławowo, (4) Hel, (5) Puck, and (6) Gdynia.
3.2. Evaluation of model performance
The values of the eight parameters are summarised in . They are determined by trial and error using the objective function (RMSE) by the particle swarm optimiser. These parameter values are in the ranges as reported in the previous studies (e.g. Piccolroaz et al., Citation2021; Toffolon et al., Citation2014).
Table 2. Summary of the parameter values for the studied stations.
For each station, the modelling results (RMSE and NSE) are detailly summarised in . As seen, in the calibration period, RMSE varies between 0.895°C and 1.546°C with an average value about 1.189°C, and NSE values range from 0.950 to 0.980 with an average value of 0.966. In the validation period, RMSE values range from 0.874°C to 1.703°C (average value: 1.245°C), and NSE values vary between 0.920 and 0.982 (average value: 0.961). Generally, the model performs well for SST forecasting, which can also be found in using box-plots.
Figure 4. Box plots showing the modelled and observed sea surface temperature (SST) values for the validation period (2017–2019) at the six studied stations: (1) Kołobrzeg, (2) Łeba, (3) Władysławowo, (4) Hel, (5) Puck, and (6) Gdynia.
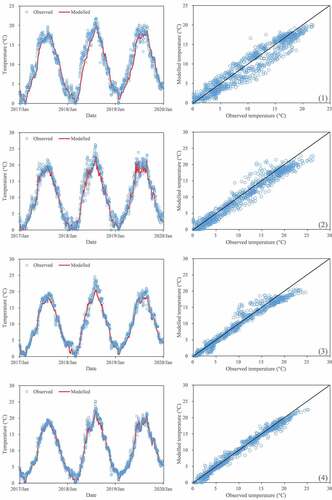
Figure 4. (Continued).
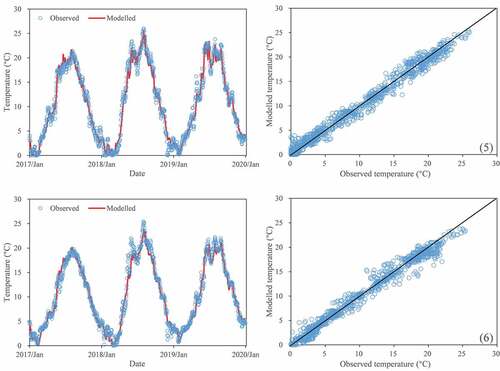
Table 3. Summary of the modelling results for the studied stations.
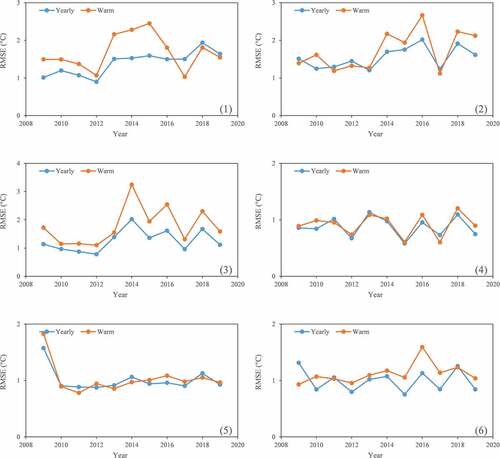
Here, we also evaluated the RMSE values for each year and the warm period (June–September) separately, and the detailed results are shown in . As seen, for each station, RMSE values in the warm period are larger than that of yearly values, indicating that the model works slightly worse in the warm period.
Figure 5. RMSE values for each year (Yearly) and warm period (June–September) at the six studied stations: (1) Kołobrzeg, (2) Łeba, (3) Władysławowo, (4) Hel, (5) Puck, and (6) Gdynia.
To check the performance of the model in unknown stations, cross-validation is conducted by calibrating the model using data from five stations (No. 1–5) and using data from the remaining one station (No. 6) for validation. RMSE values for the calibration and validation phases are 1.546°C and 1.178°C, respectively. The results indicated that the model is transferable in unknown stations.
4. Discussion
The result that Ta warms faster than surface water temperatures has been reported in a lot of studies (e.g. Levitus et al., Citation2000; Li et al., Citation2019; Peng et al., Citation2021; Piccolroaz et al., Citation2021). However, in many studies, it is found that Ta warms slower than surface water temperatures (e.g. Austin & Colman, Citation2007; Shearman & Lentz, Citation2010). For example, Shearman and Lentz (Citation2010) found that water temperatures along the northeastern U.S. coast presented warming rates that are 1.8–2.5 times the regional atmospheric temperature. In this regard, the thermal sensitivity of SST to Ta depends on the studied regions and the local climate.
The methodical approach aimed at precise determination of SST throughout the years continuously evolved. In recent period, research exceeding trend analyses (El-Geziry, Citation2021; Grbec et al., Citation2018; Yu et al., Citation2019) refers to the modelling of its course (Li, Citation2021; Patil & Deo, Citation2017; Yang et al., Citation2018). The present paper corresponds with this narrative. By comparing with the modelling results of Alari et al. (Citation2016), which used a complex model and the RMSE values for three stations varied between 1.75°C and 2.53°C, the model proposed in this study offers simple and yet precise possibilities of modelling SST in the Baltic Sea. By calibrating and validating the model for each available station of the studied region, we can summarise the results and get the overall SST patterns. Cross-validation results showed that the model can be transferred to the other stations in the studied region by obtaining the relationship between air temperature and SST through model training, which is particularly useful for regions with limited observed data.
The temperature of surface waters of the southern coast of the Baltic Sea primarily depends on solar radiation and thermal properties of air masses, as well as on water circulation. Mean seasonal air temperatures have a considerable effect on seasonal water temperatures, and the correction coefficient is the highest in winter and spring (Girjatowicz & Świątek, Citation2019). Stramska and Białogrodzka (Citation2015) highlighted considerable interannual SST variability, which is significantly correlated with interannual variability of the air temperature. In the warm season, solar radiation has a dominant effect on thermal conditions of water (Miętus, Citation1999). In this period, another factor appears, reducing the dependency between SST and air temperature, namely water circulation related to upwelling. Upwelling may be recorded over a period of approximately four months, i.e. during thermal stratification. The phenomenon occurs in the case of strong winds that push warmer surface water replacing them with cooler near-bottom waters from a depth of approximately a dozen metres. In the southern Baltic region, the number of days with upwelling is variable along the coastline, and in particular seasons the phenomenon may not occur at all (Bednorz et al., Citation2019). Czuchaj et al. (Citation2020), analysing SST for five stations on the southern coast, determined that the highest number of rapid daily decreases in water temperature (at least 5°C) occurred in Kołobrzeg (38) and Władysławowo (26). Krezel et al. (Citation2005) indicated that the Kołobrzeg upwelling region had the largest spatial range (up to 5000 km2). In this context, RMSE error analysis for the warm season on the background of the annual course () showed certain spatial variability.
The general division resulted from the location of particular stations. The highest values were recorded in those located towards the open sea, i.e. Kołobrzeg, Łeba, and Władysławowo. The remaining ones include two in the protected Puck Bay (Puck and Gdynia), and the third one, the most specific (located on a peninsula) station in Hel. In the case of the latter, there is a possibility of water inflow from deep marine zones, and exchange with the warmer waters of the shallow Puck Bay the thermal regime of which, according to Klekot (Citation1980), changes very rapidly depending on the effect of air temperature. The physical properties of the sea in the coastal zone depend on various factors, including among others freshwater inflow mentioned by Fernández-Nóvoa et al. (Citation2021). In this context, the role of the Vistula River may be important (second largest river in the basin, average discharge of 1000 m3 s−1). Its temperature strongly depends on air temperature (Ptak et al., Citation2022). Such a situation may affect SST in the eastern part of the analysed region (stations: Hel, Puck, Gdynia), further differentiating the circulation of water masses with different thermal properties in the region. In windless weather or in the case of wind from the southern sector, its waters are distributed perpendicularly northwards. In the case of winds from the western or eastern sector, the discharged river waters are distributed along the marine coast – in accordance with the direction of flow of the littoral current. In such situations, depending on the season, river waters can warm up or cool down marine waters in the coastal zone. Inflow of rivers may contribute to both an increase in SST (Park et al., Citation2011) and cooling of SST (White & Toumi, Citation2014). Such a situation is region-specific. In the case of the Vistula River (station Świbno), in the analysed period, the average annual temperature of water flowing into the Baltic Sea was more than 1°C higher than the SST applied for Puck and Gdynia, and 1.6°C higher than in Hel. In reference to particular months, the variability is even greater. It can be higher in July, by even more than 5°C on average, and in January lower by 1.5°C.
5. Conclusions
In this study, the hybrid physically-statistically based air2water model was modified to be used for SST forecasting, and daily observed SST data from six stations in the Baltic Sea in the period 2009–2019 were used for the evaluation of model performance. The results lead to the following conclusions:
With the increase of air temperature, SST presents clear warming trend (0.133°C/year – 0.166°C/year), and air temperature warms faster than SST for the studied stations.
The model performs well for SST forecasting. In the validation period, RMSE values range from 0.874°C to 1.703°C (average value: 1.245°C), and NSE values vary between 0.920 and 0.982 (average value: 0.961). Cross-validation results showed that the model is transferable in unknown stations.
The model performs slightly bit worse in the warm period due to the impact of the upwelling phenomenon in the studied region. Overall, it is a promising tool for the prediction of SST.
Searching for new solutions offering the determination of the course and scope of changes in SST is necessary due to the transformation of the ecosystem resulting from the co-occurring natural and anthropogenic factors. Though the model shows good performance for SST forecasting using the data from the Baltic Sea, the model still needs to be justified using data from other regions by comparing its performance with other models, which will be the work in the next step.
Acknowledgments
We acknowledge the funding support from Yangzhou University (No. 137012144), State Key Laboratory of Hydraulic Engineering Simulation and Safety, Tianjin University (HESS-2121), Science and Technology Support Program of Jiangsu Province (No. BK20190142), and National Natural Science Foundation of China (No. 51909169). The authors would also like to thank the Institute of Meteorology and Water Management for providing the data used in this study.
Disclosure statement
No potential conflict of interest was reported by the authors.
Data Availability Statement
The data used in this study are available upon request from the corresponding author. https://github.com/slzhu1989?tab=repositories
References
- Alari, V., Staneva, J., Breivik, Ø., Bidlot, J. R., Mogensen, K., & Janssen, P. (2016). Surface wave effects on water temperature in the Baltic Sea: Simulations with the coupled NEMO-WAM model. Ocean Dynamics, 66(8), 917–930. https://doi.org/10.1007/s10236-016-0963-x
- Austin, J. A., & Colman, S. M. (2007). Lake superior summer water temperatures are increasing more rapidly than regional air temperatures: A positive ice‐albedo feedback. Geophysical Research Letters, 34(6), L06604. https://doi.org/10.1029/2006GL029021
- Baird, D., Asmus, H., Asmus, R., Horn, S., & de la Vega, C. (2019). Ecosystem response to increasing ambient water temperatures due to climate warming in the Sylt- Rømø Bight, northern Wadden Sea, Germany. Estuarine, Coastal and Shelf Science, 228(2019) , 106322. https://doi.org/10.1016/j.ecss.2019.106322
- Bednorz, E., Półrolniczak, M., Czernecki, B., & Tomczyk, A. M. (2019). Atmospheric forcing of coastal upwelling in the southern Baltic Sea basin. Atmosphere, 10(6), 327. https://doi.org/10.3390/atmos10060327
- Brassington, G. B. (2013). Multicycle ensemble forecasting of sea surface temperature. Geophysical Research Letters, 40(23), 6191–6195. https://doi.org/10.1002/2013GL057752
- Czuchaj, A., Krawiec, A., Wolny, F., Wrzesiński, D., Karpińska, S., & Świątek, S. (2020). Cyrkulacyjne uwarunkowania nagłych spadków temperatury wody morskiej na polskim wybrzeżu Bałtyku. Bogucki Wydawnictwo Naukowe. in Polish.
- El-Geziry, T. M. (2021). Long-term changes in sea surface temperature (SST) within the southern Levantine basin. Acta Oceanologica Sinica, 40(3), 27–33. https://doi.org/10.1007/s13131-021-1709-2
- Fernández-Nóvoa, D., Costoya, X., deCastro, M., & Gómez-Gesteira, M. (2021). Influence of the mightiest rivers worldwide on coastal sea surface temperature warming. Science of the Total Environment, 768(6), 144915. https://doi.org/10.1016/j.scitotenv.2020.144915
- Galbraith, P. S., Larouche, P., Chassé, J., & Petrie, B. (2012). Sea-surface temperature in relation to air temperature in the Gulf of St. Lawrence: Interdecadal variability and long term trends. Deep-sea Research. Part II, Topical Studies in Oceanography, 77-80(2012) , 10–20. https://doi.org/10.1016/j.dsr2.2012.04.001
- Girjatowicz, J. P., & Świątek, M. (2019). Effects of atmospheric circulation on water temperature along the southern Baltic Sea coast. Oceanologia, 61(1), 38–49. https://doi.org/10.1016/j.oceano.2018.06.002
- Graf, R., Zhu, S., & Sivakumar, B. (2019). Forecasting river water temperature time series using a wavelet–neural network hybrid modelling approach. Journal of Hydrology, 578(2019) , 124115. https://doi.org/10.1016/j.jhydrol.2019.124115
- Grbec, B., Matić, F., Beg Paklar, G., Morović, M., Popović, R., & Vilibić, I. (2018). Long-term trends, variability and extremes of in situ sea surface temperature measured along the eastern Adriatic coast and its relationship to hemispheric processes. Pure and Applied Geophysics, 175(11), 4031–4046. https://doi.org/10.1007/s00024-018-1793-1
- Heddam, S., Ptak, M., & Zhu, S. (2020). Modelling of daily lake surface water temperature from air temperature: Extremely randomized trees (ERT) versus Air2Water, Mars, M5Tree, RF and MLPNN. Journal of Hydrology, 588(2020), 125130. https://doi.org/10.1016/j.jhydrol.2020.125130
- Jahanbakht, M., Xiang, W., & Azghadi, M. R., 2022. Sea surface temperature forecasting with ensemble of stacked deep neural networks. IEEE Geoscience and Remote Sensing Letters. 19(15026050), 1–5 . https://doi.org/10.1109/LGRS.2021.3098425
- Jaswal, A. K., Singh, V., & Bhambak, S. R. (2012). Relationship between sea surface temperature and surface air temperature over Arabian Sea, Bay of Bengal and Indian Ocean. Journal of Indian Geophysical Union, 16(2), 41–53.
- Klekot, L. (1980). Puck Bay-one of the hydrological singularities of the Baltic. Oceanology, 12, 109–123. (in Polish)
- Krezel, A., Ostrowski, M., & Szymelfenig, M. (2005). Sea surface temperature distribution during upwelling along the Polish Baltic coast. Oceanologia, 47(4), 415–432. https://bibliotekanauki.pl/articles/48583
- Landman, W. A., & Mason, S. J. (2001). Forecasts of near-global sea surface temperatures using canonical correlation analysis. Journal of Climate, 14(18), 3819–3833. https://doi.org/10.1175/1520-0442(2001)014<3819:FONGSS>2.0.CO;2
- Levitus, S., Antonov, J. I., Boyer, T. P., & Stephens, C. (2000). Warming of the world ocean. Science, 287(5461), 2225–2229. https://doi.org/10.1126/science.287.5461.2225
- Li, X., 2021. Sea surface temperature prediction model based on long and short-term memory neural network. IOP Conference Series: Earth and Environmental Science. Shenyang, China, 658, 0120402020. IOP publishing.
- Li, X., Peng, S., Deng, X., Su, M., & Zeng, H. (2019). Attribution of lake warming in four shallow lakes in the middle and lower Yangtze River basin. Environmental Science & Technology, 53(21), 12548–12555. https://doi.org/10.1021/acs.est.9b03098
- Livingstone, D. M., & Padisák, J. (2007). Large-scale coherence in the response of lake surface-water temperatures to synopticscale climate forcing during summer. Limnology and Oceanography, 52(2), 896–902. https://doi.org/10.4319/lo.2007.52.2.0896
- Miętus, M. (1999). The role of atmospheric circulation over Europe and north Atlantic in forming climatic and oceanographic conditions in the Polish coastal zone. Materialy Badawcze IMGW, Seria Meteorologia, 29, 157. in Polish
- Park, T., Jand, C. J., Jungclaus, J. H., Haak, H., Park, W., & Oh, I. S. (2011). Effects of the Changjiang river discharge on sea surface warming in the Yellow and East China Seas in summer. Continental Shelf Research, 31(1), 15–22. https://doi.org/10.1016/j.csr.2010.10.012
- Parravicini, V., Guidetti, P., Morri, C., Montefalcone, M., Donato, M., & Bianchi, C. N. (2010). Consequences of sea water temperature anomalies on a Mediterranean submarine cave ecosystem. Estuarine, Coastal and Shelf Science, 86(2), 276–282. https://doi.org/10.1016/j.ecss.2009.11.004
- Patil, K., & Deo, M. C. (2017). Prediction of daily sea surface temperature using efficient neural networks. Ocean Dynamics, 67(3–4), 357–368. https://doi.org/10.1007/s10236-017-1032-9
- Pei, Y. H., Liu, X. H., & He, H. L. (2017). Interpreting the sea surface temperature warming trend in the Yellow Sea and East China Sea. Science China Earth Sciences, 8(8), 1558–1568. https://doi.org/10.1007/s11430-017-9054-5
- Peng, Z., Yang, J., Luo, Y., Yang, K., & Shang, C. (2021). Impact of climate warming on the surface water temperature of plateau lake. Acta Geophysica, 69(3), 895–907. https://doi.org/10.1007/s11600-021-00581-x
- Piccolroaz, S. (2016). Prediction of lake surface temperature using the air2water model: Guidelines, challenges, and future perspectives. Advances in Oceanography and Limnology, 7(1), 36–50. https://doi.org/10.4081/aiol.2016.5791
- Piccolroaz, S., Healey, N. C., Lenters, J. D., Schladow, S. G., Hook, S. J., Sahoo, G. B., & Toffolon, M. (2018). On the predictability of lake surface temperature using air temperature in a changing climate: A case study for Lake Tahoe (USA). Limnology and Oceanography, 63(1), 243–261. https://doi.org/10.1002/lno.10626
- Piccolroaz, S., Toffolon, M., & Majone, B. (2013). A simple lumped model to convert air temperature into surface water temperature in lakes. Hydrology and Earth System Sciences, 17(8), 3323–3338. https://doi.org/10.5194/hess-17-3323-2013
- Piccolroaz, S., Woolway, R. I., & Merchant, C. J. (2020). Global reconstruction of twentieth century lake surface water temperature reveals different warming trends depending on the climatic zone. Climatic Change, 160(3), 1–16. https://doi.org/10.1007/s10584-020-02663-z
- Piccolroaz, S., Zhu, S., Ptak, M., Sojka, M., & Du, X. (2021). Warming of lowland Polish lakes under future climate change scenarios and consequences for ice cover and mixing dynamics. Journal of Hydrology: Regional Studies, 34(2021) , 100780. https://doi.org/10.1016/j.ejrh.2021.100780
- Ptak, M., Sojka, M., Graf, R., Choiński, A., Zhu, S., & Nowak, B. (2022). Warming Vistula River - the effects of climate and local conditions on water temperature in one of the largest rivers in Europe. Journal of Hydrology and Hydrodynamics, 70(1). 1–11. https://doi.org/10.2478/johh-2021-0032
- Rukseniene, V., Dailidiene, I., Kelpsaite-Rimkiene, L., & Soomere, T. (2017). Sea surface temperature variations in the south-eastern Baltic Sea in 1960–2015. Baltica, 30(2), 75–85. https://doi.org/10.5200/baltica.2017.30.09
- Shaltout, M. (2019). Recent sea surface temperature trends and future scenarios for the Red Sea. Oceanologia, 61(4), 484–504. https://doi.org/10.1016/j.oceano.2019.05.002
- Shearman, R. K., & Lentz, S. J. (2010). Long-term sea surface temperature variability along the US East Coast. Journal of Physical Oceanography, 40(5), 1004–1017. https://doi.org/10.1175/2009JPO4300.1
- Stramska, M., & Białogrodzka, J. (2015). Spatial and temporal variability of sea surface temperature in the Baltic Sea based on 32-years (1982–2013) of satellite data. Oceanologia, 57(3), 223–235. https://doi.org/10.1016/j.oceano.2015.04.004
- Toffolon, M., Piccolroaz, S., Majone, B., Soja, A. M., Peeters, F., Schmid, M., & Wuest, A. (2014). Prediction of surface temperature in lakes with different morphology using air temperature. Limnology and Oceanography, 59(6), 2185–2202. https://doi.org/10.4319/lo.2014.59.6.2185
- White, R. H., & Toumi, R. (2014). River flow and ocean temperatures: The Congo River. Journal of Geophysical Research: Oceans, 119(4), 2501–2517. https://doi.org/10.1002/2014JC009836
- Wolff, S., O’Donncha, F., & Chen, B. (2020). Statistical and machine learning ensemble modelling to forecast sea surface temperature. Journal of Marine Systems, 208(2020) , 103347. https://doi.org/10.1016/j.jmarsys.2020.103347
- Woolway, R. I., Kraemer, B. M., Lenters, J. D., Merchant, C. J., O’Reilly, C. M., & Sharma, S. (2020). Global lake responses to climate change. Nature Reviews Earth & Environment, 1(8), 388–403. https://doi.org/10.1038/s43017-020-0067-5
- Yang, Y., Dong, J., Sun, X., Lima, E., Mu, Q., & Wang, X. (2018). A CFCC-LSTM model for sea surface temperature prediction. IEEE Geoscience and Remote Sensing Letters, 15(2), 207–211. https://doi.org/10.1109/LGRS.2017.2780843
- Yu, Y., Zhang, H. R., Jin, J., & Wang, Y. (2019). Trends of sea surface temperature and sea surface temperature fronts in the South China Sea during 2003–2017. Acta Oceanologica Sinica, 38(4), 106–115. https://doi.org/10.1007/s13131-019-1416-4
- Zhu, S., Piotrowski, A. P., Ptak, M., Napiorkowski, J. J., Dai, J., & Ji, Q. (2021). How does the calibration method impact the performance of the air2water model for the forecasting of lake surface water temperatures? Journal of Hydrology, 597(2021) , 126219. https://doi.org/10.1016/j.jhydrol.2021.126219
- Zhu, S., Ptak, M., Yaseen, Z. M., Dai, J., & Sivakumar, B. (2020). Forecasting surface water temperature in lakes: A comparison of approaches. Journal of Hydrology, 585(2020) , 124809. https://doi.org/10.1016/j.jhydrol.2020.124809